
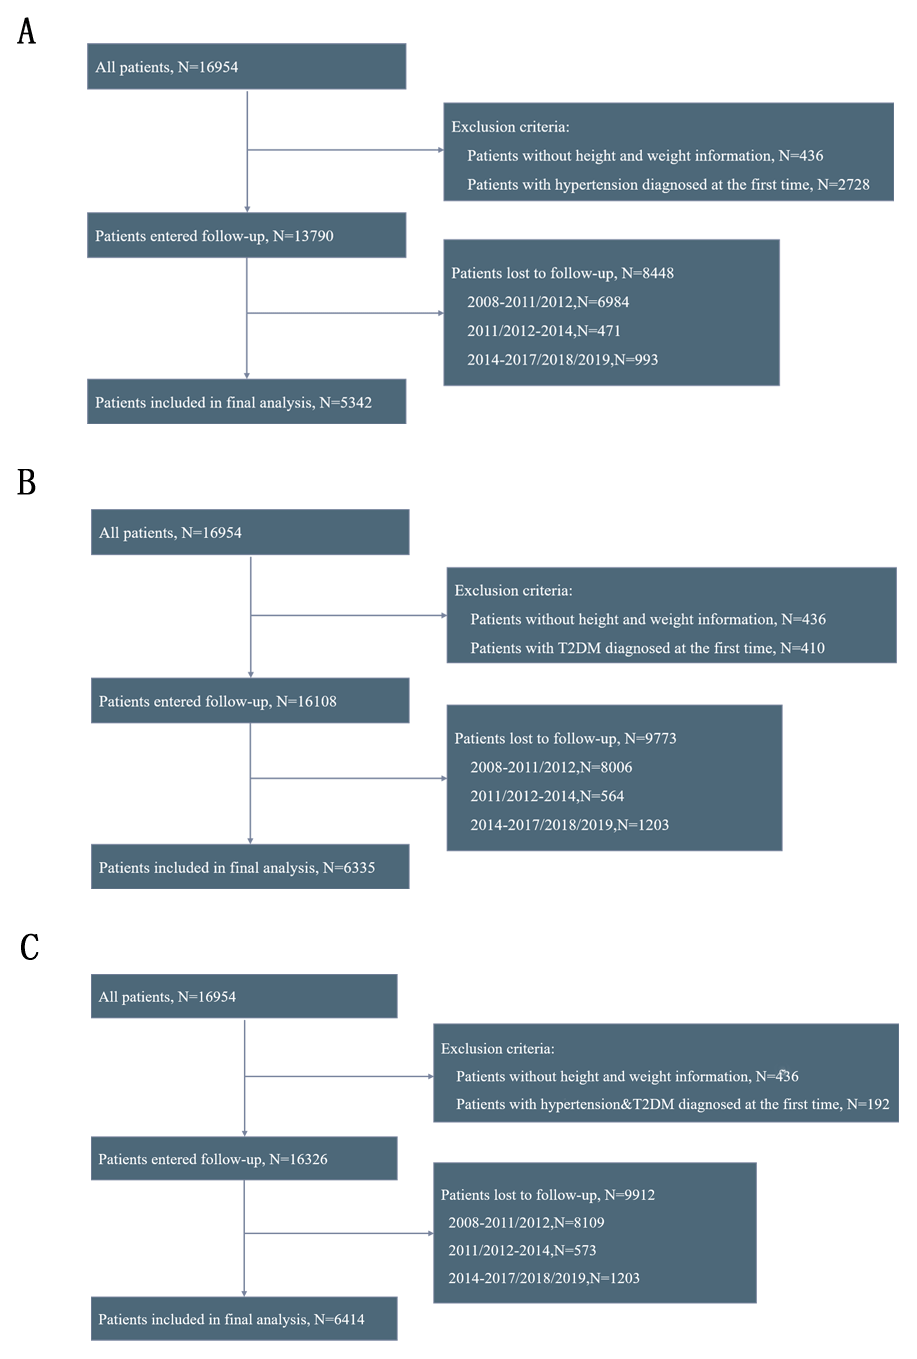
Figure 1
Flowchart of participants screening. (A) hypertension; (B) diabetes; (C) hypertension-diabetes comorbidity.
Note: The participants were first enrolled in 2008, with the first follow-up conducted in 2011 and 2012, the second follow-up in 2014, and the third follow-up in 2017, 2018, and 2019.
Table 1
Baseline characteristics of participants for the outcome of hypertension-diabetes comorbidity.
| VARIABLES | UNDER WEIGHT (n = 1871) | NORMAL WEIGHT (n = 3522) | OVERWEIGHT (n = 774) | OBESITY (n = 180) | P |
|---|---|---|---|---|---|
| BMI | 17.26[16.02,17.83] | 20.81[19.63,22.22] | 25.26[24.46,26.26] | 29.81[28.82,31.59] | <0.001 |
| Age, years | 88.00[79.50,94.00] | 82.00[73.00,90.00] | 78.00[70.00,87.00] | 75.00[68.00,86.00] | <0.001 |
| Male | 1189(63.5) | 1786(50.2) | 395(49.6) | 110(59.1) | <0.001 |
| Ethnic | <0.001 | ||||
| Han | 1689(90.3) | 3343(93.9) | 769(96.5) | 182(97.8) | |
| Hui | 6(0.3) | 11(0.3) | 5(0.6) | 2(1.1) | |
| Zhuang | 142(7.6) | 109(3.1) | 13(1.6) | 1(0.5) | |
| Yao | 11(0.6) | 18(0.5) | 1(0.1) | 0(0.0) | |
| Korea | 10(0.5) | 16(0.4) | 2(0.3) | 0(0.0) | |
| Mongolia | 0(0.0) | 1(0.0) | 0(0.0) | 0(0.0) | |
| Others | 13(0.7) | 62(1.7) | 7(0.9) | 1(0.5) | |
| Current smoking status | <0.001 | ||||
| Yes | 320(17.1) | 787(22.1) | 170(21.3) | 27(14.5) | |
| No | 1551(82.9) | 2773(77.9) | 627(78.7) | 159(85.5) | |
| Current drinking status | <0.001 | ||||
| Yes | 283(15.1) | 790(22.2) | 181(22.7) | 36(19.4) | |
| No | 1588(84.9) | 2770(77.8) | 616(77.3) | 150(80.6) | |
| Current exercise status | <0.001 | ||||
| Yes | 468(25.0) | 1097(30.8) | 317(39.8) | 74(39.8) | |
| No | 1403(75.0) | 2463(69.2) | 480(60.2) | 112(60.2) | |
| Total income of year, CNY | 10000.00[3500.00,23000.00] | 10000.00[4000.00,24250.00] | 10000.00[5000.00,25000.00] | 10000.00[4000.00,25000.00] | 0.102 |
| Current marital status | <0.001 | ||||
| Currently married and living with spouse | 527(28.2) | 1496(42.0) | 413(51.8) | 98(52.7) | |
| Separated | 44(2.4) | 90(2.5) | 12(1.5) | 2(1.1) | |
| Divorced | 6(0.3) | 4(0.1) | 7(0.9) | 3(1.6) | |
| Widowed | 1278(68.3) | 1939(54.5) | 359(45.0) | 82(44.1) | |
| Never married | 16(0.9) | 31(0.9) | 6(0.8) | 1(0.5) | |
| Sleep quality | <0.001 | ||||
| Very good | 209(11.2) | 530(14.9) | 125(15.7) | 36(19.4) | |
| Good | 925(49.4) | 1926(54.1) | 442(55.5) | 104(55.9) | |
| So so | 504(26.9) | 792(22.2) | 152(19.1) | 30(16.1) | |
| Bad | 215(11.5) | 284(8.0) | 69(8.7) | 15(8.1) | |
| Very bad | 17(0.9) | 22(0.6) | 7(0.9) | 1(0.5) | |
| Not able to answer | 1(0.1) | 6(0.2) | 2(0.3) | 0(0.0) | |
| Sleep duration, hours | 8.00[6.00,9.00] | 8.00[6.00,10.00] | 8.00[7.00,10.00] | 8.00[7.00,10.00] | 0.084 |
| Hypertension and DM | 283(15.1) | 719(20.2) | 235(29.5) | 57(30.6) | <0.001 |
[i] BMI: Body mass index, CNY: Chinese Yuan.
BMI category: underweight (BMI < 18.5 kg/m2), normal weight (BMI 18.5–23.9 kg/m2), overweight (BMI 24.0–27.9 kg/m2), and obesity (BMI ≥ 28.0 kg/m2).
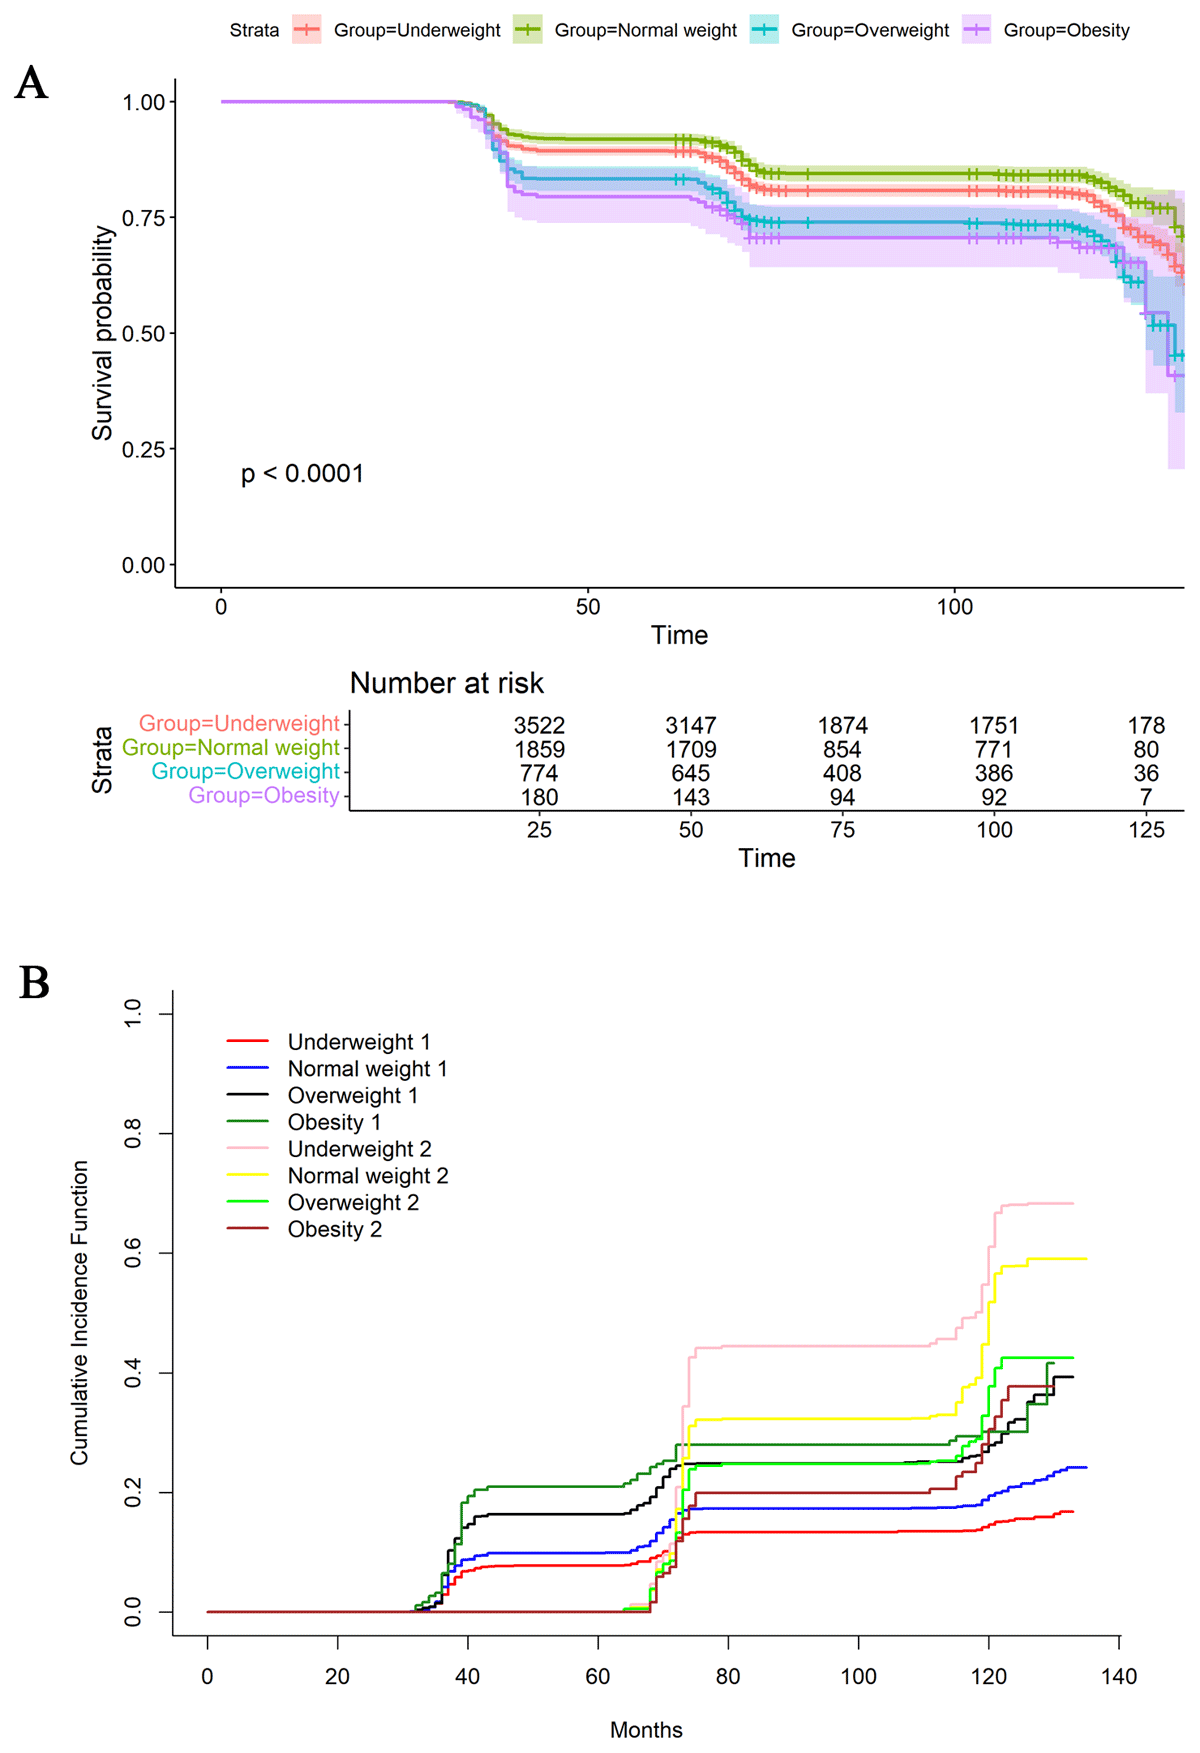
Figure 2
Survival analysis (A) and competing risks analysis regarding death (B) were performed for hypertension-diabetes comorbidity.
Participants were categorized into four groups based on BMI: underweight (BMI < 18.5 kg/m2), normal weight (BMI 18.5–23.9 kg/m2), overweight (BMI 24.0–27.9 kg/m2), and obesity (BMI ≥ 28.0 kg/m2).
(A) “1” indicates the occurrence of hypertension-diabetes comorbidity and “2” indicates the occurrence of death.
Table 2
Univariate and multivariate Cox regression of BMI and hypertension-diabetes comorbidity.
| VARIABLES | UNIVARIATE, HR (95%CI) | P | MULTIVARIATEa, HR (95%CI) | Pa | MULTIVARIATEb, HR (95%CI) | Pb |
|---|---|---|---|---|---|---|
| BMI group | ||||||
| Normal weight | 1.000(Reference) | 1.000(Reference) | ||||
| Underweight | 0.747(0.651,0.857) | <0.001 | 0.837(0.728,0.962) | 0.013 | ||
| Overweight | 1.517(1.309,1.758) | <0.001 | 1.397(1.204,1.621) | <0.001 | ||
| Obesity | 1.620(1.237,2.121) | <0.001 | 1.438(1.096,1.886) | 0.009 | ||
| BMI | 1.062(1.048,1.076) | <0.001 | 1.043(1.029,1.059) | <0.001 | ||
| Age, years | 0.980(0.975,0.986) | <0.001 | 0.985(0.979,0.992) | <0.001 | 0.985(0.979,0.991) | <0.001 |
| Sex | ||||||
| Female | 1.000(Reference) | |||||
| Male | 0.950(0.851,1.059) | 0.353 | ||||
| Ethnic | ||||||
| Han | 1.000(Reference) | 1.000(Reference) | 1.000(Reference) | |||
| Non-han | 0.301(0.212,0.428) | <0.001 | 0.334(0.235,0.475) | <0.001 | 0.333(0.234,0.474) | <0.001 |
| Current smoking status | ||||||
| No | 1.000(Reference) | |||||
| Yes | 1.072(0.939,1.224) | 0.304 | ||||
| Current drinking status | ||||||
| No | 1.000(Reference) | |||||
| Yes | 1.100(0.964,1.255) | 0.158 | ||||
| Current exercise status | ||||||
| No | 1.000(Reference) | 1.000(Reference) | 1.000(Reference) | |||
| Yes | 1.227(1.094,1.375) | <0.001 | 1.094(0.975,1.228) | 0.126 | 1.091(0.972,1.225) | 0.141 |
| Current marital status | ||||||
| Never married | 1.000(Reference) | 1.000(Reference) | 1.000(Reference) | |||
| Widowed | 2.067(0.857,4.985) | 0.106 | 2.828(1.169,6.839) | 0.021 | 2.789(1.153,6.750) | 0.023 |
| Currently married and living with spouse | 2.855(1.184,6.883) | 0.019 | 2.367(0.906,6.187) | 0.079 | 2.326(0.890,6.081) | 0.085 |
| Divorced | 2.452(0.658,9.133) | 0.181 | 2.026(0.543,7.555) | 0.293 | 2.049(0.550,7.636) | 0.285 |
| Separated | 1.930(0.741,5.027) | 0.178 | 2.561(1.057,6.209) | 0.037 | 2.534(1.045,6.146) | 0.040 |
| Total income of year, CNY | 1.001(1.001,1.001) | 0.027 | 1.001(1.001,1.001) | 0.030 | 1.001(1.001,1.001) | 0.037 |
| Sleep duration, hours | 1.011(1.002,1.020) | 0.016 | 1.014(1.005,1.022) | 0.002 | 1.014(1.005,1.022) | 0.002 |
| Sleep quality | ||||||
| Very good | 1.000(Reference) | |||||
| Good | 0.917(0.781,1.077) | 0.291 | ||||
| Bad | 0.952(0.759,1.196) | 0.675 | ||||
| So so | 0.938(0.783,1.124) | 0.488 | ||||
| Very bad | 1.277(0.728,2.240) | 0.393 | ||||
| Not able to answer | 0.546(0.077,3.898) | 0.546 | ||||
[i] HR: Hazard ratio, CI: Confidence interval, BMI: Body mass index, CNY: Chinese Yuan.
BMI category: underweight (BMI < 18.5 kg/m2), normal weight (BMI 18.5–23.9 kg/m2), overweight (BMI 24.0–27.9 kg/m2), and obesity (BMI ≥ 28.0 kg/m2).
a: When conducting multivariate Cox regression analysis, BMI is included in the model as a categorical variable.
b: When conducting multivariate Cox regression analysis, BMI is included in the model as a continuous variable.
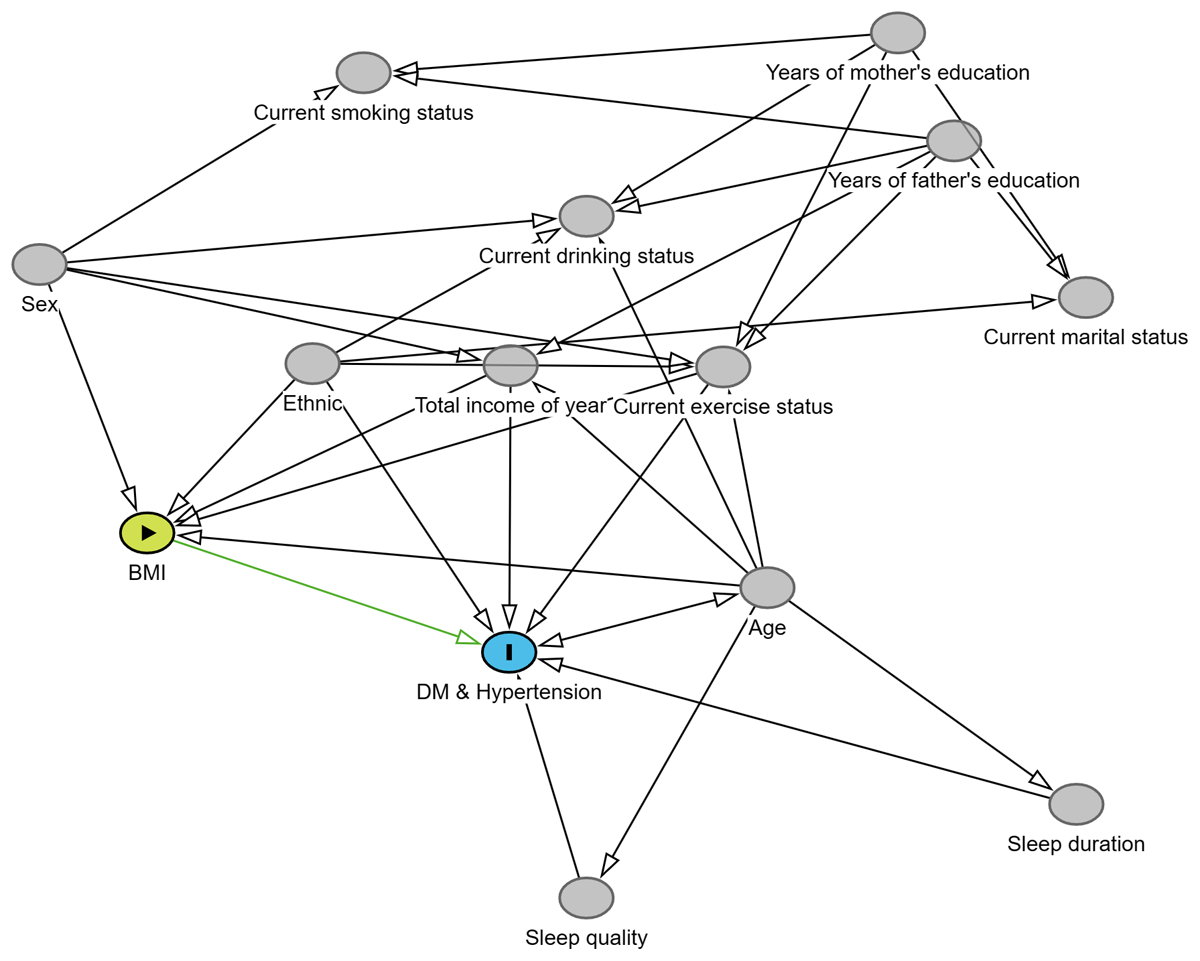
Figure 3
Directed Acyclic Graph (DAG) with Body Mass Index (BMI) as the exposure and hypertension-diabetes comorbidity as the outcome.
Table 3
Multi-model adjustment based on Directed Acyclic Graph (DAG).
| DISEASES | GROUP | MODEL 1 HR (95%CI) | P | MODEL 2 HR (95%CI) | P |
|---|---|---|---|---|---|
| Hypertension & DM | BMI<24.0 | 1.000(Reference) | 1.000(Reference) | ||
| BMI≥24.0 | 1.682(1.476~1.917) | <0.001 | 1.486(1.301~1.698) | <0.001 | |
| BMI* | 1.062(1.048~1.076) | <0.001 | 1.046(1.031~1.061) | <0.001 | |
| Hypertension | BMI<24.0 | 1.000(Reference) | 1.000(Reference) | ||
| BMI≥24.0 | 1.499(1.351~1.662) | <0.001 | 1.398(1.258~1.552) | <0.001 | |
| BMI* | 1.052(1.041~1.062) | <0.001 | 1.042(1.031~1.053) | <0.001 | |
| DM | BMI<24.0 | 1.000(Reference) | 1.000(Reference) | ||
| BMI≥24.0 | 1.639(1.440~1.865) | <0.001 | 1.451(1.271~1.656) | <0.001 | |
| BMI* | 1.060(1.046~1.074) | <0.001 | 1.044(1.029~1.059) | <0.001 |
[i] HR: Hazard Ratio, CI: Confidence Interval, BMI: Body mass index, DM: diabetes mellitus.
Model1: Crude.
Model2: Adjust: age, ethnic, current exercise status, total income of year.
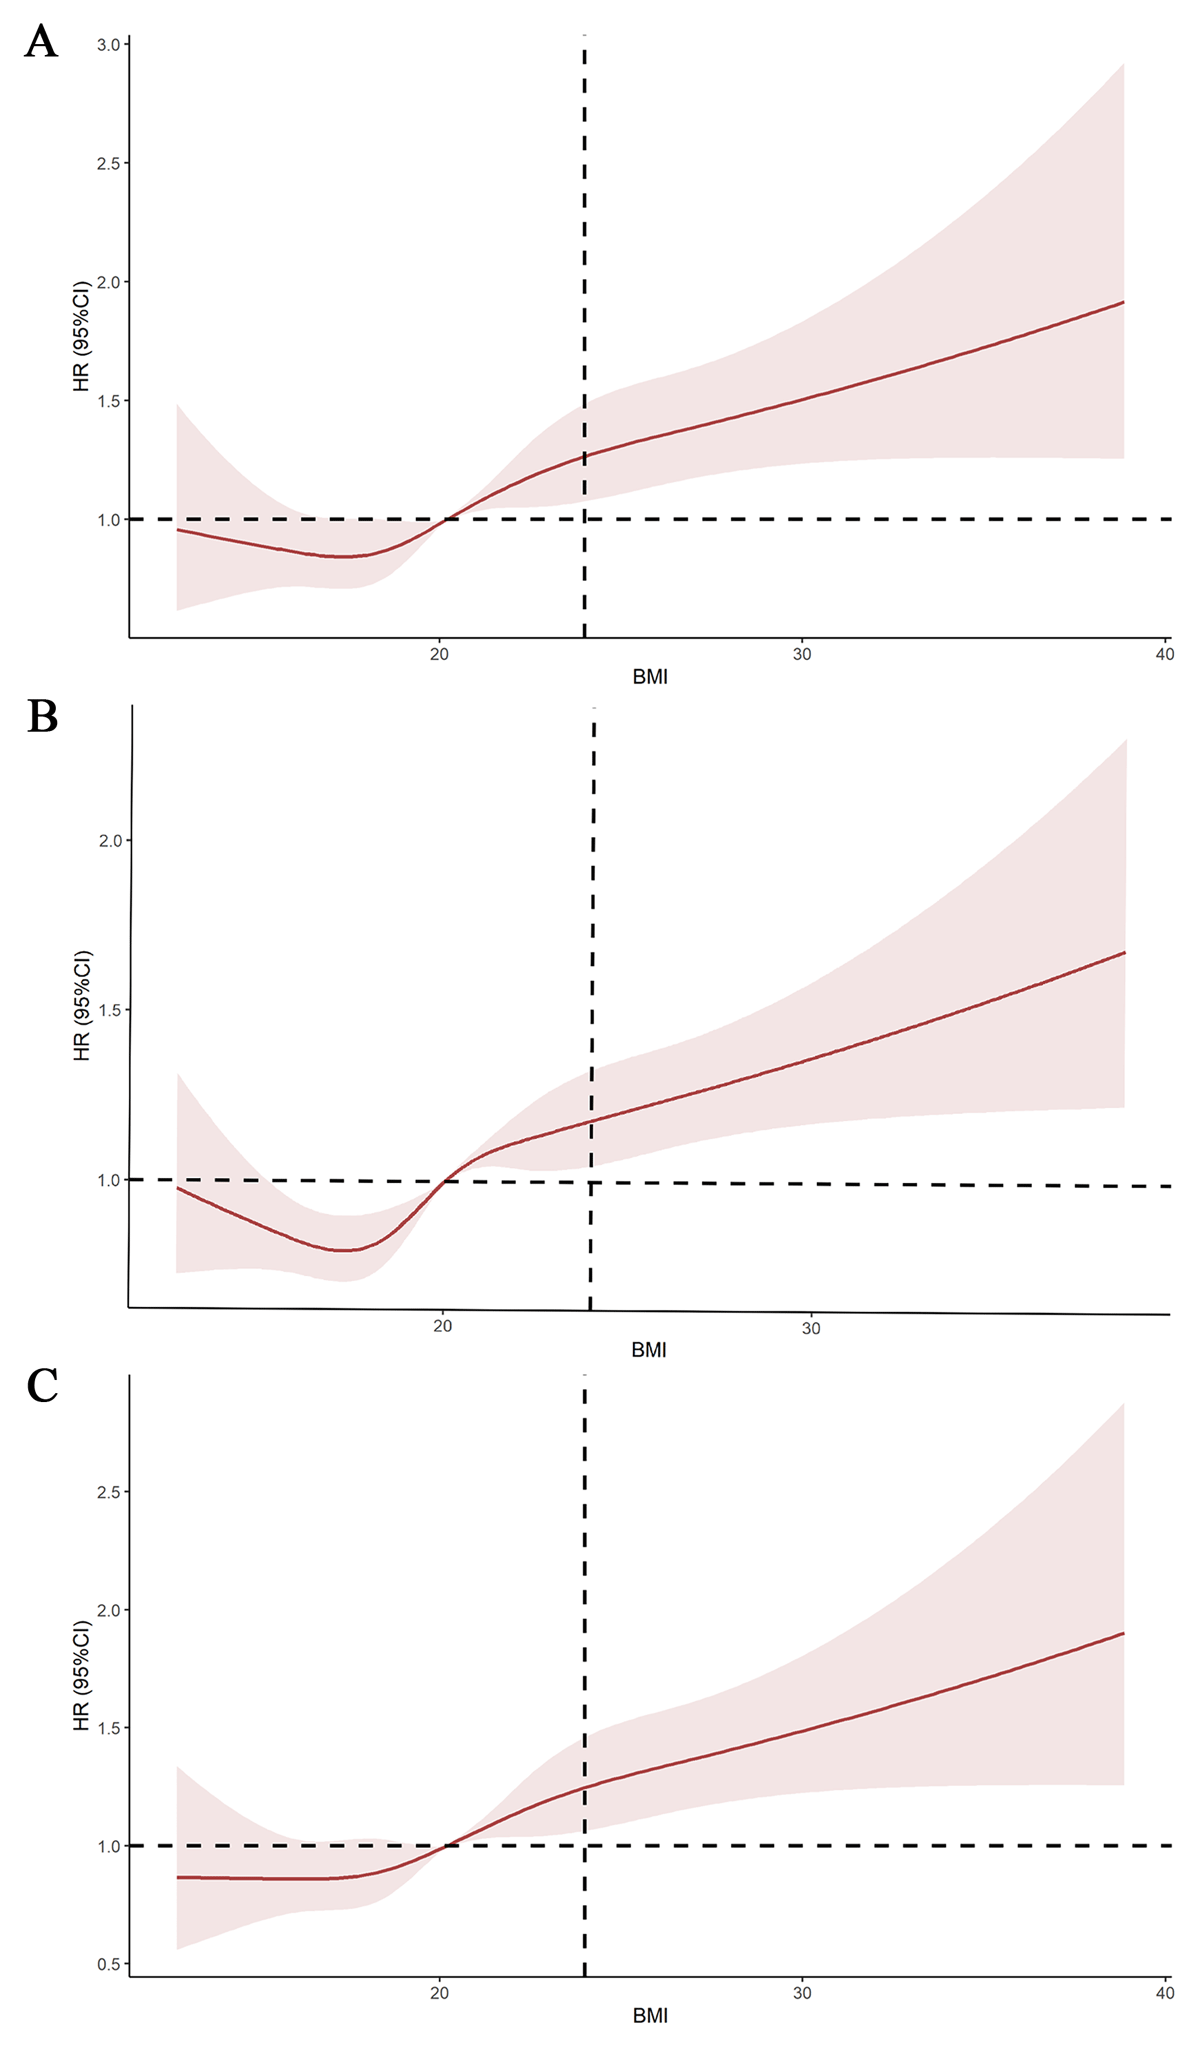
Figure 4
Restricted cubic spline (RCS) fitting the relationship between body mass index (BMI) as a continuous variable and related outcomes. A represents hypertension, B represents diabetes mellitus, and C represents hypertension-diabetes comorbidity.
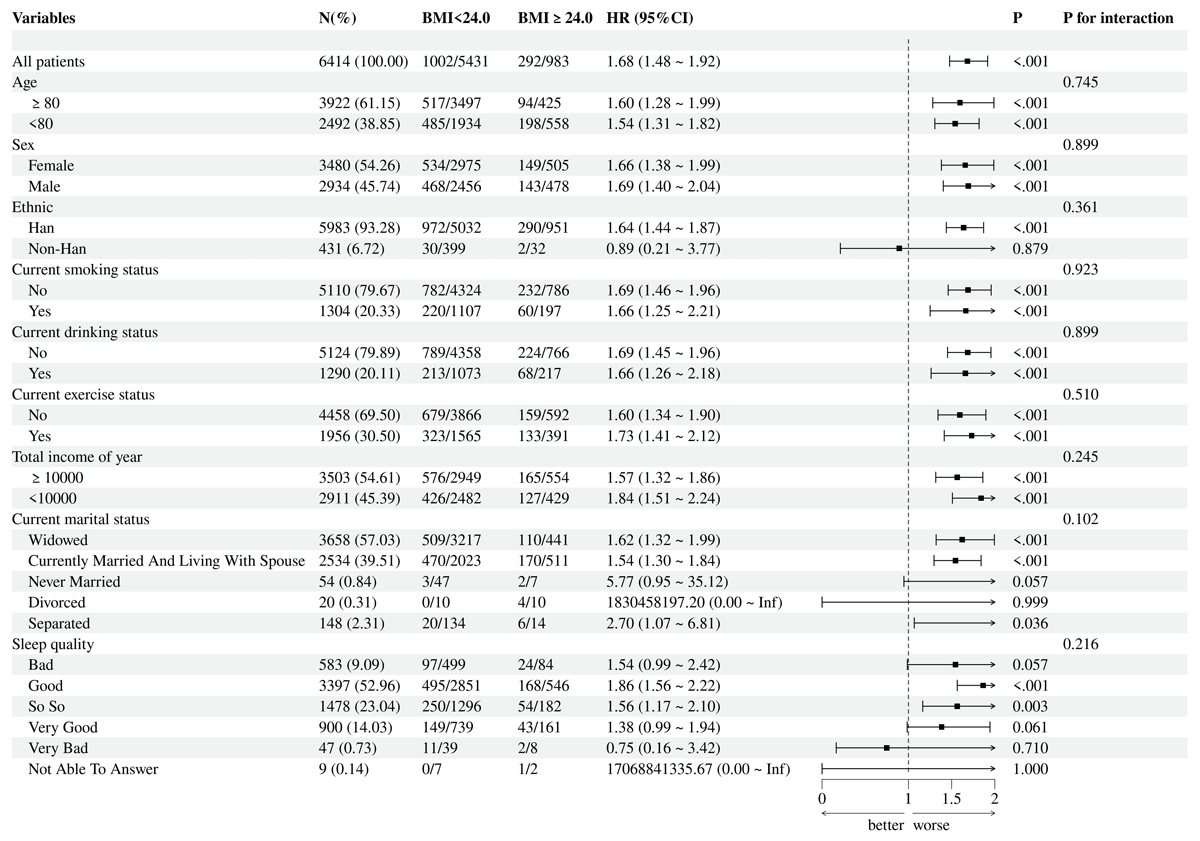
Figure 5
Subgroup analysis for hypertension-diabetes comorbidity with body mass index (BMI) as the exposure.