
Introduction
Hypertension and diabetes mellitus (DM) are two of the most prevalent chronic diseases worldwide, with their incidence showing a steady upward trend in recent years (12345). Body Mass Index (BMI) has emerged as a significant risk factor for both hypertension and DM (67891011). Hypertension and DM frequently coexist, with shared mechanisms like insulin resistance, inflammatory responses, and oxidative stress (121314151617). Patients with hypertension-diabetes comorbidity often face a heightened cardiovascular risk, necessitating more stringent management and treatment. While prior studies have examined BMI’s association with either hypertension or DM, few have specifically examined its association with hypertension-diabetes comorbidity in elderly populations and those available are limited to retrospective or cross-sectional designs (1819). Most existing research on BMI and cardiometabolic diseases has focused on middle-aged adults. However, aging alters body composition, metabolic regulation, and disease susceptibility, making it unclear whether BMI thresholds for risk prediction in younger cohorts apply to the elderly.
This study utilizes large-scale prospective data from elderly population of China to examine BMI as both a categorical and continuous variable, comprehensively exploring its associations with hypertension-diabetes comorbidity, hypertension, and DM from multiple perspectives, employing comprehensive covariate adjustment strategies to ensure robust effect estimation. By elucidating these relationships, we aim to provide a scientific foundation for healthcare policymakers in weight management of elderly population.
Methods
Study populations
The study employed data from the Chinese Longitudinal Healthy Longevity Survey (CLHLS) database, which is the largest sample of elderly individuals in China, conducted across 23 provinces, municipalities, and autonomous regions. Participants completed face-to-face questionnaires, underwent anthropometric assessments, and provided biological samples for laboratory testing. This study was approved by the Peking University Medical Ethics Committee (IRB 00001052–13074). All participants or their legal guardians provided written informed consent at the beginning of the survey.
Consistent with the observational nature of large-scale real-world studies, we implemented pragmatic screening criteria by exclusively excluding participants with missing anthropometric data (height/weight) or those meeting any of the following clinical criteria at baseline assessment: (1) self-reported physician-diagnosed hypertension or DM; (2) measured blood pressure ≥140/90 mmHg; (3) current use of antihypertensive or glucose-lowering medications. Participants who were lost to follow-up were excluded in subsequent analyses. Through screening, we ultimately selected a total of 5,342 samples for hypertension, 6,335 for DM, and 6,414 for hypertension-diabetes comorbidity from an initial sample of 16,954 participants.
Outcomes and exposure
The exposure of interest was BMI. Participants were categorized into four groups according to Chinese guidelines: underweight (BMI < 18.5 kg/m2); normal weight (BMI 18.5–23.9 kg/m2); overweight (BMI 24.0–27.9 kg/m2); and obesity (BMI ≥ 28.0 kg/m2) (20). The primary outcome was hypertension-diabetes comorbidity and the secondary outcomes was either hypertension or DM. Hypertension was identified by self-reported physician diagnosis, current use of antihypertensive medications, or average of two blood pressure measurements ≥140/90 mmHg. DM was determined by self-reported physician diagnosis or current use of hypoglycemic medications. Survival time was defined as the period from baseline enrollment to the occurrence of the specified outcomes.
Follow-up
Our study utilized data from 2008–2009 as the baseline, with follow-up surveys conducted in 2011–2012, 2014, and 2017–2018, targeting participants aged 65 years and older. The follow-up protocol employed two distinct questionnaires: (1) a survivor questionnaire administered to living participants, covering demographic and socioeconomic characteristics, family structure, economic status, self-rated health and quality of life, cognitive function, psychological traits, activities of daily living (ADL), lifestyle factors, caregiving support, and healthcare utilization/costs; and (2) a deceased participant questionnaire completed by immediate family members, which collected detailed retrospective data on the decedent’s pre-mortem health status, quality of life, and medical/caregiving expenditure. This dual-questionnaire design ensured comprehensive longitudinal data capture while accounting for mortality-associated information loss. Detailed follow-up plans can be accessed on the online webpage:
https://opendata.pku.edu.cn/dataset.xhtml?persistentId=doi%3A10.18170%2FDVN%2FWBO7LK
Statistics analyses
To ensure data quality, we excluded participants with missing values in key variables including BMI, hypertension status, and diabetes status. For candidate covariates (selected based on prior literature), we removed variables with missingness exceeding 20%, while those with ≤20% missing values were considered Missing at Random and were handled using multiple imputation with the predictive mean matching method.
Continuous variables were reported as the mean ± standard deviation (SD) for normally distributed data and median [interquartile range (IQR)] for non-normally distributed data. Statistical differences between groups were assessed using the independent samples t-test for normally distributed variables and the Mann-Whitney U test for non-normally distributed variables. Categorical variables were presented as frequencies (percentages) and compared between groups using either the χ2 test or Fisher’s exact test, as appropriate. A two-sided p-value of less than 0.05 was considered statistically significant across all analyses.
Based on BMI categories, we initially employed univariate Cox regression analysis to explore the relationship between candidate variables and all outcomes. We tested the proportional hazards assumption for exposure variable (continuous variable: BMI, categorical variable: BMI groups) using Schoenfeld residuals. Variables with P < 0.05 in the univariate analysis were subsequently included in the multivariate regression model. Additionally, we repeated these analyses with BMI treated as a continuous variable to provide a quantitative assessment and examine the robustness of our findings.
Kaplan-Meier curves were plotted for hypertension, DM, and hypertension-diabetes comorbidity in BMI groups. To address mortality as a competing risk and minimize potential overestimation of outcomes, we implemented a competing risks regression model for analysis (21). The incidence rates of hypertension, DM, and hypertension-diabetes comorbidity at the end of follow-up were also calculated.
To mitigate potential overadjustment bias inherent in data-driven variable selection, we established a Directed Acyclic Graph (DAG) framework incorporating all candidate variables (22). This methodology enabled identification of an optimal adjustment set while preventing overcorrection. Based on this adjustment set, we adopted a multi-model analyses strategy: Model 1 was unadjusted, while Model 2 incorporated age, ethnicity, current exercise status, and total income of year for adjustment.
We employed restricted cubic splines (RCS) to model the association between BMI and hazard ratios (HR). This nonparametric approach effectively captures potential nonlinear relationships while minimizing information loss inherent in categorical classifications. By constraining curve fluctuations through predefined knots (n = 5), RCS ensures robust and interpretable results, thereby providing precise characterization of risk trends across the full BMI spectrum (23). Moreover, subgroup analyses were performed to investigate potential interactions of variables of interest and BMI.
Results
Baseline characteristics of CLHLS cohort
From an initial sample of 16,954 participants in the CLHLS database, we screened three datasets for analyzing hypertension, DM, and hypertension-diabetes comorbidity, comprising 5,342, 6,335, and 6,414 participants, respectively (Figure 1). In the dataset analyzing hypertension-diabetes comorbidity, the median age was 88.00 years (IQR, 79.50–94.00) for the underweight group, 82.00 years (IQR, 73.00–90.00) for the normal weight group, 78.00 years (IQR, 70.00–87.00) for the overweight group, and 75.00 years (IQR, 68.00–86.00) for the obesity group (P < 0.001). The numbers of male patients were 1,189 (63.5%), 1,786 (50.2%), 395 (49.6%), and 110 (59.1%), respectively (P < 0.001). The numbers of Han ethnicity participants were 1,689 (90.3%), 3,343 (93.9%), 769 (96.5%), and 182 (97.8%), respectively (P < 0.001). At the end of follow-up, the numbers of participants developing hypertension-diabetes comorbidity in the four groups were 283 (15.1%), 719 (20.0%), 235 (29.5%), and 57 (30.6%), respectively (P < 0.001); detailed information is provided in Table 1. Tables S1 and S2 present comprehensive baseline characteristics for the hypertension and DM datasets, respectively.
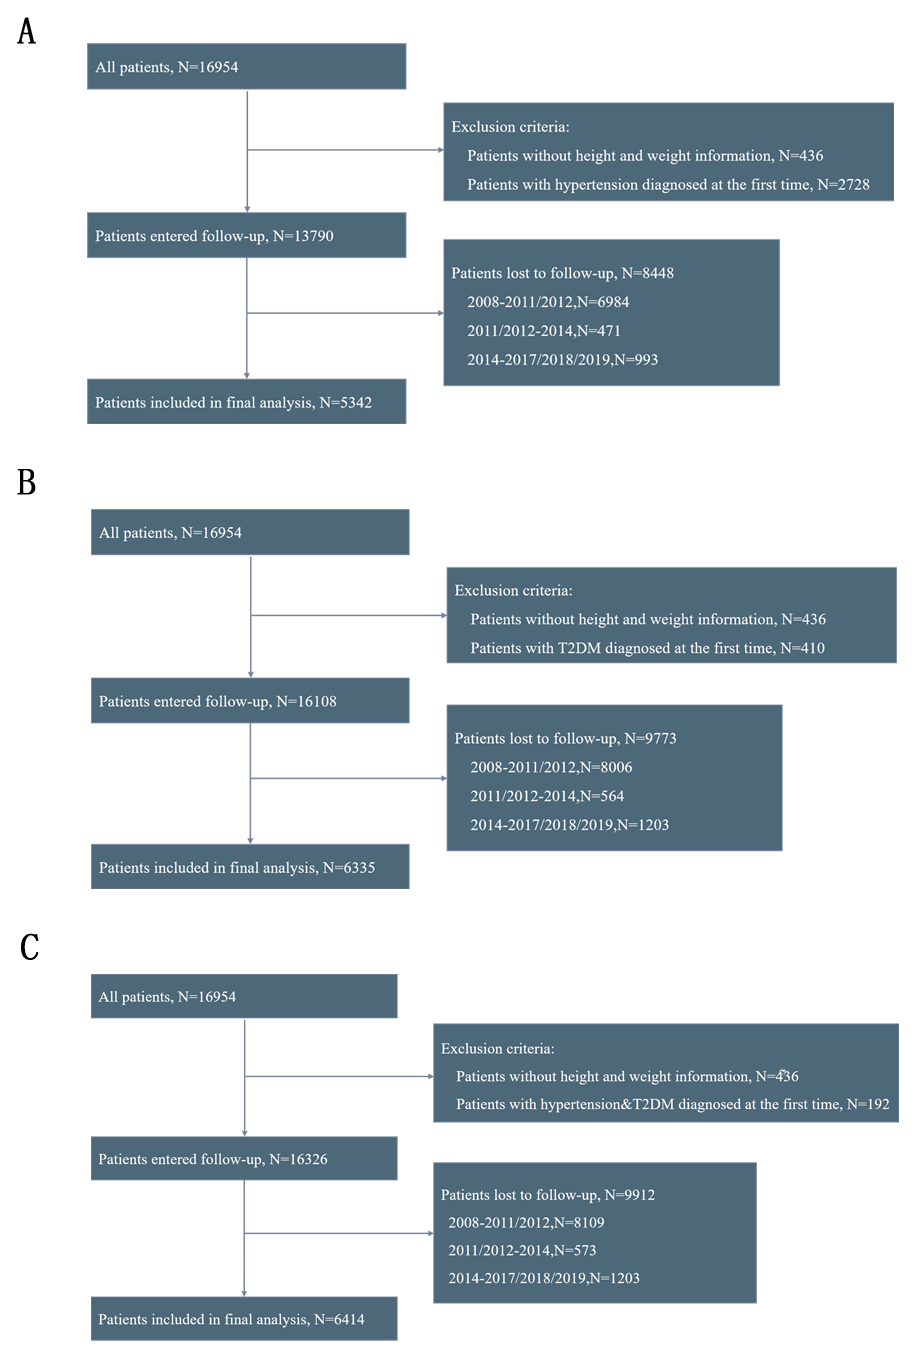
Figure 1
Flowchart of participants screening. (A) hypertension; (B) diabetes; (C) hypertension-diabetes comorbidity.
Note: The participants were first enrolled in 2008, with the first follow-up conducted in 2011 and 2012, the second follow-up in 2014, and the third follow-up in 2017, 2018, and 2019.
Table 1
Baseline characteristics of participants for the outcome of hypertension-diabetes comorbidity.
| VARIABLES | UNDER WEIGHT (n = 1871) | NORMAL WEIGHT (n = 3522) | OVERWEIGHT (n = 774) | OBESITY (n = 180) | P |
|---|---|---|---|---|---|
| BMI | 17.26[16.02,17.83] | 20.81[19.63,22.22] | 25.26[24.46,26.26] | 29.81[28.82,31.59] | <0.001 |
| Age, years | 88.00[79.50,94.00] | 82.00[73.00,90.00] | 78.00[70.00,87.00] | 75.00[68.00,86.00] | <0.001 |
| Male | 1189(63.5) | 1786(50.2) | 395(49.6) | 110(59.1) | <0.001 |
| Ethnic | <0.001 | ||||
| Han | 1689(90.3) | 3343(93.9) | 769(96.5) | 182(97.8) | |
| Hui | 6(0.3) | 11(0.3) | 5(0.6) | 2(1.1) | |
| Zhuang | 142(7.6) | 109(3.1) | 13(1.6) | 1(0.5) | |
| Yao | 11(0.6) | 18(0.5) | 1(0.1) | 0(0.0) | |
| Korea | 10(0.5) | 16(0.4) | 2(0.3) | 0(0.0) | |
| Mongolia | 0(0.0) | 1(0.0) | 0(0.0) | 0(0.0) | |
| Others | 13(0.7) | 62(1.7) | 7(0.9) | 1(0.5) | |
| Current smoking status | <0.001 | ||||
| Yes | 320(17.1) | 787(22.1) | 170(21.3) | 27(14.5) | |
| No | 1551(82.9) | 2773(77.9) | 627(78.7) | 159(85.5) | |
| Current drinking status | <0.001 | ||||
| Yes | 283(15.1) | 790(22.2) | 181(22.7) | 36(19.4) | |
| No | 1588(84.9) | 2770(77.8) | 616(77.3) | 150(80.6) | |
| Current exercise status | <0.001 | ||||
| Yes | 468(25.0) | 1097(30.8) | 317(39.8) | 74(39.8) | |
| No | 1403(75.0) | 2463(69.2) | 480(60.2) | 112(60.2) | |
| Total income of year, CNY | 10000.00[3500.00,23000.00] | 10000.00[4000.00,24250.00] | 10000.00[5000.00,25000.00] | 10000.00[4000.00,25000.00] | 0.102 |
| Current marital status | <0.001 | ||||
| Currently married and living with spouse | 527(28.2) | 1496(42.0) | 413(51.8) | 98(52.7) | |
| Separated | 44(2.4) | 90(2.5) | 12(1.5) | 2(1.1) | |
| Divorced | 6(0.3) | 4(0.1) | 7(0.9) | 3(1.6) | |
| Widowed | 1278(68.3) | 1939(54.5) | 359(45.0) | 82(44.1) | |
| Never married | 16(0.9) | 31(0.9) | 6(0.8) | 1(0.5) | |
| Sleep quality | <0.001 | ||||
| Very good | 209(11.2) | 530(14.9) | 125(15.7) | 36(19.4) | |
| Good | 925(49.4) | 1926(54.1) | 442(55.5) | 104(55.9) | |
| So so | 504(26.9) | 792(22.2) | 152(19.1) | 30(16.1) | |
| Bad | 215(11.5) | 284(8.0) | 69(8.7) | 15(8.1) | |
| Very bad | 17(0.9) | 22(0.6) | 7(0.9) | 1(0.5) | |
| Not able to answer | 1(0.1) | 6(0.2) | 2(0.3) | 0(0.0) | |
| Sleep duration, hours | 8.00[6.00,9.00] | 8.00[6.00,10.00] | 8.00[7.00,10.00] | 8.00[7.00,10.00] | 0.084 |
| Hypertension and DM | 283(15.1) | 719(20.2) | 235(29.5) | 57(30.6) | <0.001 |
[i] BMI: Body mass index, CNY: Chinese Yuan.
BMI category: underweight (BMI < 18.5 kg/m2), normal weight (BMI 18.5–23.9 kg/m2), overweight (BMI 24.0–27.9 kg/m2), and obesity (BMI ≥ 28.0 kg/m2).
Additionally, during median follow-up periods of 71 months (IQR: 41–117), 75 months (IQR: 71–121), and 74 months (IQR: 71–120), the incidence rates of hypertension, DM, and hypertension-diabetes comorbidity were found to be 6.09/1000 person-months, 2.36/1000 person-months, and 2.22/1000 person-months, respectively.
Survival analysis and competing risks model
We tested the proportional hazards assumption for the exposure variable using Schoenfeld residuals. The results indicated that BMI, both as a continuous variable and a categorical variable, satisfied the proportional hazards assumption (Figures S1-S2 for hypertension-diabetes comorbidity, Figures S3-S4 for hypertension, and Figures S5-S6 for diabetes comorbidity).
Survival analysis revealed varying risks of the hypertension-diabetes comorbidity in different BMI groups. The obesity group exhibited the highest risk, and the underweight group had the lowest risk (log-rank P < 0.001; Figure 2A).
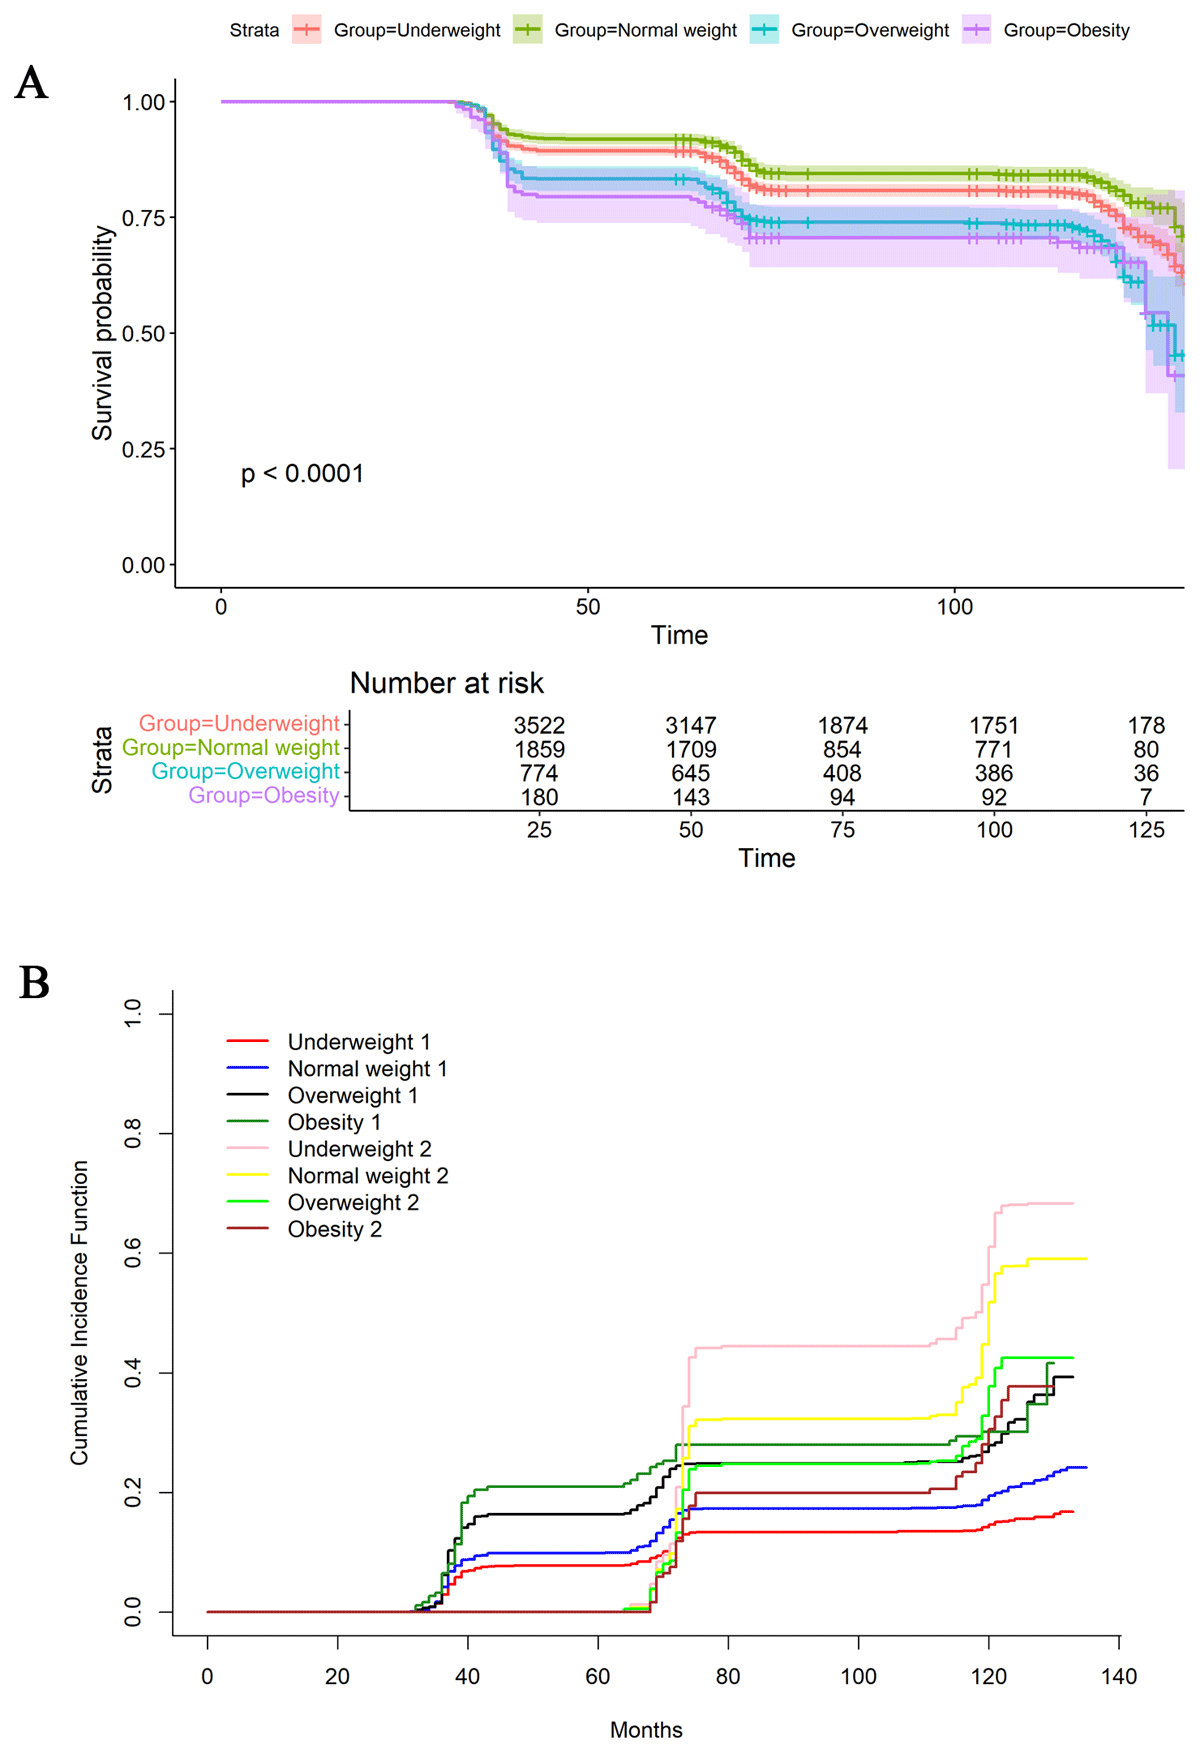
Figure 2
Survival analysis (A) and competing risks analysis regarding death (B) were performed for hypertension-diabetes comorbidity.
Participants were categorized into four groups based on BMI: underweight (BMI < 18.5 kg/m2), normal weight (BMI 18.5–23.9 kg/m2), overweight (BMI 24.0–27.9 kg/m2), and obesity (BMI ≥ 28.0 kg/m2).
(A) “1” indicates the occurrence of hypertension-diabetes comorbidity and “2” indicates the occurrence of death.
Given the advanced age and high mortality risk of the study participants, we further considered death as a competing risk (Figure 2B). Even after accounting for this, the higher BMI had higher risk for all outcomes (P < 0.001).
The survival analysis and competing risks analysis results for hypertension (Figure S7A and S7B) and DM (Figure S8A and S8B) were consistent with those for hypertension-diabetes comorbidity.
Cox regression analysis based on a data-driven strategy
In the analysis of hypertension-diabetes comorbidity, the univariate analysis identified several significant variables: BMI (categorical), age, ethnicity, current exercise status, current marital status, total income of year, and sleep duration. After multivariate adjustment, the significant variables that remained were age, BMI, ethnicity, current marital status, total income of year, and sleep duration. The corresponding HRs were as follows: age, 0.985 (95% CI, 0.979–0.992); BMI categories, with underweight at 0.837 (95% CI, 0.728–0.692), overweight at 1.397 (95% CI, 1.204–1.621), and obesity at 1.438 (95% CI, 1.096–1.886) versus normal weight; ethnicity, with non-Han at 0.334 (95% CI, 0.235–0.475) versus Han; current marital status, with widowed at 2.828 (95% CI, 1.169–6.839) and separated at 2.367 (95% CI, 0.906–6.187) versus never married; total income or year at 1.001 (95% CI, 1.001–1.001); and sleep duration at 1.014 (95% CI, 1.005–1.022). When BMI was reanalyzed as a continuous variable, the significance analysis aligned with the aforementioned results, indicating the robustness of the findings (Table 2).
Table 2
Univariate and multivariate Cox regression of BMI and hypertension-diabetes comorbidity.
| VARIABLES | UNIVARIATE, HR (95%CI) | P | MULTIVARIATEa, HR (95%CI) | Pa | MULTIVARIATEb, HR (95%CI) | Pb |
|---|---|---|---|---|---|---|
| BMI group | ||||||
| Normal weight | 1.000(Reference) | 1.000(Reference) | ||||
| Underweight | 0.747(0.651,0.857) | <0.001 | 0.837(0.728,0.962) | 0.013 | ||
| Overweight | 1.517(1.309,1.758) | <0.001 | 1.397(1.204,1.621) | <0.001 | ||
| Obesity | 1.620(1.237,2.121) | <0.001 | 1.438(1.096,1.886) | 0.009 | ||
| BMI | 1.062(1.048,1.076) | <0.001 | 1.043(1.029,1.059) | <0.001 | ||
| Age, years | 0.980(0.975,0.986) | <0.001 | 0.985(0.979,0.992) | <0.001 | 0.985(0.979,0.991) | <0.001 |
| Sex | ||||||
| Female | 1.000(Reference) | |||||
| Male | 0.950(0.851,1.059) | 0.353 | ||||
| Ethnic | ||||||
| Han | 1.000(Reference) | 1.000(Reference) | 1.000(Reference) | |||
| Non-han | 0.301(0.212,0.428) | <0.001 | 0.334(0.235,0.475) | <0.001 | 0.333(0.234,0.474) | <0.001 |
| Current smoking status | ||||||
| No | 1.000(Reference) | |||||
| Yes | 1.072(0.939,1.224) | 0.304 | ||||
| Current drinking status | ||||||
| No | 1.000(Reference) | |||||
| Yes | 1.100(0.964,1.255) | 0.158 | ||||
| Current exercise status | ||||||
| No | 1.000(Reference) | 1.000(Reference) | 1.000(Reference) | |||
| Yes | 1.227(1.094,1.375) | <0.001 | 1.094(0.975,1.228) | 0.126 | 1.091(0.972,1.225) | 0.141 |
| Current marital status | ||||||
| Never married | 1.000(Reference) | 1.000(Reference) | 1.000(Reference) | |||
| Widowed | 2.067(0.857,4.985) | 0.106 | 2.828(1.169,6.839) | 0.021 | 2.789(1.153,6.750) | 0.023 |
| Currently married and living with spouse | 2.855(1.184,6.883) | 0.019 | 2.367(0.906,6.187) | 0.079 | 2.326(0.890,6.081) | 0.085 |
| Divorced | 2.452(0.658,9.133) | 0.181 | 2.026(0.543,7.555) | 0.293 | 2.049(0.550,7.636) | 0.285 |
| Separated | 1.930(0.741,5.027) | 0.178 | 2.561(1.057,6.209) | 0.037 | 2.534(1.045,6.146) | 0.040 |
| Total income of year, CNY | 1.001(1.001,1.001) | 0.027 | 1.001(1.001,1.001) | 0.030 | 1.001(1.001,1.001) | 0.037 |
| Sleep duration, hours | 1.011(1.002,1.020) | 0.016 | 1.014(1.005,1.022) | 0.002 | 1.014(1.005,1.022) | 0.002 |
| Sleep quality | ||||||
| Very good | 1.000(Reference) | |||||
| Good | 0.917(0.781,1.077) | 0.291 | ||||
| Bad | 0.952(0.759,1.196) | 0.675 | ||||
| So so | 0.938(0.783,1.124) | 0.488 | ||||
| Very bad | 1.277(0.728,2.240) | 0.393 | ||||
| Not able to answer | 0.546(0.077,3.898) | 0.546 | ||||
[i] HR: Hazard ratio, CI: Confidence interval, BMI: Body mass index, CNY: Chinese Yuan.
BMI category: underweight (BMI < 18.5 kg/m2), normal weight (BMI 18.5–23.9 kg/m2), overweight (BMI 24.0–27.9 kg/m2), and obesity (BMI ≥ 28.0 kg/m2).
a: When conducting multivariate Cox regression analysis, BMI is included in the model as a categorical variable.
b: When conducting multivariate Cox regression analysis, BMI is included in the model as a continuous variable.
Furthermore, in the dataset with hypertension as the outcome, the significant variables that remained after adjustment were BMI (categorical), age, and ethnicity. Within the BMI categories, higher BMI groups exhibited a greater risk of developing hypertension. Compared to the Han ethnicity, non-Han individuals had a significantly lower risk of hypertension. When BMI was included in the model as a continuous variable, the significance analysis results were consistent with those obtained when it was treated as a categorical variable (Table S3). In the dataset with DM as the outcome, the significance analysis results were consistent with those for hypertension-diabetes comorbidity (Table S4).
A multi-model adjustment strategy based on DAG
Considering that data-driven strategies may lead to over-adjustment, we employed DAG analysis (Figure 3) to identify the minimal adjustment set: age, ethnicity, current exercise status, and total income of year. When the outcome was hypertension-diabetes comorbidity and BMI was treated as a categorical variable (BMI ≥ 24.0 versus BMI < 24.0), the HR of Model 1 (unadjusted) was 1.682 (95% CI, 1.476–1.917). After using the minimal adjustment set, the HR was 1.486 (95% CI, 1.301–1.698). When BMI was treated as a continuous variable, the significance analysis aligned with the aforementioned results (Table 3). When the outcomes were hypertension or DM, separate DAG (Figure S9 and Figure S10) were constructed for each condition to perform multi-model analyses. The results were consistent with those observed for hypertension-diabetes comorbidity (Table 3).
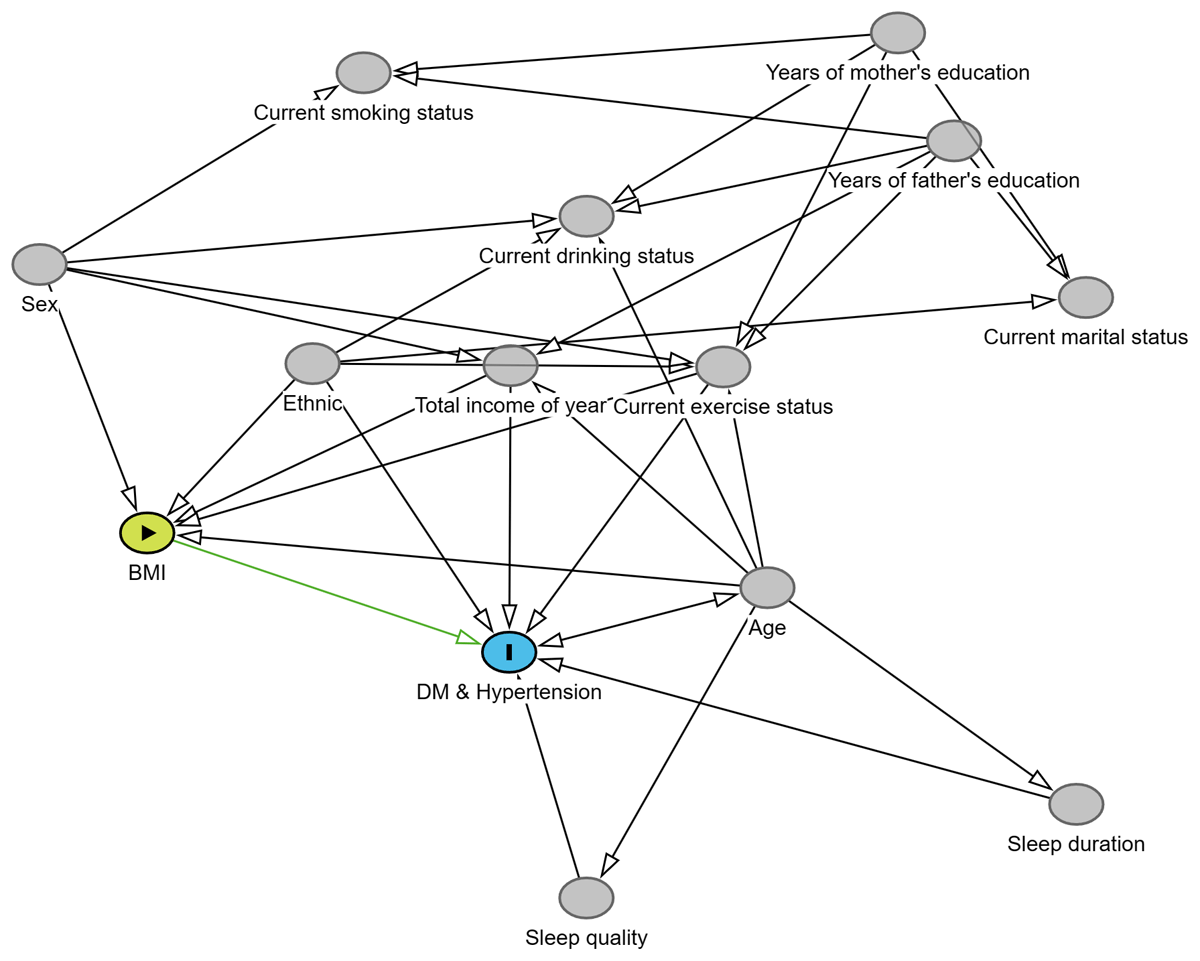
Figure 3
Directed Acyclic Graph (DAG) with Body Mass Index (BMI) as the exposure and hypertension-diabetes comorbidity as the outcome.
Table 3
Multi-model adjustment based on Directed Acyclic Graph (DAG).
| DISEASES | GROUP | MODEL 1 HR (95%CI) | P | MODEL 2 HR (95%CI) | P |
|---|---|---|---|---|---|
| Hypertension & DM | BMI<24.0 | 1.000(Reference) | 1.000(Reference) | ||
| BMI≥24.0 | 1.682(1.476~1.917) | <0.001 | 1.486(1.301~1.698) | <0.001 | |
| BMI* | 1.062(1.048~1.076) | <0.001 | 1.046(1.031~1.061) | <0.001 | |
| Hypertension | BMI<24.0 | 1.000(Reference) | 1.000(Reference) | ||
| BMI≥24.0 | 1.499(1.351~1.662) | <0.001 | 1.398(1.258~1.552) | <0.001 | |
| BMI* | 1.052(1.041~1.062) | <0.001 | 1.042(1.031~1.053) | <0.001 | |
| DM | BMI<24.0 | 1.000(Reference) | 1.000(Reference) | ||
| BMI≥24.0 | 1.639(1.440~1.865) | <0.001 | 1.451(1.271~1.656) | <0.001 | |
| BMI* | 1.060(1.046~1.074) | <0.001 | 1.044(1.029~1.059) | <0.001 |
[i] HR: Hazard Ratio, CI: Confidence Interval, BMI: Body mass index, DM: diabetes mellitus.
Model1: Crude.
Model2: Adjust: age, ethnic, current exercise status, total income of year.
RCS and subgroup analyses
RCS analysis indicated a linear positive correlation between BMI and the risk of all outcomes (Figure 4). This finding further indicates that there is a cumulative dose effect for BMI. Additionally, this study stratified the study population into multiple subgroups based on age, gender, ethnicity, current smoking status, current drinking status, current exercise status, total income of year, sleep quality, and current marital status. The subgroup analysis results for hypertension-diabetes comorbidity (Figure 5), hypertension (Figure S11), and DM (Figure S12) showed that the P-values for interaction were all greater than 0.05 across all variables, indicating no interactive effects among these variables. Overall, BMI ≥ 24.0 was identified as a reliable risk factor for all three outcomes.
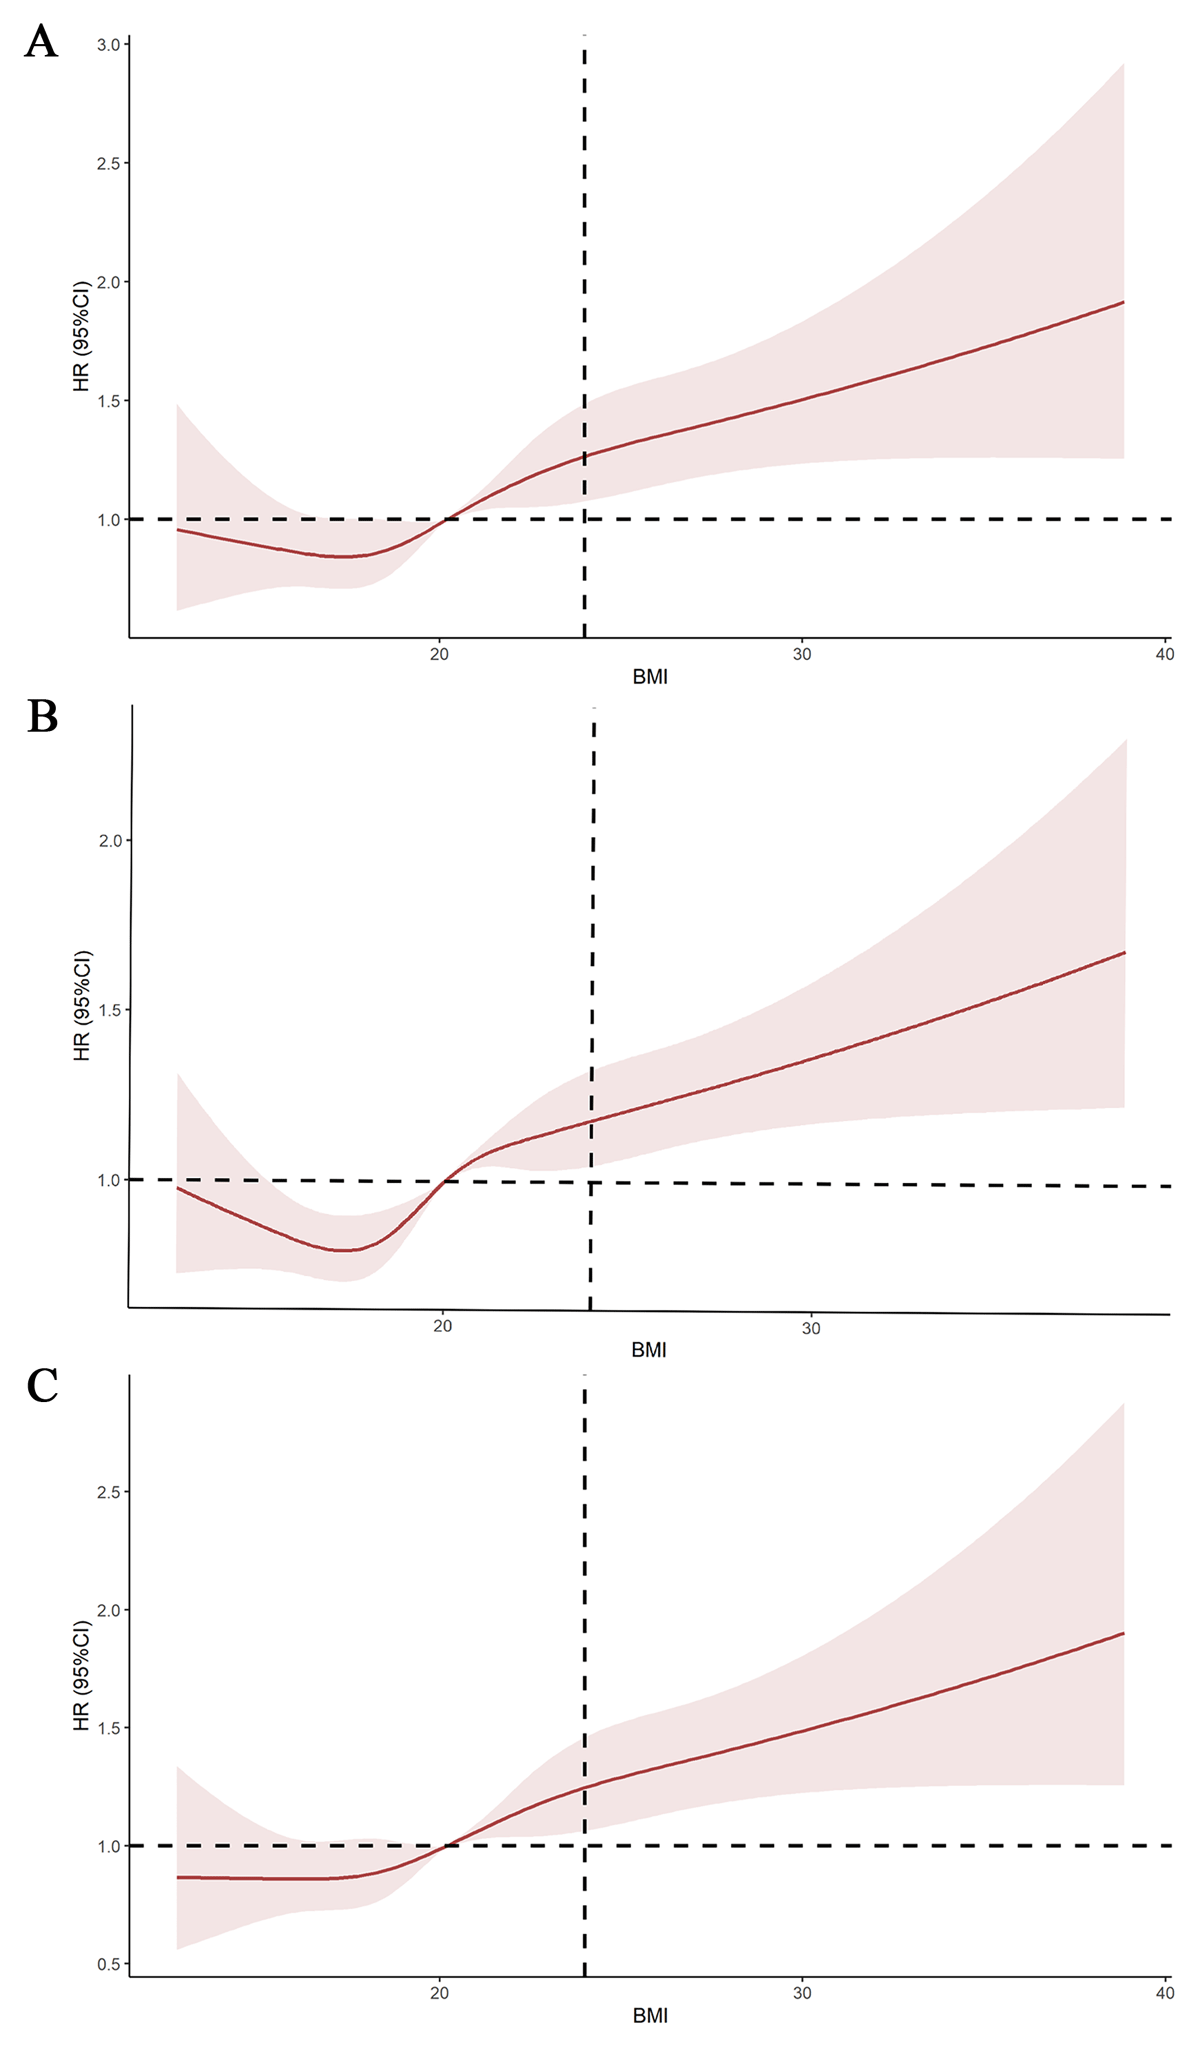
Figure 4
Restricted cubic spline (RCS) fitting the relationship between body mass index (BMI) as a continuous variable and related outcomes. A represents hypertension, B represents diabetes mellitus, and C represents hypertension-diabetes comorbidity.
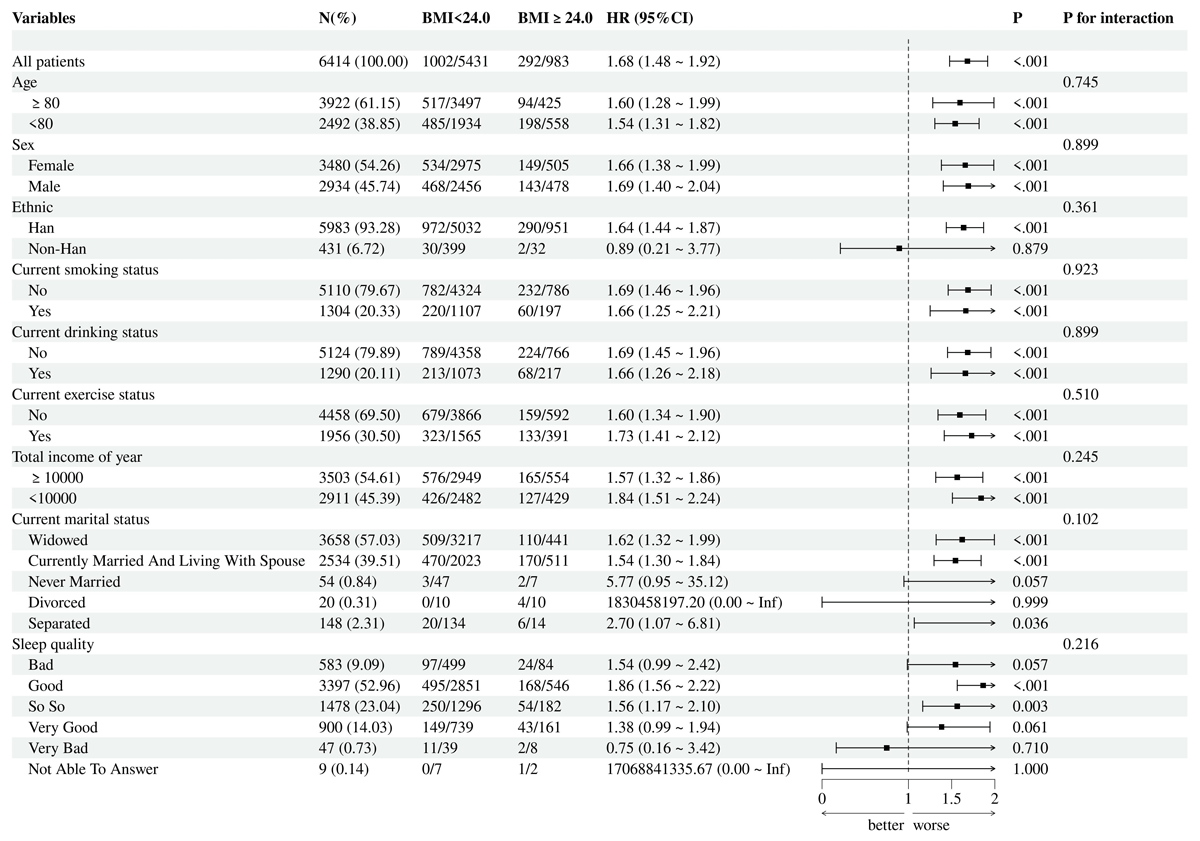
Figure 5
Subgroup analysis for hypertension-diabetes comorbidity with body mass index (BMI) as the exposure.
Discussion
To the best of our knowledge, this is the first prospective cohort study conducted in China that explores the association between BMI and hypertension, DM, as well as hypertension-diabetes comorbidity specifically within the elderly population. By examining BMI both as a categorical and continuous variable on outcomes, this study demonstrated that BMI increased the risk of hypertension-diabetes comorbidity, hypertension, and DM. Additionally, Han participants (versus non-Han) have a notably greater risk of developing hypertension-diabetes comorbidity, hypertension, and DM. Widowed or separated individuals have an elevated risk of developing hypertension-diabetes comorbidity and DM compared to unmarried individuals. This study suggests that greater attention should be given to obesity among elderly Han Chinese individuals, particularly those who are widowed, as they face a significantly higher risk of chronic diseases.
The relationship between BMI and hypertension-diabetes comorbidity
In this study, we found that higher BMI significantly increases the risk of hypertension-diabetes comorbidity, showing a higher HR compared to when hypertension or DM is considered as individual outcomes. No large-scale prospective cohort studies have previously investigated this issue, but some studies may provide support for our findings. Wu et al. (19) conducted a cross-sectional study among participants aged 18 and above in Hubei Province, China, showing that higher BMI increases the risk of hypertension-diabetes comorbidity. Li et al. (18) performed a retrospective cohort study among participants aged 60 and older in Henan Province, China, indicating that higher BMI increases the risk of hypertension-diabetes comorbidity. Additionally, a cross-sectional study in England explored the relationship between generalized and abdominal obesity and hypertension-diabetes comorbidity in individuals aged 35 and older, revealing that both indicators increase the risk of hypertension-diabetes comorbidity (24).
When DM and hypertension coexist, they can mutually influence each other, further exacerbating cardiac function (25). Diabetes can lead to impaired endothelial function and increase the risk of arteriosclerosis, thereby aggravating hypertension. Conversely, hypertension can worsen insulin resistance, further exacerbating DM (2627). DM and hypertension often exhibit familial aggregation and are associated with unhealthy lifestyles (2829). Since obesity is a significant risk factor for both DM and hypertension, controlling BMI to reduce the risk of hypertension-diabetes comorbidity is feasible.
The relationship between BMI and hypertension
This study demonstrates that a higher BMI is associated with an increased risk of hypertension. The risk factors for hypertension are multifaceted, with previous research primarily encompassing genetic, environmental, and lifestyle aspects (30). Overweight and obesity, particularly central obesity, constitute significant risk factors for the development of hypertension (31323334). Specifically, as BMI increases, blood pressure levels tend to rise accordingly. One study revealed that for every one standard deviation increase in BMI, the odds ratio for hypertension increases by 1.42 (95% CI, 1.37–1.48) (35). Currently, it is believed that mechanisms such as increased blood volume load, insulin resistance, changes in peripheral resistance vessels, and activation of the renin-angiotensin system may underlie the influence of BMI on hypertension (3637).
The relationship between BMI and DM
The risk factors for DM are multifaceted, including genetic factors, obesity, unhealthy lifestyles, and aging (38394041). Our study demonstrates that higher BMI increases the risk of DM. Similarly, Tang et al. (42) found that high BMI was associated with a high risk of developing DM in the Chinese aged population. Obesity stands as one of the crucial risk factors for the development of DM. Both the duration and degree of obesity are closely related to the onset of DM (4344). Central obesity, also known as abdominal obesity, poses the highest risk for developing DM (45). Obesity leads to reduced insulin sensitivity and weakened regulation of blood glucose, thereby increasing the risk of DM (4647).
Other Valuable Findings
Compared to unmarried participants, being widowed or separated after marriage results in an increased risk of both DM and hypertension-diabetes comorbidity. These findings are quite robust in our study. In the Australian Longitudinal Study on Women’s Health (ALSWH), it was found that women aged 40–45 years who were separated or widowed had an increased risk of developing DM (48). A study conducted in the United States indicated that being widowed increases the risk of hypertension (49). This study further confirms it and broadens the population under investigation.
Additionally, this study revealed that non-Han ethnic has significantly lower risk of developing hypertension, DM, and hypertension-diabetes comorbidity compared to the Han ethnic. This conclusion is similar to the findings of Wang et al. (50), but our study further expands the ethnic diversity. These observed disparities likely stem from multifaceted socioeconomic and lifestyle differences. Notably, epidemiological surveys indicate that Tibetan populations, as one representative non-Han group, tend to maintain more physically active lifestyles rooted in traditional pastoral practices, along with distinct dietary patterns characterized by habitual consumption of butter tea (a mixture of tea leaves, yak butter, and salt) which differs nutritionally from typical Han diets (50). These ethnocultural variations in daily energy expenditure and nutritional intake patterns may contribute to the differential cardiometabolic risk profiles observed across ethnicities. Disparities in healthcare resource distribution across China, along with the elevated metabolic risks potentially associated with the Han ethnic group’s higher urbanization rate (5152).
As the largest ethnic group in China, the Han population has increased demands for disease prevention. Our study contributes to the development of relevant guidelines to address these needs.
Limitations
Firstly, although standard procedures were employed for the physical examinations, measurement bias may exist due to the high prevalence of osteoporosis and kyphosis among the elderly. Secondly, these results are based solely on a single BMI measurement at baseline, and the potential impact of social or healthcare changes over time was not fully controlled. Thirdly, selection bias resulting from the exclusion of lost-to-follow-up individuals may have influenced the study results. Finally, we did not systematically evaluate potential confounding effects from other chronic comorbidities on the BMI-comorbidity association.
Despite these limitations, compared to previous studies, this study provides more robust evidence. Future research should focus on optimizing measurement methods and data collection, considering the influence of time factors and social changes, reducing self-report bias, controlling for selection bias.
Conclusions
This study found that a higher BMI is significantly associated with an increased risk of hypertension-diabetes comorbidity, hypertension and DM, with a linear trend observed between BMI (range in BMI > 24.0) and the risk of these outcomes. Furthermore, compared to other ethnic, the Han ethnic exhibits a higher risk of developing hypertension and hypertension-diabetes comorbidity. Marital statuses of being widowed and separated were found to elevate the risk of DM and hypertension-diabetes comorbidity. These findings highlight that the disease burden attributable to BMI is more severe in the Han Chinese population, underscoring the critical need for targeted prevention policies.
Data Accessibility Statement
The data supporting the findings of this article is available on the online webpage: https://opendata.pku.edu.cn/dataset.xhtml?persistentId=doi%3A10.18170%2FDVN%2FWBO7LK.
Additional File
The additional file for this article can be found as follows:
Supplementary Files
Supplementary Figures S1 to S12 and Tables S1 to S4. DOI: https://doi.org/10.5334/gh.1487.s1
Competing Interests
The authors have no competing interests to declare.
Author contributions
JGJ and FL conceived the study design. GLL and HMZ did the statistical analysis. GLL and HMZ wrote the manuscript. All authors provided critical revisions of the draft and approved the submitted draft. The corresponding author attests that all listed authors meet authorship criteria and that no others meeting the criteria have been omitted. JGJ is the guarantor.
Haimeng Zhang and Guangling Li contributed equally to this work and should be considered co-first authors.
Fan Li and Jiangang Jiang contributed equally to this work and should be considered co-corresponding authors.