
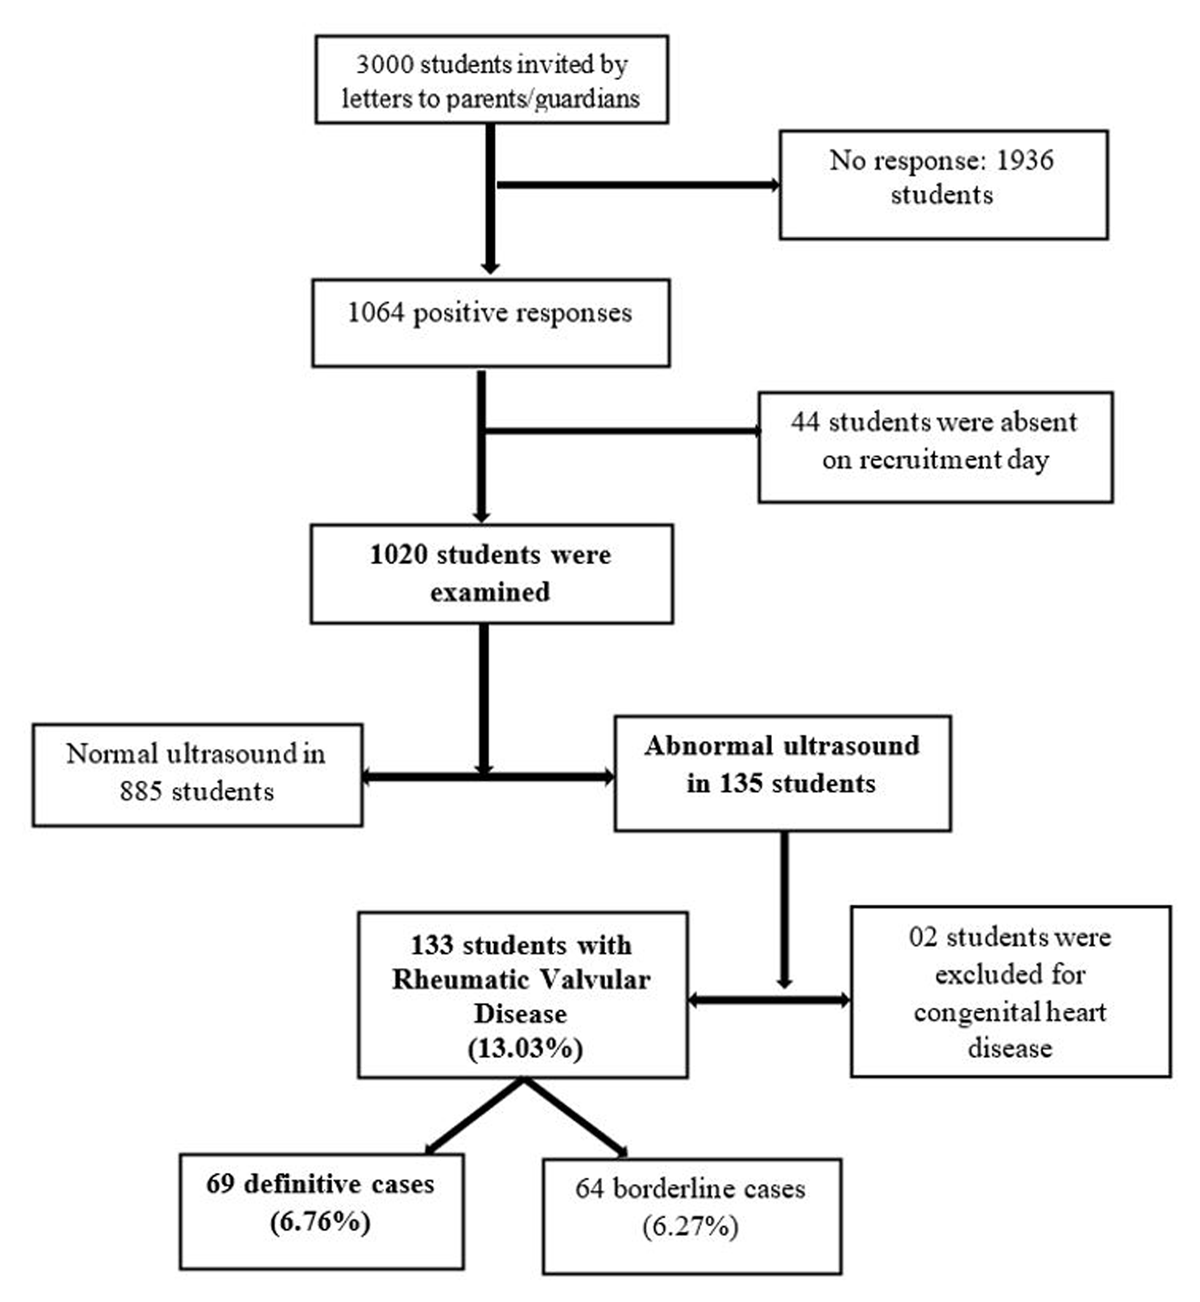
Figure 1
Participant flow chart.
Table 1
Socio-demographic characteristics of students who had RVD.
| VARIABLES | VALUES (N = 133) | PERCENTAGE (%) |
|---|---|---|
| Age range in years | ||
| [5–10] | 48 | 36.1 |
| [10–15] | 44 | 33.1 |
| [15–20] | 41 | 30.8 |
| Gender | ||
| Male | 48 | 36.1 |
| Female | 85 | 63.9 |
| Ethnicity | ||
| Bantu | 74 | 55.6 |
| Semi-Bantu | 52 | 39.1 |
| Sudanese | 7 | 5.3 |
| Household type | ||
| Single-parent | 31 | 23.3 |
| Two-parent | 102 | 76.7 |
| Residence | ||
| Urban | 81 | 60.9 |
| Semi-Urban | 28 | 21.1 |
| Rural | 24 | 18.0 |
Table 2
Environmental characteristics of students with RVD according to school.
| VARIABLES | VALUES (N = 133) | PERCENTAGE (%) |
|---|---|---|
| Level of school | ||
| Primary | 73 | 54,9 |
| College | 60 | 45,1 |
| Area of classroom (m2) | ||
| <50 | 71 | 53,4 |
| ≥50 | 62 | 46,6 |
| Students per classroom | ||
| ≤50 | 85 | 63,9 |
| [50–100] | 48 | 36,1 |
| Distance from home to school (km) | ||
| <1 | 19 | 14,3 |
| [1–5] | 83 | 62,4 |
| [5–10] | 21 | 15,8 |
| ≥10 | 10 | 7,5 |
| Type of transport used from home to school | ||
| None (walking) | 89 | 66,9 |
| Motorcycle | 14 | 10,5 |
| Car | 30 | 22,6 |
Table 3
Socioeconomic and professional status of parents/legal guardians of students with RVD.
| VARIABLES | VALUES (N = 133) | PERCENTAGE (%) |
|---|---|---|
| Age range in years | ||
| [20–30] | 1 | 0.8 |
| [30–40] | 20 | 15.0 |
| [40–50] | 106 | 79.7 |
| ≥60 | 6 | 4.5 |
| Professional status | ||
| Public sector employee | 41 | 30.8 |
| Private sector employee | 14 | 10.5 |
| Informal sector worker | 72 | 54.1 |
| Unemployed | 4 | 3.0 |
| Retired | 1 | 0.8 |
| Others | 1 | 0.8 |
| Mother’s scholar level | ||
| Primary | 13 | 9.8 |
| Secondary | 42 | 31.6 |
| University | 77 | 57.9 |
| Non-schooling | 1 | 0.7 |
| Monthly household income (F CFA) | ||
| <50.000 | 10 | 7.5 |
| [50.000–100.000] | 18 | 13.5 |
| [100.000–150.000] | 79 | 59.4 |
| [150.000–200.000] | 5 | 3.8 |
| ≥200.000 | 21 | 15.8 |
[i] 1 franc of CFA ≈ 0.0016 US Dollars.
Table 4
Type of residence of the students with RVD.
| VARIABLES | VALUES (N = 133) | PERCENTAGE (%) |
|---|---|---|
| Flooring materials in house rooms | ||
| Soil/sand | 4 | 3.0 |
| Tile | 74 | 55.6 |
| Cement | 53 | 39.9 |
| Others | 2 | 1.5 |
| Number of people sharing the same house | ||
| [0–2] person | 9 | 6.8 |
| [2–3] persons | 86 | 64.7 |
| [3–5] persons | 32 | 24.0 |
| >5 persons | 6 | 4.5 |
| Number of persons sharing the same bedroom in the house | ||
| 1 | 17 | 12.8 |
| 2 | 55 | 41.4 |
| 3 | 28 | 21.0 |
| 4 | 23 | 17.3 |
| 5 | 8 | 6.0 |
| 6 | 2 | 1.5 |
Table 5
Source of drinking water for households.
| VARIABLES | VALUES (N = 133) | PERCENTAGE (%) |
|---|---|---|
| Improved Source | ||
| None | 1 | 0.8 |
| Household tap | 55 | 41.4 |
| Public tap /fountain | 20 | 15.0 |
| Pump /drilling wells | 39 | 29.3 |
| Protected shaft | 13 | 9.7 |
| Mineral water | 5 | 3.8 |
| None Improved Source | ||
| None | 108 | 81.2 |
| Non Protected shaft | 10 | 7.5 |
| Unprotected source of water | 11 | 8.3 |
| Surface water (marsh. river. etc.) | 4 | 3.0 |
Table 6
Distribution of students with RVD according to clinical signs.
| VARIABLES | VALUES (N = 133) | PERCENTAGE (%) |
|---|---|---|
| Symptoms | ||
| None | 126 | 94.7 |
| Chest pain | 6 | 4.5 |
| Dyspnea | 1 | 0.8 |
| Nutritional status | ||
| Normal | 92 | 69.2 |
| Underweight | 28 | 21.1 |
| Overweight | 12 | 9.0 |
| Obese | 1 | 0.7 |
| Cardiac auscultation | ||
| Normal | 108 | 81.2 |
| Murmur | 23 | 17.3 |
| Arrhythmia | 2 | 1.5 |
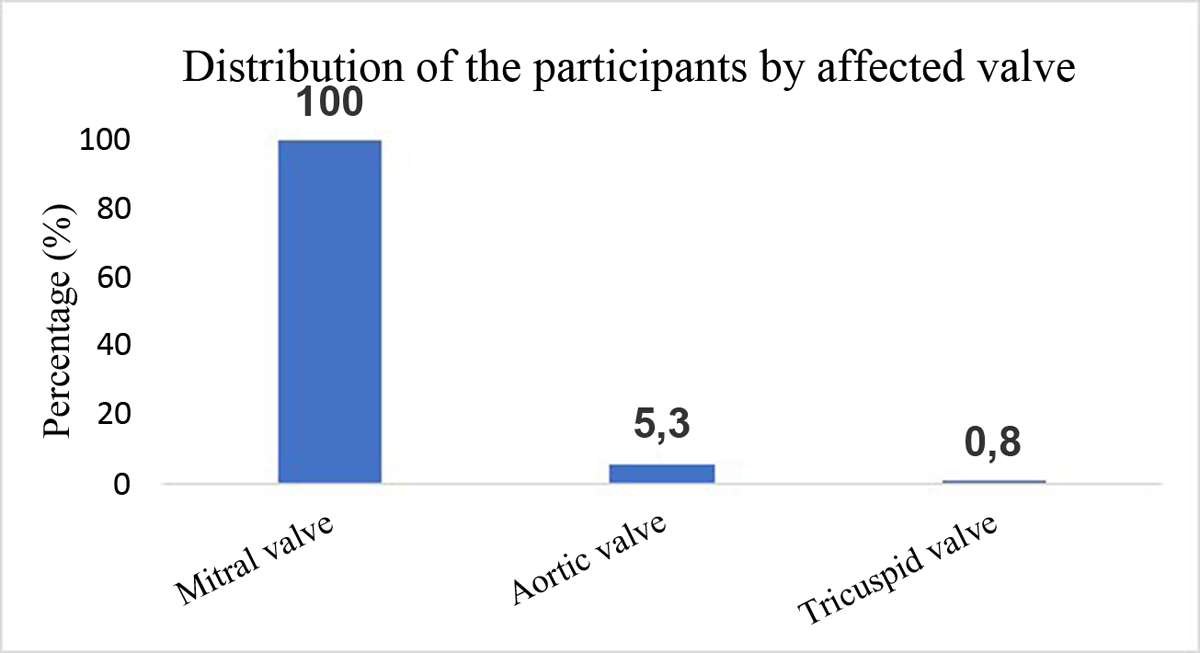
Figure 2
Distribution of participants by affected valve.
Table 7
Distribution of students with RVD according to morphological characteristics and lesions of affected valves.
| VARIABLES | VALUES (N = 133) | PERCENTAGE (%) |
|---|---|---|
| Mitral valve | ||
| Normal | 34 | 25.6 |
| Abnormal | 99 | 74.4 |
| Valvular and/or cord thickening | ||
| Yes | 99 | 74.4 |
| No | 34 | 25.6 |
| Movement restrictions | ||
| Yes | 57 | 42.9 |
| No | 76 | 57.1 |
| Prolapse | ||
| Yes | 7 | 5.3 |
| No | 126 | 94.7 |
| Calcifications | ||
| Yes | 1 | 0.8 |
| No | 132 | 99.2 |
| Aortic valve | ||
| Normal | 131 | 98.5 |
| Irregular or focal thickening | 2 | 1.5 |
| Monovalvular | ||
| Mitral insufficiency | 124 | 93.2 |
| Mitral stenosis | 1 | 0.8 |
| Mitral disease | 1 | 0.8 |
| Bivalvular | ||
| Mitral insufficiency and aortic insufficiency | 6 | 4.4 |
| Polyvalvular | ||
| Mitral insufficiency + aortic insufficiency + tricuspid insufficiency | 1 | 0.8 |