
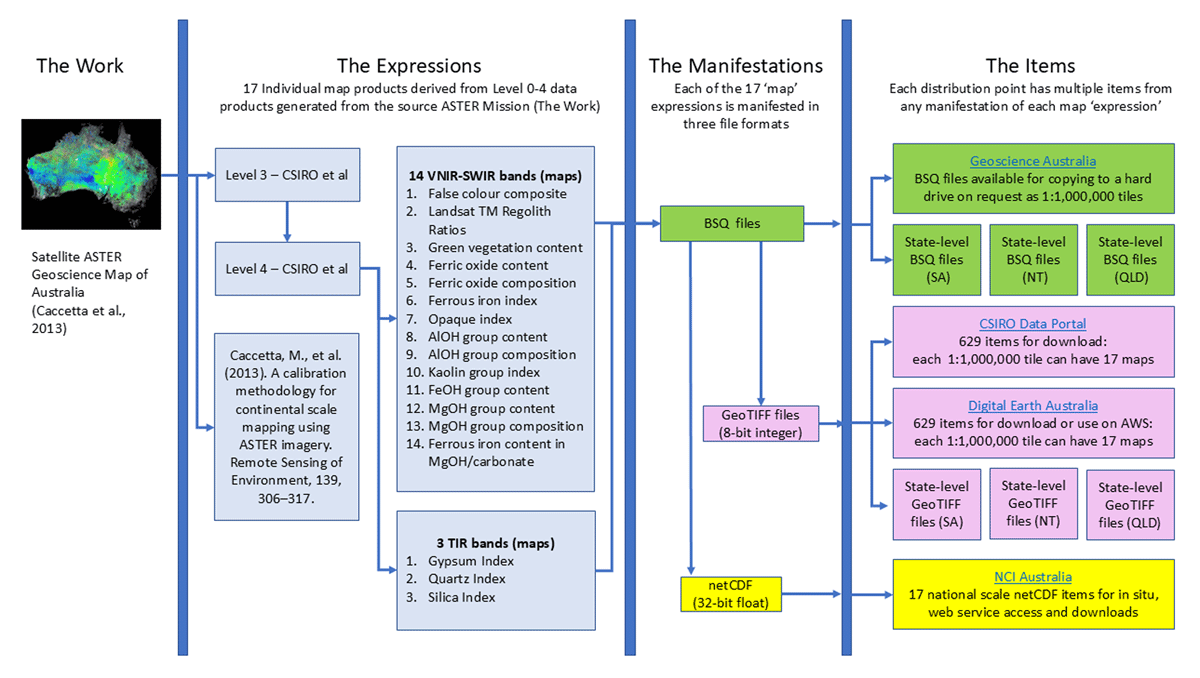
Figure 1
Overview of the data products and data items of the Satellite ASTER Geoscience Map of Australia (Caccetta et al., 2013).
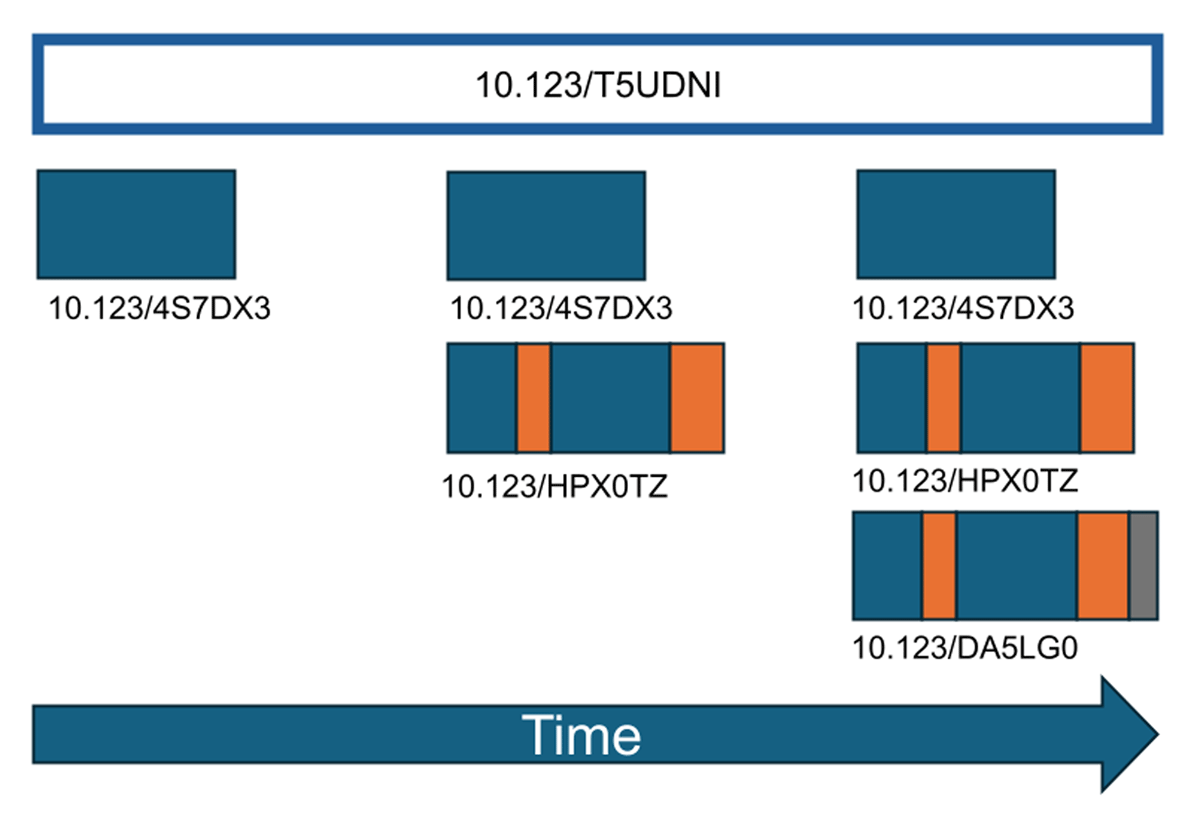
Figure 2
Identification and retention of data releases (Klump et al., 2016). The identifiers in this figure are only for illustration purposes.
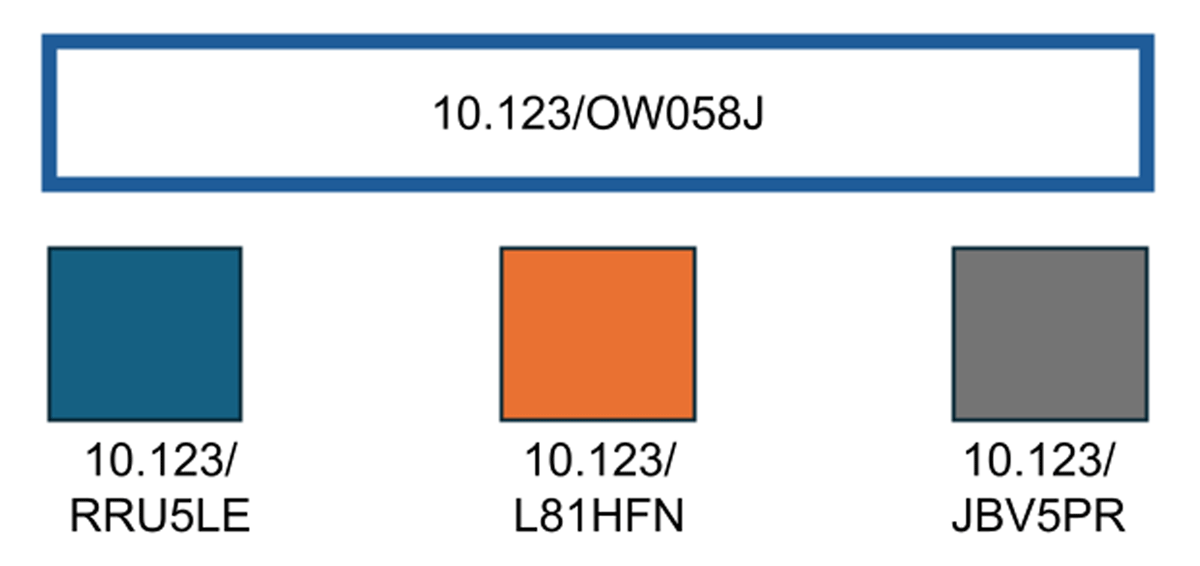
Figure 3
Collection of objects, where each object contained in the collection has its own identifier (Klump et al., 2016). The identifiers in this figure are only for illustration purposes.
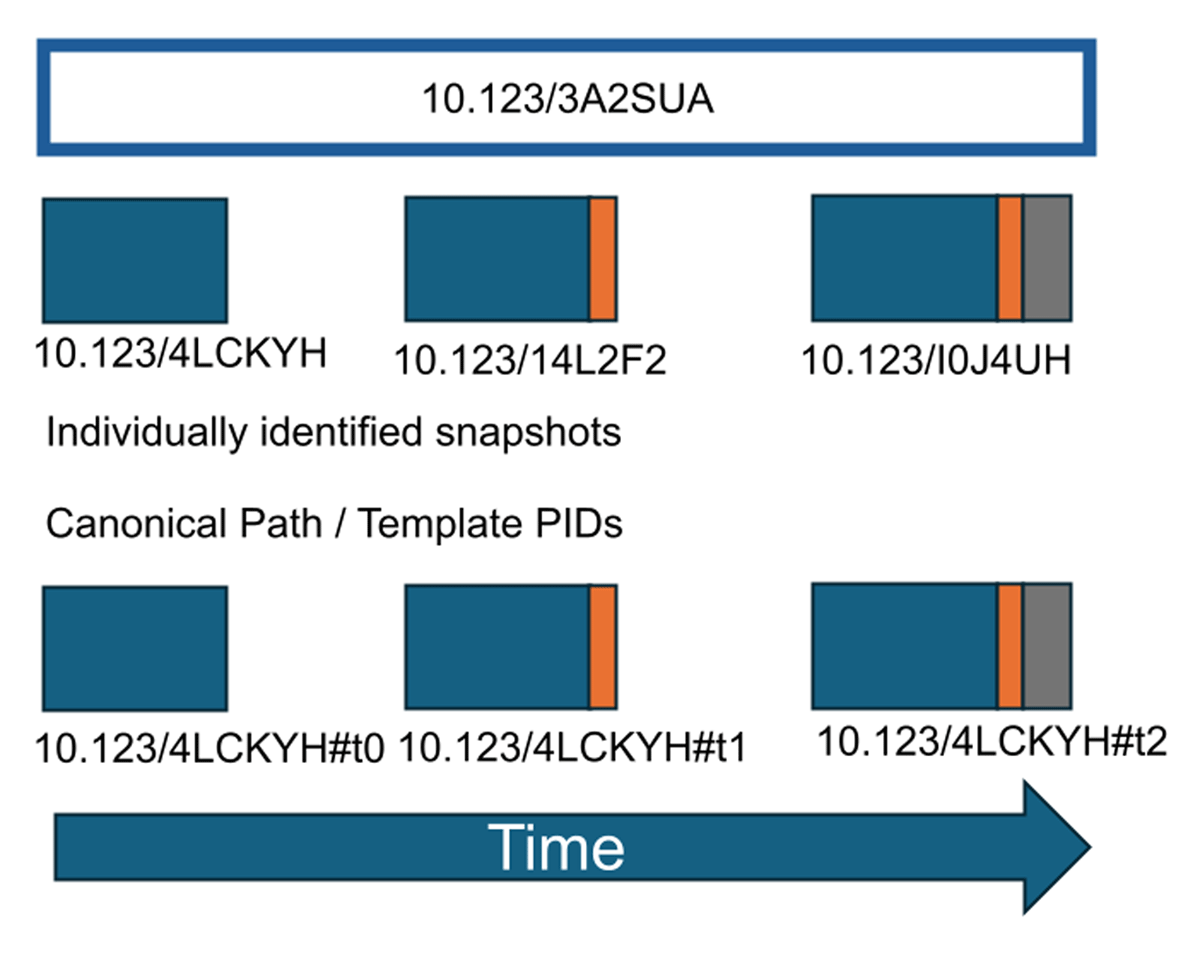
Figure 4
(top row) Identification of a time series as a whole with identified data snapshots at times T0, T1 and T2 as individually identified data releases and (bottom row) identification of subsets through a canonical path (Klump et al., 2024). The identifiers in this figure are only for illustration purposes.
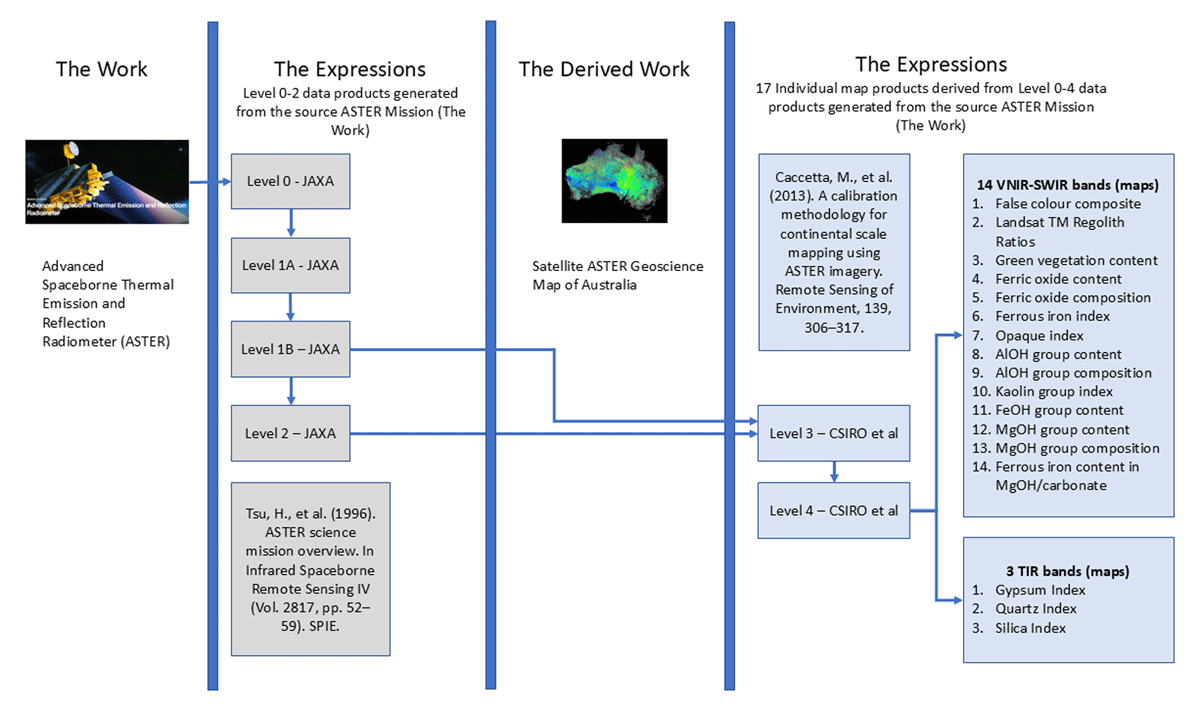
Figure 5
Derivation of the Satellite ASTER Geoscience Map of Australia (Work) (see also Figure 1) from the Spaceborne Thermal Emission and Reflection Radiometer (ASTER) (Work) by further processing of ASTER Level 1B and Level 2 data. Both Works are expressed through journal publications and data products.