
1. Introduction
Most modern scientific inquiries involve the participation of different disciplines. The combination of knowledge and methodologies from diverse disciplines is often essential for understanding the underlying phenomena. One of the biggest challenges in multidisciplinary research is the lack of a common ground, which causes misunderstandings and misinterpretations. These communication problems can lead to confusion and detours, which delay the solution of important research questions. Another recurring problem is the lack of interdisciplinary standards for data collection and storage. This results in an increased effort during data processing and evaluation.
The growing field of research data management (RDM) deals with the issue of communication and data handling between the various disciplines by creating a common basis (Wang, Göpfert and Stark, 2016). By introducing standardization, RDM aims to promote the reproducibility of scientific data. The creation of a structured basis for data collection, processing, and interpretation helps to break down communication problems and therefore foster the collaboration of the involved disciplines. In particular, the collection of structured and standardized metadata by implementing and using suitable metadata schemas plays an important role. Metadata, describing details such as the creator, type, source, and relationships of collected data, help scientists to find and reuse relevant data, also from other disciplines. To mend communication problems between involved disciplines, ontologies are used in RDM to convey the terminology required for the interdisciplinary approach and thus reduce ambiguity (Committee on Accelerating Behavorial Science through Ontology Development and Use, 2022). An ontology is a formally structured framework that represents the shared understanding and relationships of objects, concepts, and entities within a specific field or domain (Gruber, 1995). Ontologies often help with adopting the FAIR (findable, accessible, interoperable, and reusable) data principles in RDM solutions. The FAIR principles represent a guiding framework for the technical implementation of data management in a research field (Wilkinson et al., 2016). They contain criteria to describe the findability, accessibility, interoperability, and reusability of collected (meta-)data.
The design and implementation of workflows that collect research (meta-)data in a structured manner and in accordance with the FAIR criteria play a key role in RDM. These workflows are labeled as FAIR data workflows. FAIR data workflows optimize the planning of new experiments based on old results by increasing reproducible research data. The structuring, improved findability, and accessibility of research data enable the possibility of process automation and thus reduce the proportion of manual tasks. This minimizes the influence of bias on scientific data and optimizes work processes. Furthermore, the application of FAIR-compliant workflows can enable the usage of artificial intelligence (AI) on large data sets of multicenter studies (Orchard, 2025).
A relevant research field, which can largely benefit from the implementation of FAIR data workflows, is plasma science, where disciplines such as physics, chemistry, medicine, engineering, and biology are strongly intertwined and interdependent. One example of multidisciplinarity in plasma research is the development and testing of new plasma sources. Physicists and engineers design a plasma source, which is then built by mechanical and electrical engineers. The plasma source is then tested for functionality, and the generated reactive oxygen and nitrogen species are analyzed by spectroscopy diagnostics on the effluent (Golda et al., 2020) or by ion-exchange chromatography (IC) for plasma-treated liquids (Schnabel et al., 2021). Furthermore, physicists and mathematicians work together on the characterization and simulation of the physical properties of the plasma source. Once the fundamentals of the source have been determined, the source is tested on various organisms such as bacteria (Das et al., 2024) or eukaryotic cells (Choi et al., 2024). Biologists, biochemists, and physicians are involved in these laboratory tests. The results of the laboratory tests have to be assessed regarding the relation between the laboratory results and the applied plasma.
This publication introduces the concept and implementation of an RDM workflow, which tackles these requirements. The work is based on a previously published conference proceeding (Wagner et al., 2024). It explains the implementation and FAIR assessment of the workflow for IC applications in plasma technology in detail.
2. Materials and Methods
When implementing FAIR data workflows, it is important to consider not only the disciplines with their terminology and target groups involved, but also the current research workflows carried out by these target groups. New FAIR data workflows can only be adopted by the researchers if the required effort does not hinder the existing tasks. For this reason, the focus has been on the early stages of the workflows, primarily concerning the FAIR-compliant collection and usage of metadata.
2.1 FAIR data workflow integration in IC
The analytical method IC plays a crucial role in plasma biotechnology, e.g., for evaluating the generation of reactive nitrogen species in treated liquids for decontamination purposes, and often involves multidisciplinary research. Therefore, it was selected here for the introduction of a FAIR data workflow in plasma science. IC is a chromatographic analytical method to analyze the ion composition of liquid samples. In general, two methods are related to IC: first, the anion-exchange chromatography, and second, the cation-exchange chromatography. Both methods rely on the difference in the physical and chemical properties of each ion. The differences in the physicochemical properties of the ions are used to separate them in the sample, by delaying their transport through the solid phase. The passing ions are then detected by detectors (e.g., conductivity detectors). This method can be used to analyze plasma-treated liquids in different fields related to applied plasma science, such as agriculture (Javed et al., 2024), food processing (Schnabel et al., 2021), medicine (Kim and Kim, 2021), and microbiology (Winter et al., 2024). The former IC workflow consisted of sample preparation, sample measurement, manual data annotation, and evaluation. The description of the sample processing is usually done according to individual preparation protocols. The description of measurements includes the configuration of the chromatograph and the separation components used (such as columns and eluent). The lack of details in the measurement description is not only problematic for IC measurements, but also for the well-known and widely used method of high-performance liquid chromatography (HPLC) (Harrieder et al., 2022).
In the previous proceeding (Wagner et al., 2024), the workflow concept for FAIR data workflows using discipline-specific metadata collection standards was presented. This workflow concept includes the metadata acquisition using Adamant in combination with discipline-specific metadata collection standards. The workflow also contains the storage of the resulting JavaScript Object Notation (JSON) files in eLabFTW, the semantic description of the acquired metadata via ontologies, and the graphical representation of related experiments in graph databases (GDBs). The implementation of this concept, demonstrated on the example of the IC, splits into three phases, which are shown in Figure 1.
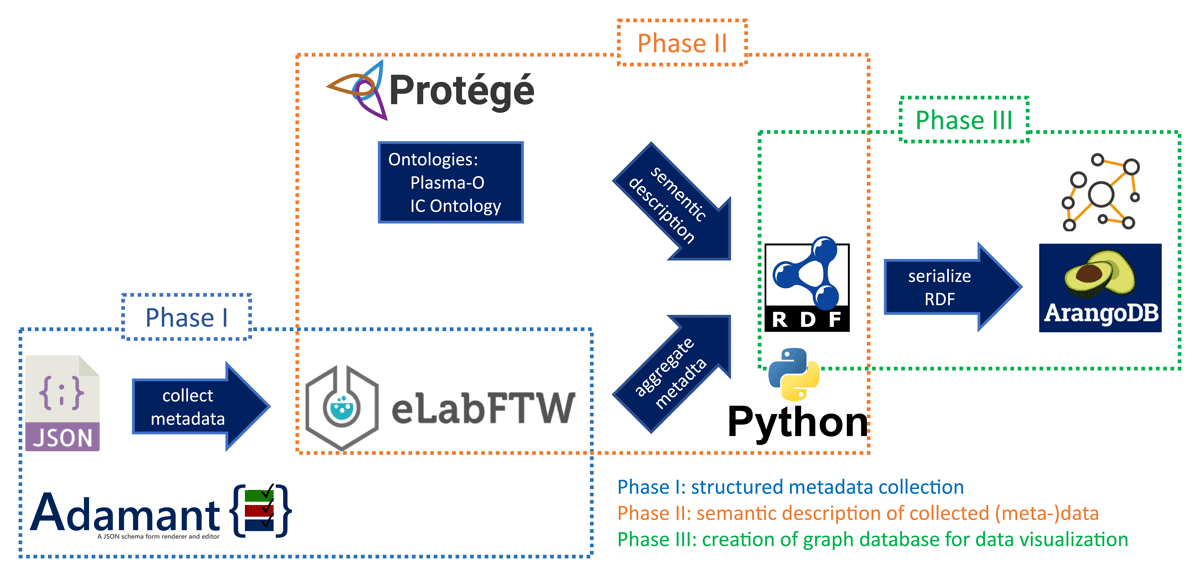
Figure 1
Schema of the three-phase workflow implementation. Overview of the three phases and the involved tools of the implementation of a FAIR data workflow for ion-exchange chromatography.
It shows that the RDM tool Adamant (Chaerony Siffa et al., 2022) is utilized to collect the IC-related metadata and store them directly in the electronic laboratory notebook (ELN) eLabFTW (Carpi, Minges and Piel, 2017) (Phase I, blue box). The collected metadata is aggregated into triple sets by the usage of Python scripts and an IC ontology (designed and managed by Protégé software (Musen and Protégé Team, 2015)), which extends the plasma ontology Plasma-O (Chaerony Siffa et al., 2025) (Phase II, orange box). The resulting resource description framework (RDF) file is then represented as a graph using the GDB software ArangoDB (Phase III, green box). The implementation of these three phases is described using a practical use case. In this example, a plasma source was tested and adapted for application in aquaculture, with IC playing a key role in the creation of test water based on real aquaculture plant water (Balazinski et al., 2025) and in subsequent experiments to assess the safety risks to fish in the plants (Balazinski et al., 2026). Thorough and harmonized documentation is necessary, as some of the experiments involve living animals and therefore require ethical approval.
2.2 Target group analysis and requirements
The target group for the suggested workflow has to be analyzed to provide insights into the background and needs of the users. This analysis influences the possible design choice of the workflow. The tailored approach during workflow creation is intended to improve acceptance by the end users. The target group for the IC workflow mainly refers to scientists in the laboratories performing the IC. They examine the ionic composition of their liquid samples with changing matrices and methods. However, the analysis is also frequently used by students for their theses. The extent of experience in analytics and RDM varies within the target group. Therefore, the workflow includes graphical and user-friendly approaches such as the GDB and the designed metadata schemas. In addition to the target group, the structure of the data from the experiments must also be analyzed. The data consist of the measurement-relevant metadata, the sample description data (e.g., pH value and conductivity), the measurement report as well as the time series data of the conductivity detector readings. The reports and time series data are stored in the local laboratory information management system (LIMS) of the device. The sample description data are stored in eLabFTW alongside the sample processing description. These two steps remain unchanged in the proposed workflow, but the stored data can be integrated into the GDB in phase III (Figure 1). Therefore, the metadata collection and their storage will be discussed in Section 2.3.
2.3 Metadata collection and storage using Adamant
Once the target groups and the type of data have been determined, the strategies for collecting the metadata must be defined. Due to the relatively homogeneous structure of the target group, the metadata collection has to address their domain-specific terms and structure as well as a straightforward input of the metadata. As a starting point for the first phase, which focuses on the findability and accessibility of the generated datasets, a metadata schema for each anion and cation IC measurements was designed, described in a publication (Wagner et al., 2025) and published on GitHub together with two use case examples for anion-exchange chromatography.1 The release version v.0.5. is also available on Zenodo (Wagner and Becker, 2025). The metadata are collected using the published metadata schemas by Adamant. Adamant transforms metadata schemas provided in JSON format into a hypertext markup language (HTML) form that can be filled out in a user-friendly way. It also makes it possible to avoid having to fill out the entire schema by assigning default values or loading standard methods (in the form of prefilled JSON data files that already contain mostly consistent elements). Furthermore, Adamant validates the resulting JSON file against the JSON schema to ensure consistent metadata. The validated JSON file is then sent via Adamant and the application programming interface (API) of eLabFTW to the ELN as an experiment with the JSON file and the associated JSON schema as attachments. Adamant can also be used to easily change the metadata schemas without prior knowledge of the JSON structure and transform changes in the HTML form back into a valid JSON schema. In the aforementioned example, the experimenter collected the measurement-relevant metadata using Adamant and the provided metadata schemas. The example is one of the use-case examples from (Wagner et al., 2025). Hence, phase I (Figure 1) lays the foundation for the FAIR data workflow and is already completed and disseminated to the community. To initiate the second implementation phase, the design and use of a suitable ontology is necessary.
2.4 Ontology development
The IC ontology is designed to enable metadata gathered through the metadata schema to be fully machine-actionable by enabling direct reuse of relationships in the subsequent GDB. The first release version of the IC ontology was developed using the software Protégé v. 5.6.4 (Musen and Protege, 2015) and is publicly available at https://github.com/plasma-mds/ic-ontology. The used ontology designing methodology is based on the ‘Methontology’ method (Fernández-López, Gomez-Perez and Juristo, 1997). This method divides ontology development into the phases listed in Table 1.
Table 1
Ontology development phases of the Methontology method (Fernández-López, Gomez-Perez and Juristo, 1997).
| PHASE | DESCRIPTION |
|---|---|
| Specification | Purpose, level of formality and scope of the ontology |
| Knowledge acquisition | Collection of information from experts, books, handbooks, etc. according to the prior specified purpose and scope |
| Conceptualization | Structured model of the collected domain knowledge that describes the purpose of the ontology |
| Integration | Reuse of already defined ontology terms to lessen the number of new definitions |
| Implementation | Technical realization of the ontology based on the concept model |
| Evaluation | Technical validation of the ontology (e.g., consistency checks) |
| Documentation | Formal description of the ontology in natural language (e.g., logic definitions or journal publications) additionally to the ontology code |
Additionally, the Protégé plug-in ‘OntoGraf’2 is used for the visualization of the ontology in combination with the reasoner ‘HermiT 1.4.3.456’ (Shearer, Motik and Horrocks, 2008) to detect occurring semantic inconsistency errors during the development. The ontology is described by 671 axioms and consists of 118 class entities, 8 object properties, 5 data properties, 13 annotation properties, and 25 individuals. This ontology uses a language-agnostic approach and will be used as an extension to the plasma ontology Plasma-O. To enable the transition to phase II of the workflow, the unique resource identifiers (URIs) of the ontology are assigned to the relevant fields of the metadata schemas. This assignment enables the structured collection of semantically described metadata. The mapping of the ontology to the metadata schema is illustrated in an excerpt in Table 2 using the example of the metadata collected previously. The full mapping is provided as supplementary file number 1.
Table 2
Ontology-metadata schema mapping excerpt based on important metadata from the aquaculture example data set (full mapping in supplementary file number 1).
| METADATA SCHEMA FIELD | ONTOLOGY IRI | CLASS LABEL | EXAMPLE VALUE |
|---|---|---|---|
| Sequence name | http://purl.obolibrary.org/obo/MS_4000089 | Injection sequence label | 2022-02-22_Wasser_Born |
| Date of measurement begin | http://purl.obolibrary.org/obo/AGRO_00010151 | Experiment date | 23.02.2022 |
| Runtime [min] | https://plasma-mds.org/ontology/IC_Ontology/IC_C0077 | Runtime | 40 |
| Injection volume [µL] | http://purl.allotrope.org/ontologies/result#AFR_0001267 | Autosampler Injection Volume Setting | 5 |
| Pump mode | https://plasma-mds.org/ontology/IC_Ontology/IC_C0009 | Pump Mode | Isocratic |
| Eluent mode | https://plasma-mds.org/ontology/IC_Ontology/IC_C0006 | Eluent Mode | Isocratic |
| Hydroxide suppression [mM] | https://plasma-mds.org/ontology/IC_Ontology/IC_C0061 | Hydroxide Suppression Current | 23 |
The semantic description using the IC ontology will also help prevent misunderstandings. For example, the metadata schema field ‘Hydroxide suppression [mM]’ can be confusing because suppression is often noted as a current (mA), while most IC devices expect an input in molarity; the device converts molarity to current electrochemically. The ontology contains a detailed explanation of this and other misleading fields. The semantic description will also enable machine actionability and lay the foundation for a systematic reuse of the collected data in a knowledge graph or GDB. The GDB integration starts the third phase of the workflow implementation.
2.5 GDB development
The graph representation of the collected metadata (e.g., experiment, project, involved scientists and device configuration and description) in combination with the semantic description of the IC ontology will be realized by setting up a GDB (Larriba-Pey, Martínez-Bazán and Domínguez-Sal, 2014). A GDB consists of nodes and edges (also called relationships in GDBs). The entities defined in the IC ontology (IC-O) and Plasma-O will be used to create the individual node sets of the ArangoDB graph (referred to as node collections in ArangoDB). The relationships specified in both ontologies determine the corresponding edge sets (edge collections in ArangoDB). By predefining node–edge relationships, the graph construction process is streamlined and harmonized, eliminating the need for manual node and edge definitions. The advantage of the GDB is, in addition to the visual representation, the possibility of providing the nodes with further information by means of the so-called properties. The graph of a GDB is therefore also referred to as a property graph (Angles, 2018). The GDB is structured analogously to the classic ‘triple store’ on the basis of RDF (Candan, Liu and Suvarna, 2001) files. RDF files define relationships between elements using the classic triples of subject, predicate, and object. Subject and object correspond to nodes of the graph and the predicate represents the relationship between these two nodes as edges. The chosen GDB for the implementation of the suggested FAIR data workflow is ArangoDB.3 ArangoDB natively supports the direct embedding of JSON documents and thus enables direct integration of the collected metadata in its native format. By linking various data sources and presenting them clearly in graph form, the GDB enables fast and user-friendly browsing of information without the need to switch the different data sources.
To illustrate the GDB, Figure 2 shows the representation of the example experiment with nodes (ontology classes) and edges (properties). The representation of the experiment in the GDB contains a direct link to the experiment description in eLabFTW as a graph property.
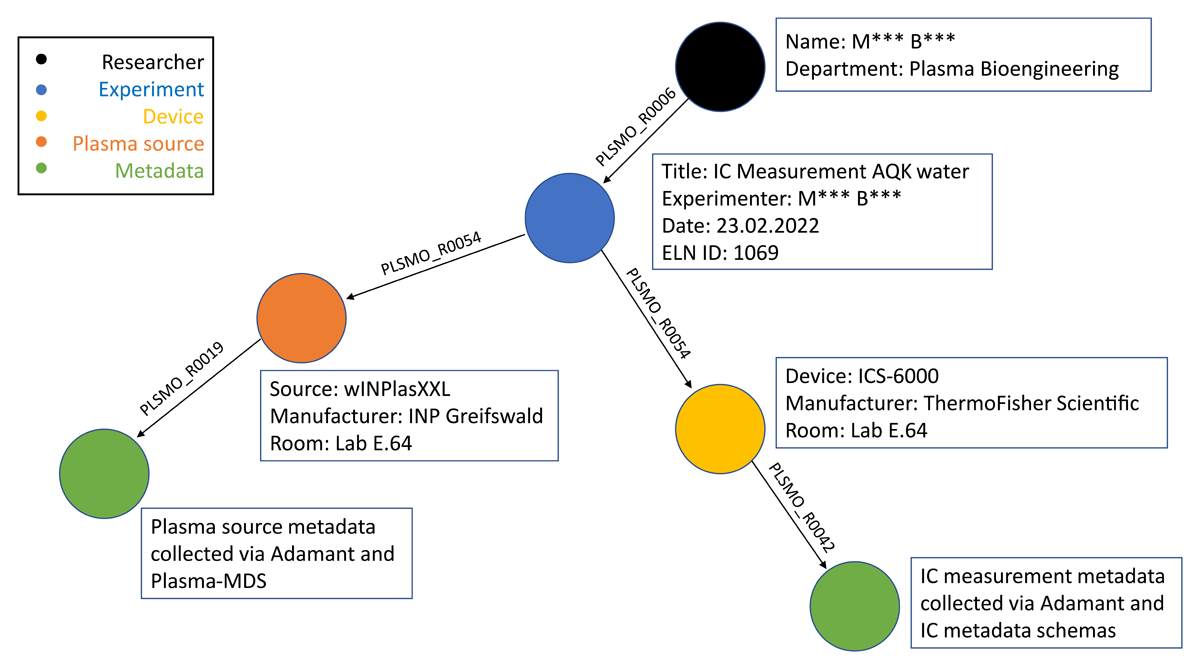
Figure 2
Graph example for representation in ArangoDB. Graph representation of the sample dataset and suitable properties within ArangoDB using the ontologies Plasma-O and IC-O.
The experimenter is connected to their experiment via the Plasma-O object property PLSMO_R0006. PLSMO_R0006 describes the relationship between an agent (in this case, the experimenter as a person) and a research activity (in this example, the scientific experiment). The experiment is connected to the used plasma source and ion chromatograph via the object property PLSMO_R0054. PLSMO_R0054 describes the relationship between a research activity (the scientific experiment) and the involved material entities (the devices wINPlasXXL and ICS-6000). The plasma source is connected to their relevant metadata, which are collected using Adamant and the plasma metadata schema Plasma-MDS (Franke et al., 2020), via the Plasma-O object property PLSMO_R0019.
PLSMO_R0019 describes the relationship between a document (the collected JSON based metadata) and a material entity (the plasma source). The relationship between the ion chromatograph and their collected metadata is described by PLSM_R0042. This object property describes the relationship between a device and its configuration. ArangoDB supports direct upload of JSON documents as nodes, with their key-value pairs as properties.
2.6 FAIR compliance benchmark of the IC workflow
To evaluate and measure how effectively the FAIR principles are implemented by the designed workflow, the guiding principles listed by Wilkinson et al. (Wilkinson et al., 2016) are listed in Table 3 and subsequently examined individually for their compliance.
Table 3
The FAIR guiding principles according Wilkinson et al. (Wilkinson et al., 2016).
| ID | PRINCIPLE |
|---|---|
| F | To be Findable: |
| F1 | (meta)data are assigned a globally unique and persistent identifier |
| F2 | data are described with rich metadata (defined by R1 below) |
| F3 | metadata clearly and explicitly include the identifier of the data it describes |
| F4 | (meta)data are registered or indexed in a searchable resource |
| A | To be Accessible: |
| A1 | (meta)data are retrievable by their identifier using a standardized communications protocol |
| A1.1 | the protocol is open, free, and universally implementable |
| A1.2 | the protocol allows for an authentication and authorization procedure, where necessary |
| A2 | metadata are accessible, even when the data are no longer available |
| I | To be Interoperable: |
| I1 | (meta)data use a formal, accessible, shared, and broadly applicable language for knowledge representation |
| I2 | (meta)data use vocabularies that follow FAIR principle |
| I3 | (meta)data include qualified references to other (meta)data |
| R | To be Reusable: |
| R1 | meta(data) are richly described with a plurality of accurate and relevant attributes |
| R1.1 | (meta)data are released with a clear and accessible data usage license |
| R1.2 | (meta)data are associated with detailed provenance |
| R1.3 | (meta)data meet domain-relevant community standards |
The compliance verification was carried out by checking whether the guiding principles were sufficiently implemented or not. Special attention is paid to the sectors findability and accessibility, as these play an important role in the implementation of the first phase and are therefore the current status indicators. Nevertheless, the complete implementation of the FAIR data workflow is aimed at full compliance with the guiding principles. A more detailed and quantitative FAIR assessment was carried out by means of two established structured FAIR assessment frameworks in the form of questionnaires. The first structured assessment is the Australian Research Data Common (ARDC) FAIR data self-assessment tool.4 The second structured FAIR assessment utilizes the open source Data Stewardship Wizard (DSW) software (Pergl et al., 2019) and the Common DSW Knowledge Model version 2.6.10.5 The questionnaires of the two structured FAIR assessments differ in the scope of the questions and the respective evaluation scale and are therefore intended to provide a more detailed evaluation of the current implementation status compared to the expected final status.
3. Results
3.1 Adherence to FAIR principles
First, the four criteria for findability, F1, F2, F3, and F4, are checked for their compliance. In the first implementation phase of the workflow, the metadata collection and storage in eLabFTW via Adamant was introduced. The workflow generates globally unique and persistent identifiers based on the unique ID of each ELN entry created (fulfillment of criterion F1). Criterion F2 is fulfilled by application of the recently published metadata schema for IC (Wagner et al., 2025). The first draft for the schema was based on the ASTM E1151-93 norm ‘Standard Practice for Ion Chromatography Terms and Relationships’ (ASTM, 1993). This draft was presented to the end users to adopt missing information from the current research workflow. The introduced metadata schema contains a field addressing the name of the relating measurement batch (the so-called ‘sequence’), therefore the criterion F3 is fulfilled. A sequence has to be unique as most analytical devices and their software utilize unique names and other classic LIMS features (e.g., audit trails tracking time-stamped device interactions) to enable proper quality management. The storage of the collected metadata into eLabFTW makes the search of the indexed entries and, therefore, the fulfillment of F4 possible. In summary, all criteria of the findability sector are fulfilled.
Second, the four accessibility criteria A1, A1.1, A1.2, and A2 and their realization are evaluated. The first criterion A1 is satisfied by the workflow, since all metadata are stored in eLabFTW. The stored metadata can be accessed via their respective URL or experiment ID by simply clicking on them and therefore criterion A1 is fulfilled. Criterion A1.1 is also fulfilled, as eLabFTW uses the hypertext transfer protocol (HTTP) as HTTP requests for its API and for its interface as a web application. By using the hypertext transfer protocol secure (HTTPS) for access to the ELN and the authentication process when logging in, criterion A1.2 is also fully satisfied. The criterion A2 is satisfied, given the fact that the metadata is stored together with the analyzed measurement data in the ELN as experiments. Even if these experiments are deleted, eLabFTW can be set up to not finally delete these experiments. The raw measurement data can only be deleted from the central storage of the device by an administrator due to quality assurance restrictions (or in case of broken storage hardware). However, if a batch of interrelated experiments is done, there is also the possibility to timestamp (via a trusted time-stamping authority) this batch of experiments and store these time-stamped experiments on the Bloxberg blockchain.6 This procedure also ensures tamper-proofing of the collected meta- and measurement data.
Third, the interoperability criteria I1, I2, and I3 are evaluated regarding their fulfillment. These are not yet sufficiently fulfilled (due to an incomplete semantic description of the collected metadata) in the current state of development, but the upcoming finalization of the IC ontology will address the fulfillment of the interoperability criteria. However, all metadata described by other (already existing) ontologies, such as CHMO (Batchelor, 2019) and Plasma-O are already linked to the respective ontologies.
Finally, the reusability criteria R1, R1.1, R1.2, and R1.3 are evaluated. The criteria R1 and R1.3 are satisfied by the current implementation due to the fact that the laboratory workflow was taken into account during the creation of the metadata schema, and an ASTM standard was incorporated. Provenance in the overall concept (e.g., sample preparation prior to measurement) and licensing of the collected metadata have not yet been fully implemented, and therefore criteria R1.1 and R1.2 are not fulfilled. As an overview, the fulfillment or non-fulfillment of the individual criteria are summarized in Table 4.
3.2 Australian Research Data Common FAIR data self-assessment
The ARDC FAIR data self-assessment consists of 12 multiple-choice questions, which enable a graduated assessment of the four FAIR sectors. In contrast to the verification of the fulfillment of the guiding principles, the individual answers to each question are weighted differently for the individual sectors and thus allow a more targeted assessment of FAIR compliance. Figure 3 shows the resulting scores for the current implementation (Figure 3A) and in case of the full implementation of the designed workflow (Figure 3B).
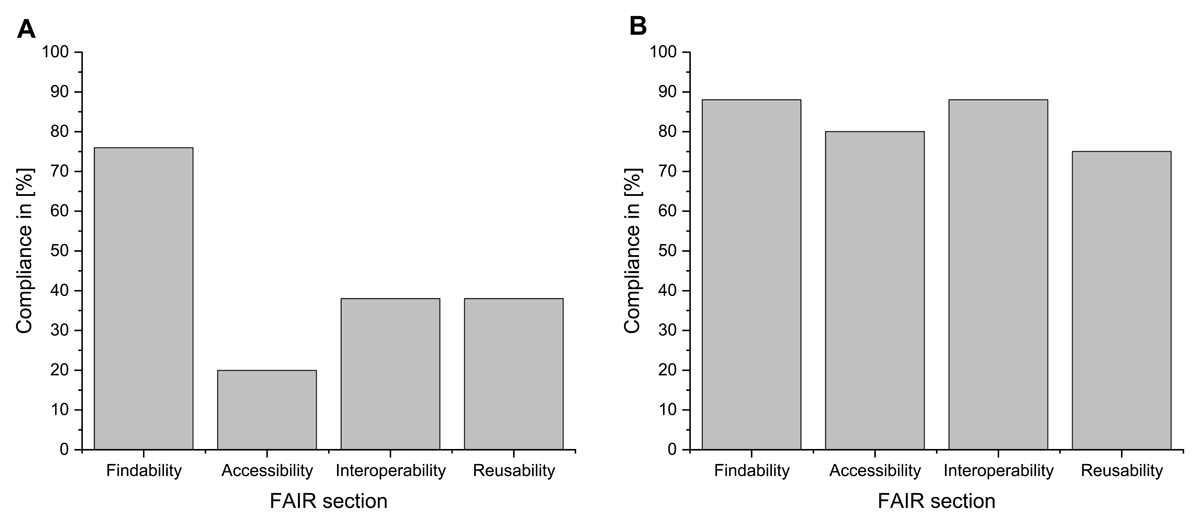
Figure 3
Comparison of the results of the ARDC FAIR self-assessment. Results of the ARDC FAIR self-assessment for the current workflow implementation (A) and the scores of the full implementation (B) in comparison.
The average overall FAIR score of the current implementation (Figure 3A) is 43%, and the planned full implementation (Figure 3B) has an average overall FAIR score of 83%. The current implementation depicts clear differences between the individual FAIR sectors. The findability represents the maximum, with 76%, and accessibility represents the minimum of the scores achieved at 20%. The full implementation shows only minor differences between the individual FAIR sectors. Here, the findability represents the maximum with 88%, but this time, the reusability with 75% is the minimum of the achieved scores. The difference, according to the ARDC questionnaire, between the current implementation and the full implementation is very striking for the sectors findability (12% difference), accessibility (60% difference), interoperability (50% difference), and reusability (47% difference). To visualize the differences in the implementation status according to the ARDC assessment tool, the scores achieved so far (green area) are compared with the maximum possible scores (according to the assessment tool) of a full implementation (blue lines) in Figure 4. The raw data for both ARDC assessments are linked as supplementary file number 2.
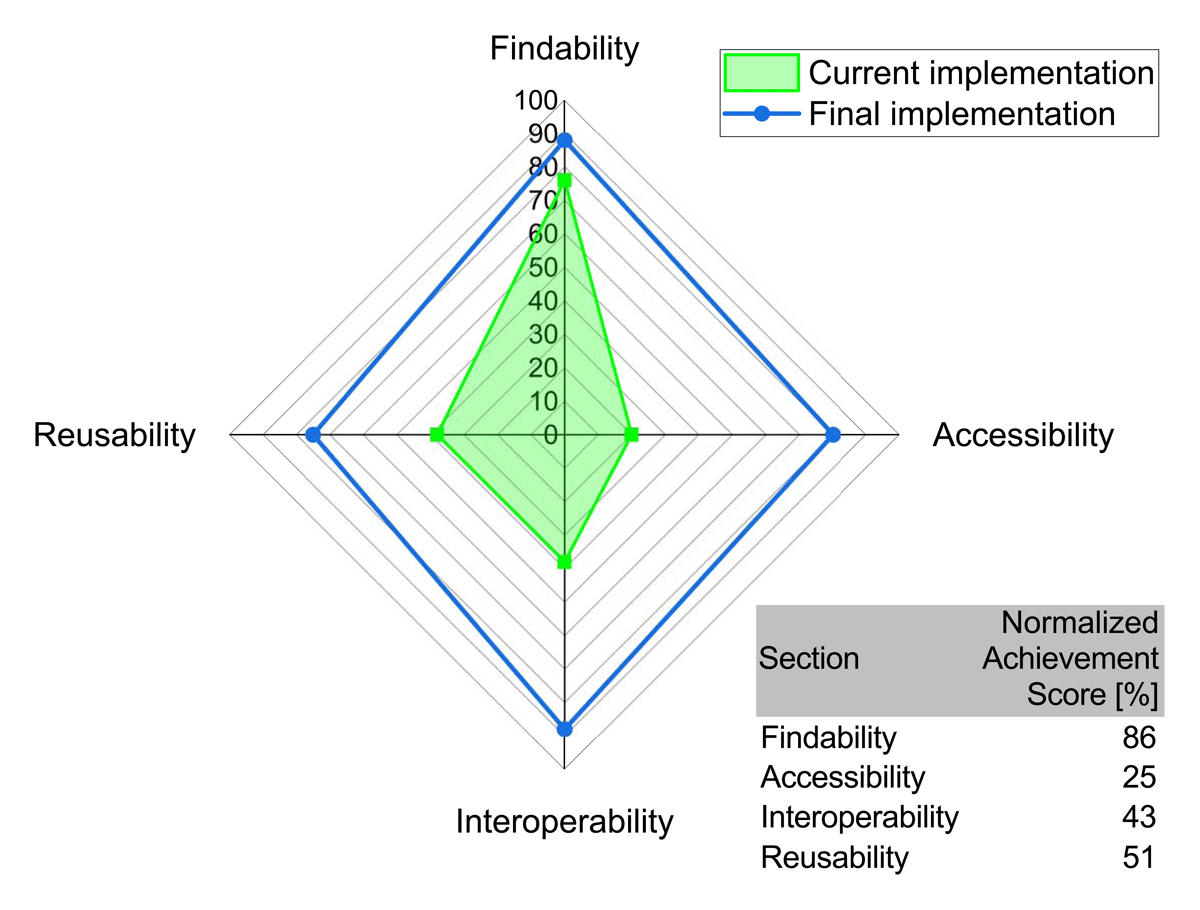
Figure 4
Degree of FAIR implementation according to the ARDC assessment. Radar graph displaying the degree of FAIR implementation in the designed workflow. The blue line displays the maximum achievable score in the ARDC FAIR self-assessment tool for the future full implementation, With the green area showing the current achievements according to the ARDC assessment. The table summarizes the normalized achievement for each FAIR section, whereas 100% define the max. score from the full workflow implementation.
3.3 DSW assessment
A second structured FAIR assessment was carried out with the open source DSW software (Pergl et al., 2019) and the Common DSW Knowledge Model version 2.6.10. By integrating the knowledge model, the DSW enables a FAIR questionnaire with an extensive collection of questions (with up to 200 questions) to assess the FAIR compliance of a project (in this case, the workflow implementation). The assessment also allows a focused benchmarking on the fulfillment of the FAIR criteria in specific areas of a project through categorical metrics. The most relevant areas of the benchmark for the IC workflow are ‘Creating and collecting data’, ‘Processing data’, ‘Interpreting data’, ‘Preserving data’, and ‘Giving access to data’. In Figure 5, the average FAIR scores after answering the related questions of the questionnaire are depicted to summarize the structured FAIR assessment.
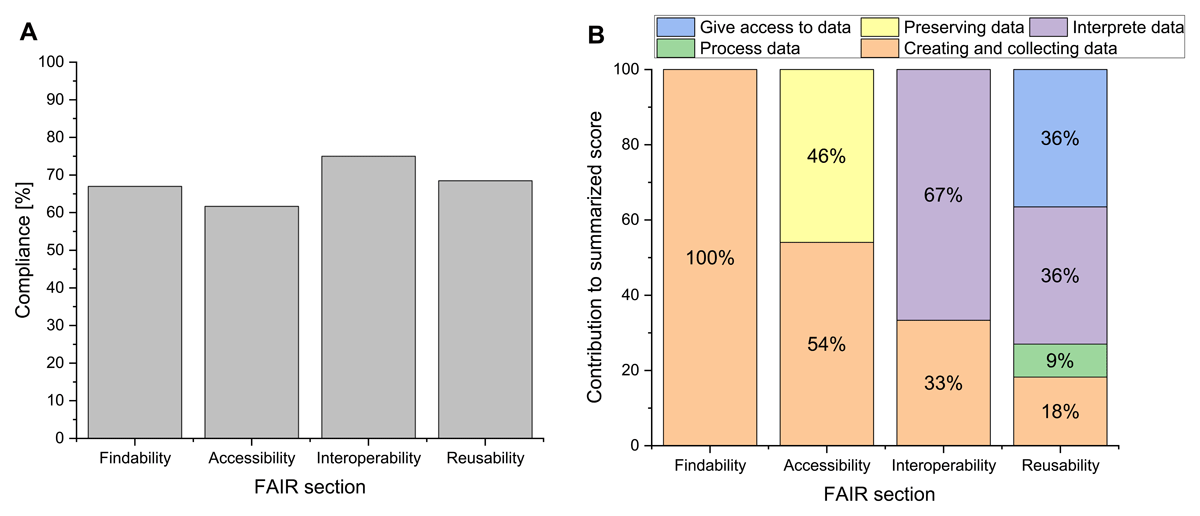
Figure 5
Result of DSW assessment for current workflow implementation. Summary report of the Data Stewardship Wizard software using the Common DSW Knowledge Model. The report displays the FAIR compliance score of the implemented IC workflow at the current state (A) and the contribution of the selected areas of the questionnaire to the individual scores (B).
The average FAIR compliance (Figure 5A) shows that all sectors of FAIR are at least 60% compliant with the evaluation standard of the DSW questionnaire. The maximum FAIR score was achieved for the interoperability with 75%, and the minimum FAIR score was achieved in the accessibility section with 62%. Nevertheless, the contribution of each selected segment of the questionnaire (Figure 5B) also shows that the impact of each segment strongly differs for the individual FAIR sectors. For example, the findability score is calculated only from the ‘Creating and collecting data’ segment. By contrast, the ‘Process data’ segment accounts for only 9% of the reusability score and otherwise does not affect the evaluation. The further implementation of the next phases continues to improve the FAIR compliance of the workflow, as shown in Figure 6.
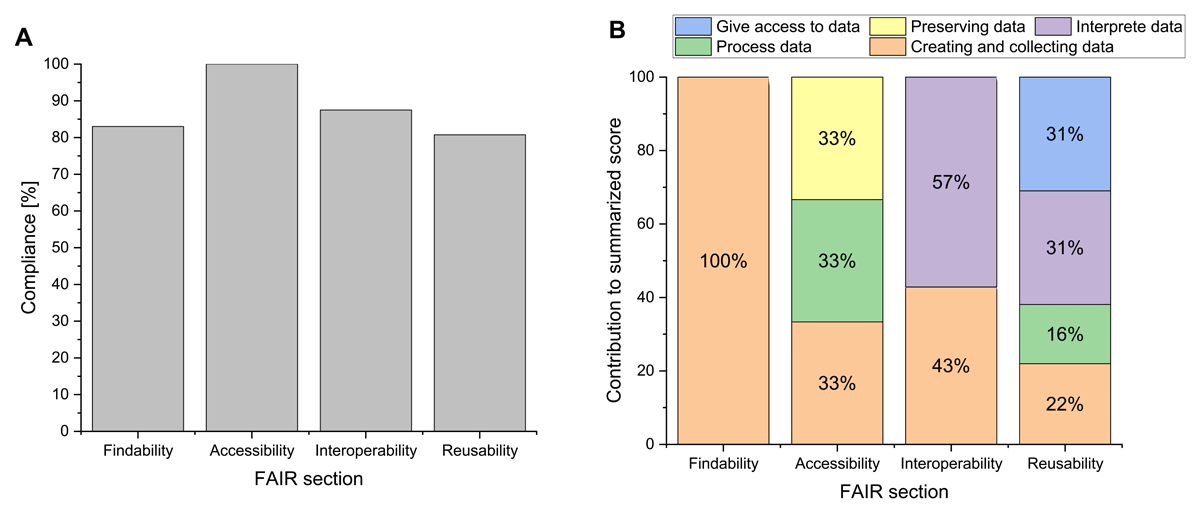
Figure 6
Result of DSW assessment for planned full workflow implementation. Summary report of the Data Stewardship Wizard software using the Common DSW Knowledge Model. The report displays the FAIR compliance score of the implemented IC workflow (A) and the contribution of the selected areas of the questionnaire to the individual scores (B) in case that the workflow is fully implemented.
Figure 6A shows that the average FAIR scores increase to at least 80% compliance in the planned full implementation. The maximum score achieved in this scenario is the accessibility section with 100% compliance and the minimum score is achieved by the reusability section with 81% compliance. Therefore, the difference, according to the DSW questionnaire, between the current workflow implementation and its full implementation is smaller (compared to the ARDC questionnaire) for the FAIR sectors findability (16% difference), accessibility (38% difference), interoperability (13% difference), and reusability (12% difference). The comparison of the current status with the expected final scores enables an assessment of the degree of implementation achieved to date. This is illustrated in Figure 7 by comparing the present implementation status (green area) with the full implementation (blue line). The raw data from both DSW assessments are linked as supplementary file number 3.
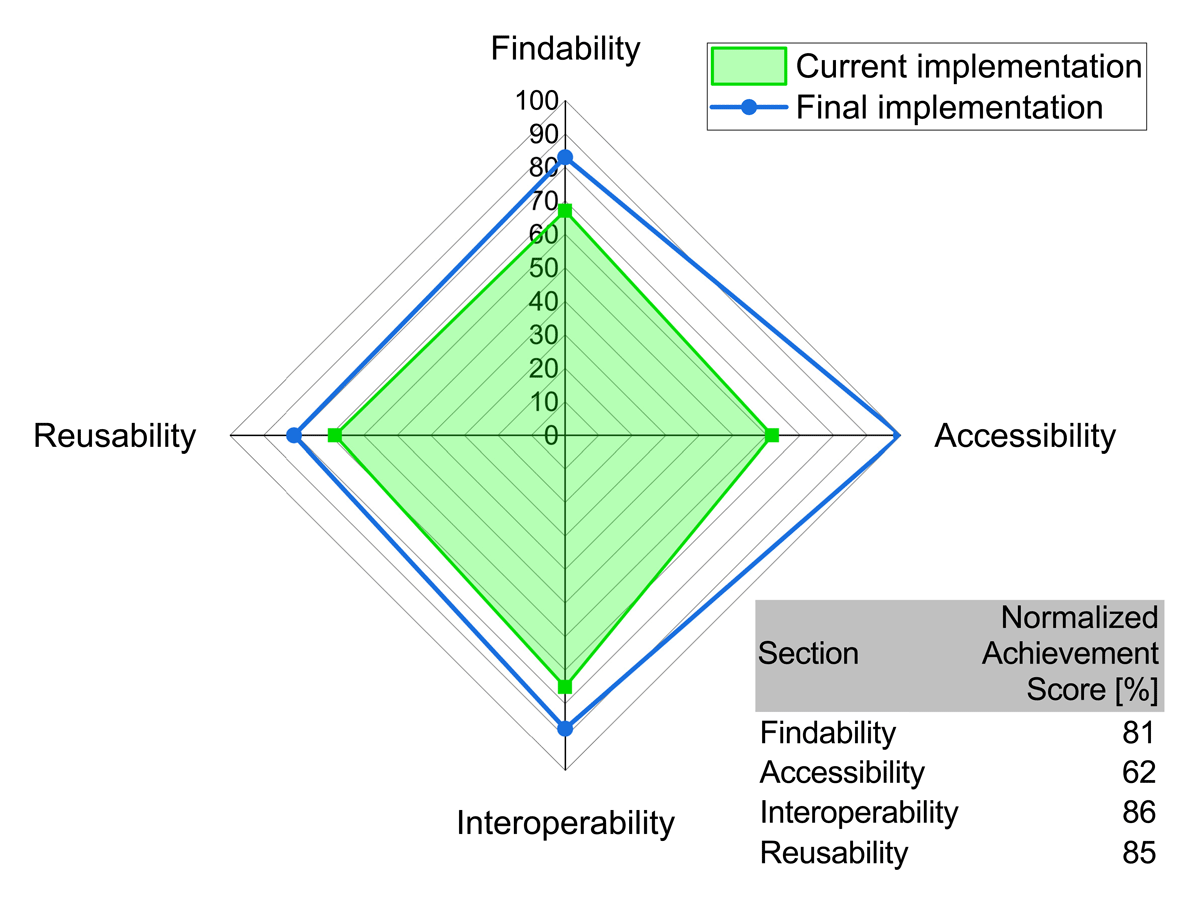
Figure 7
Degree of FAIR implementation according to the DSW assessment. Radar graph displaying the degree of FAIR implementation in the designed workflow. The blue line represents the maximum achievable score in the DSW Knowledge model for the planned full implementation. The green area indicates the scores currently achieved in this assessment. The table summarizes the normalized achievement for each FAIR section, whereas the 100% define the max. score from the full workflow implementation.
4. Discussion
4.1 Workflow integration in laboratories using IC
The degree of implementation to date serves mostly the metadata collection and focuses on the best possible findability and accessibility of data and metadata related to IC measurements. This is achieved through the introduction of a structured metadata collection using Adamant and designated metadata schemas. They provide users with the benefit that measurement methods can be compared more easily because the metadata collection is harmonized. The harmonization also enables a fundamental form of quality assurance, as parameters for quality assessment are collected. By regularly collecting and comparing these parameters, it is possible to make statements about the quality of the measurement results already during the measurement process. The evaluation of the quality parameters over the course of several measurements also enables an assessment of the condition of the consumables subject to wear. The recording of measurement-relevant metadata allows measurement regimes to be adapted more easily. In this case, time-consuming method development can be greatly reduced by exchanging the complete method-describing metadata. This not only optimizes the work process but also reduces unnecessary wear and tear on consumables. However, many user needs have not yet been met, since the workflow is still in the implementation phase. The integration of the recently completed ontology will bring greater benefits to users, since it lays the foundation for creating the GDB and applying data science methods. In the aquaculture example, one could analyze how changes to the plasma source (described by Plasma-MDS and Plasma-O) affect IC measurement data. Additionally, necessary configuration changes or shifts in the measurements (described by the harmonized IC metadata and semantically defined by the IC ontology) can be put in context to the plasma source changes.
In a first step, the workflow was built on the domain knowledge of analysts working in applied plasma research. As a result, more general details that are currently considered unimportant by users (or specialist knowledge unavailable to the current user group) may have been overlooked, introducing bias. Therefore, feedback from external users and IC-related companies was requested and incorporated into the finalization of the IC ontology. The workflow and research artifacts, including the updated metadata schemas and the IC ontology, are published in publicly accessible repositories to ensure proper reusability and to enable further feedback by the community. Additional feedback and collaboration with the scientific community will help to reduce existing bias and improve interoperability and reusability.
4.2 Comparison of the FAIR assessment tools and the results
The three conducted assessment methods differ fundamentally in the scope and type of evaluation. When reviewing the guiding principles (Section 3.1), only fulfillment or non (sufficient) fulfillment was tested. In contrast, the ARDC and DSW assessments (Sections 3.2 and 3.3) involved detailed questionnaires with different forms and scopes (ARDC 12 multiple choice questions, DSW over 200 multiple choice and free text questions). In the ARDC questionnaire, the scores of the individual answers are not visible, and therefore, there is less risk of bias during answering. In the DSW assessment, the evaluation scale for each answer is visible, which means that there is a greater chance of bias when filling out the questionnaire.
The differences in granularity between the ARDC and DSW questionnaires highlight different usage scenarios. While the ARDC assessment with its 12 questions can be completed very quickly, it only provides a rough overview of the current level of FAIR implementation. The ARDC assessment is therefore particularly suitable for early workflow implementation, as it provides a quick snapshot without requiring a significant investment of time. The very detailed DSW assessment is more suited to later workflow implementation. Thanks to its high level of granularity and specificity, it can help fine-tune the workflow to achieve the best possible FAIR implementation. From this perspective, however, it is also helpful to see which answers in the DSW assessment contribute to which score, as this supports the fine-tuning of the implementation. Krans et al. (Krans et al., 2022) carried out a more detailed analysis of the used tools, also in comparison to alternative tools. The comparison also included more complex tools such as FAIR shake (Clarke et al., 2019). The tool analysis resulted in a decision tree for users, indicating when each tool is feasible to apply. The decision tree regards three layers. First time investment followed by wide application and finally if the tool suggests improvements. According to Krans et al., the DSW and ARDC assessments require both low time investment. The difference lies in the range of application; the DSW assessment is not as widely applicable as the more general ARDC assessment.
While completing the structured FAIR assessments, we noticed how the focus of the FAIR assessment deviated. The similarity of the ARDC assessment to the FAIR guiding principles is obvious, as the questions in the ARDC assessment are based on them. In addition to FAIR compliances, the DSW assessment also evaluates compliance with various data management plans. The questions on the data management plans can also be hidden, but as they also include questions on the FAIR assessment, all possible questions were included for a large-scale assessment. The fact that the 100% marks were not achieved for most FAIR sectors in both assessments shows that the questionnaires were answered as truthfully as possible, also for the final implementation assessment. The results of the three assessments differ from one another due to the different focal points and their respective granularity. The review of the FAIR guiding principles shows complete fulfillment of the findability criteria and very good fulfillment of the accessibility criteria (three out of four criteria). The ARDC assessment is significantly worse with 75% fulfillment for findability, 20% for accessibility, and 35% for interoperability and reusability. The DSW assessment results in the best overall evaluation with 67% findability, 62% accessibility, 75% interoperability, and 69% reusability for the current implementation status. This is most likely due to the fact that each criterion is covered by a larger number of questions with respective gradings, thus enabling a very thorough evaluation.
4.3 Limitations of the current workflow implementation
The results of the FAIR assessments show that neither of the used tools confirms a FAIR compliance of 100% for the full workflow implementation. Alongside outlining the necessary steps to reach final implementation of the workflow, potential reasons for not attaining a 100% FAIR compliance are discussed below.
4.3.1 Findability
The findability criteria F1 to F4 are met, meaning that only the structured FAIR assessments require further additions. Necessary changes for improvements in this section include the more extensive use of public repositories, not only for metadata, but also for measurement data. The GDB (to be established in phase III of the implementation) is intended for internal data management on the institutional level. For scientific publications, the data is prepared for repositories using the metadata schemas, including elements of the DataCite metadata schema (DataCite Metadata Working Group, 2024). The preparation of measurement data for repositories is still relatively inconsistent, as the data is processed manually. A reproducible data evaluation workflow will be deployed as part of planned follow-up activities. The reason why 100% findability is not achieved in this section is the absence of the Dublin Core and Data Documentation Initiative (DDI) schemas. This outcome, however, is caused by specific questions used in the FAIR assessment tools. In reality, findability is not affected, since the essential Dublin Core metadata can be expressed through an official mapping from DataCite to Dublin Core.7
4.3.2 Accessibility
All three assessments require access to the metadata, also after deletion of the original measurements. This issue will be addressed by the future full separation (and the addition of crosslinks) of metadata and processed measurement data as a result of the GDB implementation. The current implementation separates measurement metadata (collected via Adamant and the IC metadata schemas) from the original measurement data (which are stored in the local LIMS at the device). The ELN contains the processed measurement data, the measurement metadata, and the processing descriptions. The only metadata that get lost after deletion of the original measurements are the device-specific metadata (e.g., the audit trail). However, deletions in the LIMS and in the ELN are not final, as system administrators can restore the deleted experiments from the respective internal databases. During further implementation, extraction of the audit trails and their attachment to the GDB is planned to also enable better provenance. One critical aspect regarding the accessibility of the carried out FAIR assessments, which should be considered for further implementation of the workflow, is the storage location of the data to be processed. Local data storage should be avoided if possible, and data backup must be considered to prevent data loss. Central data storage also allows general data organization structures to be introduced across the entire institute. The usage of central storage will speed up internal exchange and also facilitate access by linking the respective storage addresses in the GDB.
4.3.3 Interoperability
The three FAIR assessments are clear and demand the use of ontologies to ensure interoperability. A few ontologies are already in use, but some terms of the IC metadata schema are not yet sufficiently semantically described until the IC ontology is finalized. The two structured FAIR assessments evaluate the integration of already established ontologies with different weightings. In contrast to the comparison of the fulfillment of the guiding principles, a coarser statement on the status of interoperability is outlined. The criterion of FAIR principle-compliant vocabularies (I2 criterion) becomes more explicit in the structured FAIR assessment, as the use of data/variable dictionaries according to the FAIR cookbook8 or the use of minimal metadata standards is recommended.
For instance, the integration of the IC ontology and plasma ontology helps to improve interoperability. Only in this way interdisciplinarity can be achieved, as highlighted by the introductory example from the field of applied plasma research. Physicists describe their plasma sources using semantically (by using Plasma-O) enriched metadata (collected by Plasma-MDS). By extending the plasma ontology with the IC ontology, IC measurements of plasma-treated water can be more easily evaluated in the plasma context, as the fundamental semantic structures of the two ontologies are directly reused. Specifically, this allows a cause-and-effect analysis to be designed with the aid of the plasma knowledge graph.9 Changes to the plasma source (cause) result in a shift in the resulting ionic composition of plasma-treated water (effect). These analyses enable an optimization procedure for plasma sources based on interdisciplinary knowledge.
4.3.4 Reusability
In addition to the storage of metadata in open, structured, and long-term archivable formats, the storage of measurement data in such formats is also necessary for reusability according to all three FAIR assessments. The storage of the measurement data will be realized as part of the storage migration for the GDB integration and represents an important step for the reproducible data evaluation workflow. The licensing of the resulting measurement data will be addressed in the evaluation workflow, and so far, only the licensing of the metadata published in public repositories and the associated licenses is part of the FAIR data workflow. Another issue identified by the structured FAIR assessments is the lack of links between measurement data and the associated metadata. These will be introduced during the separate storage of measurement data and metadata to fulfill the accessibility requirements and will be prepared in a user-friendly way by the GDB. The previously insufficient provenance is a malus in all three FAIR assessments and will be realized at least at a basic level in the GDB, by using the entities and relationships from the IC ontology for edge and node definitions in ArangoDB. A complete provenance according to the World Wide Web Consortium (W3C) is not planned; however, integrating core elements from the PROV-O provenance ontology,10 such as prov:Activity, prov:Organization and prov:Plan, could contribute to enhanced FAIR compliance in the future.
5. Conclusions and Outlook
The implementation of the presented FAIR data workflow shows in general an increase in the FAIR compliance for all carried out FAIR assessments, as the FAIR compliance before implementation was close to zero in all sectors due to the highly individual and manual nature of the former research workflow. This shows that the successful implementation of the first phase already has a major influence on the FAIR compliance of the general IC data workflow. The further implementation is still ongoing, and all three assessments show a further potential increase in the overall FAIR compliance. The results of the already implemented workflow components and the upcoming implementation results will be shared in the respective communities to gather their feedback and provide the achievements to the target groups. The three assessments have their discrepancies (due to their different focuses), but by carrying out these assessments, an overview of potential areas for improvement is provided. Nevertheless, there is a rough roadmap of how the next steps are planned. The currently finalized IC ontology will be incorporated with other ontologies, such as Plasma-O, for finalizing the transition to the planned GDB implementation. The GDB will include not only IC measurement (meta-)data but also information about the scientists involved, the projects where the IC analyses were conducted, and other devices involved (e.g., plasma sources). Several GDBs can be used (Das et al., 2020). The chosen GDB for further implementation is ArangoDB due to the open licensing and positive experiences from the Plasma community, such as the LXCat project.11 The use of RDF as the basis for graph construction also enables the possibility of switching to a different GDB at a later date. This underlines the importance of structured data collection and the semantic description of the collected data, as this makes problems such as platform binding avoidable. As soon as the GDB is running, tools for better handling of the graph will be designed and provided. An automated data analysis pipeline, where the raw data and experiment-related metadata are analyzed together, is planned. This analysis pipeline shall determine the correct annotation of the peaks and their correct order in dependency of the used method and settings. This enables a reproducible and transparent evaluation of the correct ion composition and concentration of each involved ion. Implementing these steps is planned as the conclusion of the FAIR data workflow.
The presentation and provision of the research artifacts achieved, such as the designed metadata schemas, Python scripts, and subsequently also ontologies, should not only bring in feedback from the community, but also serve as a starting point for working groups with similar challenges.
Data Accessibility Statement
The mentioned metadata schemas for the ion chromatography workflow and example metadata sets are linked in a public GitHub repository at https://github.com/plasma-mds/LAMAS-4-IC.
The ion chromatography ontology IC-O is publicly available at the GitHub repository https://github.com/plasma-mds/ic-ontology.
The raw data resulting from the ARDC and DSW assessment are provided in tabular format as supplementary files number 2 and 3.
Supplementary Files
Supplementary File 1
IC-O to IC metadata schema mapping. The file contains a markdown table containing the IC metadata schema fields, their corresponding IC-O entities, and the example values from the provided data. DOI: https://doi.org/10.5334/dsj-2026-014.s1
Supplementary File 2
ARDC assessment raw data. Table containing raw data from the ARDC assessment. These were used to create Figures 3A, 3B and 4. DOI: https://doi.org/10.5334/dsj-2026-014.s2
Supplementary File 3
DSW assessment raw data. Table containing raw data from the DSW assessments. These were used to create Figures 5, 6, and 7. DOI: https://doi.org/10.5334/dsj-2026-014.s3
Notes
[1] https://github.com/plasma-mds/LAMAS-4-IC (last access 24.02.2026).
[2] https://github.com/protegeproject/ontograf (last access 24.02.2026).
[3] https://arango.ai/ (last access 24.02.2026).
[4] https://ardc.edu.au/resource/fair-data-self-assessment-tool/ (last access 24.02.2026).
[5] https://registry.ds-wizard.org/knowledge-models/dsw:root:2.6.10 (last access 24.02.2026).
[6] https://blockexplorer.bloxberg.org/ (last access 24.02.2026).
[7] https://schema.datacite.org/meta/kernel-4.4/doc/DataCite_DublinCore_Mapping.pdf (last access 24.02.2026).
[8] https://faircookbook.elixir-europe.org/content/home.html (last access 24.02.2026).
[9] https://vivo.plasma-mds.org/ (last access 24.02.2026).
[10] https://www.w3.org/TR/prov-o/ (last access 05.08.2025).
[11] https://www.plasma-mds.org/files/fdps2024_d2-e3_boer-vandijk.pdf (last access 24.02.2026).
Acknowledgements
The authors would like to thank Dr. Uta Schnabel, Dr. Marcel Schneider, Dr. Harald Below, and Martina Balazinski for fruitful discussions and feedback supporting the design and implementation of the ion chromatography workflow.
Competing Interests
The authors have no competing interests to declare.
Author Contributions
R.W. – conceptualization and methodology; R.W. – software and original draft preparation; M.M.B. – funding acquisition; R.H., D.W., K.Y. and M.M.B. – supervision; R.W., R.H., D.W., K.Y. and M.M.B. – writing, review, and editing.