
1. Introduction
A poly crisis is a complex, interconnected web of crises that spans across various domains—economic, environmental, social, and political (Ibrahim et al., 2025). Unlike a single crisis, poly crisis resists simple solutions and requires a holistic, multifaceted approach, whereas pulling on one thread affects the entire structure (Patton, 2024; McNamara and Bambra, 2025). In the context of the developed framework, a poly crisis is not just multiple crises happening simultaneously, it is crises interacting causally, creating cascading and unpredictable effects. The current global poly crisis is arguably the most significant issue, given key interconnected crises including climate change, biodiversity loss, economic inequality, the widening wealth inequality (fueling social unrest), geopolitical instability, food security, energy security, pandemic risk manifestation, and technological disruption, among others (Patton, 2024; Levin-Zamir, 2024; Favas et al., 2024; Nicoli and Zeitlin, 2024; McNamara and Bambra, 2025).
Considering details, climate change encompasses rising global temperatures, extreme weather events, sea-level rise, and resultant biodiversity loss. It acts as a threat multiplier, exacerbating existing inequalities and vulnerabilities. Biodiversity loss refers to the rapid decline in plant and animal species, which threatens ecosystem stability and human well-being by impacting food security, resource availability, and disease control. In addition, economic inequality refers to the widening gap between the rich and the poor; in many places it fuels social unrest and political instability and limits economic growth and development. Furthermore, geopolitical instability refers to international conflicts, rising nationalism, and the erosion of multilateralism, creating uncertainty, disrupting trade, and exacerbating humanitarian crises. On the other hand, food security because of climate change events, together with conflict and supply chain disruptions, is causing food shortages, price spikes, and malnutrition, especially in vulnerable populations. Geopolitical tensions, along with dependence on fossil fuels and climate concerns, drive energy price volatility and threaten energy access for many. Similarly, pandemics, such as the COVID-19 pandemic, highlighted vulnerabilities in global health systems and the interconnectedness of global supply chains. Thus, the potential for future pandemics remains a significant threat. In addition to technological disruption, the rapid technological advancements present opportunities but also pose threats and challenges related to job displacement, ethical considerations, and the spread of misinformation.
These crises are deeply interconnected. For example, climate change exacerbates food insecurity and drives migration, which in turn can fuel geopolitical instability. Economic inequality makes communities more vulnerable to the impacts of climate change and pandemics (Picanço Rodrigues et al., 2025). Addressing a poly crisis requires a fundamentally different approach than tackling individual crises in isolation. For example, governance must be (Zeitlin et al., 2019; Vito et al., 2024; Maalouf et al., 2025):
Holistic and Systems-Thinking Based: Recognizing the interconnectedness of crises and developing solutions that consider the broader impacts.
Adaptive and Flexible: Adopting strategies that can evolve and adapt as the situation changes. Rigid plans are unlikely to succeed.
Collaborative and multi-stakeholder driven: Bringing together governments, businesses, civil society, and individuals to work collaboratively.
Equity-Focused: Prioritizing the needs of the most vulnerable populations and ensuring that solutions address existing inequalities.
Long-Term Vision Centric: Moving beyond short-term fixes and focusing on building resilient and sustainable systems for the future. This includes addressing root causes, not just symptoms.
Data-Driven and Evidence-Based: Utilizing robust data and scientific evidence to inform decision-making and monitor progress.
Innovation and Technological Advancement Based: Leveraging technological advancements to develop innovative solutions across sectors.
Specific examples of governance strategies include investing in renewable energy, promoting sustainable agriculture, strengthening social safety nets, fostering international cooperation, and promoting global health security. The key is to develop a coordinated and integrated approach that tackles multiple crises simultaneously and builds resilience to future shocks. This requires significant changes in our economic, social, and political systems.
To this end, this work addresses several objectives: (a) to understand the role and raise awareness of open science, technologies (VR, AR), geoinformatics, and AI in times of poly crisis; (b) to provide a strategic framework and roadmap in times of poly crisis.
This study demonstrates how technology convergence can support governance in a poly crisis—a condition where multiple, heterogeneous crises (environmental, epidemiological, economic, social, and geopolitical) are entangled, interact through nonlinear feedback, and amplify one another. The framework proposed positions climate action as the central organizing principle for poly crisis management, moving beyond approaches that treat climate change as just one crisis among many.
The work demonstrates how converging AI, geoinformatics, VR, AR, and OS create an integrated capability stack where AI processes remote-sensing/geospatial data to map exposure and predict cascading impacts; geoinformatics provides spatial risk layers and decision support; VR simulates scenarios for policymaker training and public engagement; AR overlays real-time hazards and infrastructure status for in-field decisions; and OS enables interoperable data, reproducible pipelines, and rapid knowledge sharing. At the enterprise level, the framework introduces adaptation aligned with broader climate objectives, supported by measurable key performance indicators (KPIs) and scalable implementation strategies. Finally, the work extends the adaptive cycle theory beyond its ecological origins to poly crisis, indicating how integrated technology deployment can facilitate more effective transitions between crisis phases (exploitation, conservation, release, and reorganization) while building long-term climate resilience.
2. Literature Review
This section reviews recent studies that considered technology convergence to enhance climate action. Traditional research approaches often miss the systemic connections between different crisis domains. Open science (OS) practices, including data sharing, collaborative research networks, and interdisciplinary methodologies, enable researchers to map these interconnections more effectively (Ramachandran et al., 2021; Ibrahim et al., 2025). When climate data is openly shared with social scientists studying migration, or when biodiversity researchers collaborate with economists studying resource scarcity, we begin to see the full picture of how these crises reinforce each other. The urgency of poly crisis demands rapid scientific progress. Open access to research, preprint sharing, and collaborative platforms allow knowledge to flow more quickly between researchers and practitioners (Fecher and Friesike, 2014). The COVID-19 pandemic demonstrated how open science practices could compress research timelines from years to months (Ibrahim et al., 2025). Complex problems require diverse perspectives and innovative approaches. Open science fosters innovation by making research methods, data, and findings available for others to build upon, adapt, and apply in new contexts. This collaborative approach increases the likelihood of breakthrough solutions (Tuomi, 2013). However, open science faces significant obstacles in the poly crisis context. Commercial interests, national security and data sovereignty concerns, and competitive academic pressures can limit openness precisely when it is most needed (Micheli et al., 2022; Welsh et al., 2024; Ibrahim et al., 2024; Ibrahim et al., 2025). Additionally, the sheer volume of open data can create information overload, making it difficult to synthesize knowledge effectively.
Agentic AI systems are emerging as powerful tools for disaster management and emergency response, offering capabilities that can significantly enhance our ability to prepare for, respond to, and recover from various types of emergencies (Saltman, 2023; Sun et al., 2024; Zhao et al., 2024; Lugga, 2025; Pelletier et al., 2025; Hamid and Abedlmajid, 2025; Saengtabtim et al., 2025). Prediction and Early Warning, for example, is one area where agentic AI excels at processing vast amounts of environmental data from satellites, sensors, weather stations, and social media to identify patterns that may indicate impending disasters. These systems can autonomously monitor multiple data streams simultaneously, detecting anomalies that might signal earthquakes, floods, or severe weather events. They can generate early warning alerts and even initiate preliminary response protocols without waiting for human intervention, potentially saving crucial minutes or hours. During emergencies, Agentic AI can assist in making near real-time decisions about resource deployment, automatically coordinating the distribution of medical supplies, food, water, and rescue equipment based on evolving needs assessments. These systems can optimize supply chains, predict resource shortages, and autonomously redirect assets to areas of greatest need while considering factors like transportation routes, weather conditions, and population density. AI agents can analyze satellite imagery, drone footage, and sensor data to identify potential survivor locations, automatically directing search teams to high-probability areas. They can coordinate multiple rescue robots and drones, enabling them to work together autonomously in hazardous environments where human responders might be at risk. These systems can also process distress calls and social media posts to prioritize rescue operations. Agentic AI can manage information flow during chaotic emergencies, automatically translating messages across languages, filtering misinformation, and ensuring critical updates reach the right stakeholders. They can maintain communication networks by dynamically routing messages through available channels when traditional infrastructure fails (Ibrahim et al., 2024; Ibrahim et al., 2025). AI agents can assist with medical triage by analyzing patient symptoms and vital signs to prioritize treatment, automatically scheduling medical resources, and coordinating patient transfers between facilities. They can also monitor hospital capacity and predict medical supply needs across affected regions.
However, AI systems have some risks and limitations in the management of poly crisis (Saengtabtim et al., 2025; Ibrahim et al., 2025): AI systems often rely on historical data, which may become outdated or irrelevant during rapidly evolving, unprecedented crises. This can make AI-based predictions unreliable or even counterproductive in a poly crisis scenario. Overreliance on AI can lead to uniform, automated responses that amplify systemic risks and intensify the overall impact of crises, especially when human judgment is sidelined. AI can also contribute to one of the most pressing socio-ecological crises of our time—climate change—due to its massive consumption of energy and water, as well as high CO2 emissions (Ibrahim, Motshegwa and Ibraheem, 2025; International Science Council, 2025). AI (e.g., generative AI) may be used to generate misinformation about climate change, undermining the public’s understanding of the crises it contributes to. While there is very good interplay of OS and AI, OS and AI can lead to misuse, such as the spread of invalidated or false information, increased pressure to publish, and potential exploitation or misappropriation of ideas (The Royal Society, 2024; Ibrahim et al., 2024; Zhao et al., 2024; Ibrahim et al., 2025; International Science Council, 2025).
The intersection of AI and poly crisis creates unique governance dilemmas and the need for systems thinking. In this regard, addressing AI’s role in poly crisis requires recognizing that policymakers must work to change system structures that generate such hazards. This means developing governance frameworks requiring unprecedented levels of international coordination and systemic thinking that can handle the interconnected nature of AI-related risks while harnessing AI’s potential to address global challenges.
Geoinformatics, including geographic information systems, remote sensing, and spatial data analysis, play a crucial role in managing poly crisis by providing spatial insights and decision support across all crisis phases (Ibrahim and Elramly, 2016; Ibrahim and Elramly, 2017a; Ibrahim and Elramly, 2017b).
Table 1 presents the role of geoinformatics in the management of poly crisis based on Agenda 2063 and Sustainable Development Goals (UNEP, 2016; Mundial, 2012; WHO, 2020; Ibrahim et al., 2020; Ibrahim et al., 2024; Ibrahim et al., 2025). Geoinformatics is essential for understanding, preparing for, and responding to the spatial complexity of poly crisis, making crisis management more effective and resilient (Ibrahim et al., 2019; Taha and Ibrahim, 2021; Taha and Ibrahim, 2022; Taha et al., 2023; Taha et al., 2024a; Taha et al., 2024b). It enhances situational awareness and rapid response, improves risk communication among stakeholders, and facilitates data-driven, coordinated crisis management strategies (Ibrahim, Hassan, and Motshegwa 2025).
Table 1
Role of geoinformatics and remote sensing in the management of poly crisis.
| ITEM | AU AGENDA 2063 | ROLE OF GEOINFORMATICS AND REMOTE SENSING | SDG |
|---|---|---|---|
| Risk Assessment & Hazard Mapping | -‘Environmentally sustainable and climate resilient economies and communities’. -‘Modern, affordable and liveable habitats’. | -Maps and models spatial threats (e.g., floods, wildfires), -Help identify, visualize, and analyze vulnerable areas and populations. | SDG 11 – ‘Sustainable Cities and Communities’ |
| Early Warning & Real-Time Monitoring | -‘World-class infrastructure crisis – crosses Africa’. -‘Climate resilience and natural disasters preparedness’. | -Integrates data from satellites, drones, sensors, and social media to provide timely alerts and situational awareness for fast-moving crises. This supports rapid decision-making, resource allocation, and coordination among agencies during complex emergencies. | SDG 13 – ‘Climate Action’ |
| Resource Allocation & Coordination | ‘Environmentally sustainable and climate resilient economies and communities’. | -Supports efficient deployment of emergency resources, evacuation planning, and inter-agency coordination using real-time, interactive maps. | SDG 12 – ‘Responsible Consumption and Production’. |
| Impact Assessment & Recovery | ‘World-class infrastructure crisis – crosses Africa’. | -Assesses damage, monitors recovery, and supports long-term planning by analyzing post-crisis spatial data. | SDG 3 – ‘Good Health and Well-being’ |
| Scenario Modeling & Decision Support | -‘Environmentally sustainable and climate resilient economies and communities’. -‘Climate resilience and natural disasters preparedness’. | -Enables scenario analysis and predictive modeling, often integrating with AI, to inform policy and operational decisions during complex, overlapping crises. | SDG 15 – ‘Life on Land’. SDG 11 – ‘Sustainable Cities and Communities’ |
Effectively using AI and geoinformatics requires robust, interoperable, and FAIR data systems (Schultes, 2023). The lack of standardized, high-quality, and accessible data across sectors hampers evidence-based decision-making and limits the potential of these technologies (Sun et al., 2024; Ibrahim et al., 2024; Ibrahim, Motshegwa, and Ibraheem, 2025).
Virtual reality (VR) is transforming disaster management and emergency response by providing immersive, safe environments for training, planning, and coordination (Hou 2021; Lin 2020; Zhang et al., 2024; Virtual Reality Society, 2025). This technology can be incredibly useful in several ways during poly crisis, for example, as follows.
Training, preparedness, and emergency response: VR can simulate disaster scenarios, allowing emergency responders to practice and improve their skills in a safe environment. This can be crucial in preparing for real-world crises (Peng et al., 2020). For instance, citizens can experience earthquake simulations, practice evacuation procedures, or learn how to respond to various emergencies in engaging, memorable ways. This immersive training helps people understand risks and remember appropriate responses while allowing trainees to experience rare or extremely dangerous situations (Pan, 2021). Doctors and nurses can use VR to practice complex procedures, ensuring they are ready to handle medical emergencies effectively (Huff et al., 2010; Ruse et al., 2014; Peng et al., 2020; Babus et al., 2024).
Pre-Disaster Planning and Risk Assessment: Emergency planners can use VR to visualize potential disaster scenarios and their impacts on communities. By creating 3D models of cities, infrastructure, and vulnerable populations, planners can better understand evacuation routes, identify bottlenecks, and optimize resource allocation (Kavakli, 2006). VR also enables stakeholders to “walk through” emergency plans virtually, testing different response strategies and identifying potential problems before they occur in real disasters. VR enables remote assessment of disaster areas when physical access is dangerous or impossible. Drone-captured imagery can be processed into virtual environments, allowing experts to assess damage, identify hazards, and plan response operations from safe locations (Li et al., 2022; Xu et al., 2024). This capability is particularly valuable for situations involving hazardous materials, unstable structures, or ongoing threats. Post-Disaster Analysis and Learning: After disasters, teams can virtually revisit critical moments, examine decision points, and identify lessons learned. This review process often reveals insights that traditional methods might miss.
While VR offers significant advantages, challenges remain, including high initial costs, the need for technical expertise, and the potential for motion sickness. However, as technology becomes more accessible and sophisticated, its role in disaster management is likely to expand, ultimately saving lives through better preparation and more effective response.
Augmented reality (AR) overlays digital information onto the real world, enhancing the users’ perception and interaction with their environment (Pan, 2021). AR can play a significant role in managing poly crisis, for example, as follows.
Pre-Disaster Planning, Preparedness, and Real-Time Situational Awareness. AR enhances disaster preparedness by enabling immersive training simulations for emergency responders (Merlhiot and Yousfi, 2024). Emergency vehicles and personnel can follow optimal routes that account for real-time road conditions, debris, flooding, or other obstacles. AR systems can dynamically update routing based on changing conditions and guide responders to specific locations using visual waypoints and directional indicators (Valizadeh et al., 2024).
AR can enhance communication during a crisis by overlaying visual aids onto physical objects or environments. This can be particularly useful in medical settings, where AR can provide detailed anatomical information during surgeries (Xu et al., 2024). AR can enable remote experts to guide local responders in real-time, providing step-by-step instructions and visual cues (Rasmussen et al., 2022).
Emergency Response: AR can guide non-medical personnel through basic first aid procedures with visual step-by-step instructions (Wickens et al., 2023). AR can be used to broadcast public safety alerts, ensuring that everyone in an affected area receives timely and accurate information (Rowen et al., 2019; Xu et al., 2024). AR facilitates improved coordination between different response agencies by providing shared visual information. Incident commanders can visualize resource deployment, track team locations, and communicate tactical information through shared AR environments (Xu et al., 2024). This reduces communication delays and misunderstandings that can occur with traditional radio or text-based systems.
Disaster Management, Search and Rescue Operations: AR can assist in monitoring and managing disasters, providing real-time data on earthquake activity, flood levels, or wildfire spread. AR significantly enhances search and rescue capabilities by overlaying thermal imaging data, structural analysis, and personnel locations onto rescuers’ visual fields. Teams can see through debris to locate survivors, visualize safe pathways through damaged structures, and coordinate with other teams by sharing real-time positional data. AR can also help identify potential hazards like gas leaks or unstable structures that might not be immediately visible. Despite its potential, AR in disaster management faces several challenges. Technical limitations include power and battery life, processing computing power, and network connectivity in disaster-affected areas. Environmental factors like extreme weather, dust, or lighting conditions can affect AR system performance.
Ensuring that VR and AR systems can communicate with each other and with other technologies, such as IoT devices and cloud services, is also key. This will enable seamless data exchange and collaboration (Kim et al., 2017). Providing comprehensive training for users, including first responders, medical professionals, and the general public, is also essential. This will ensure that everyone can effectively use mixed reality tools during a crisis (Schild and Carbonell, 2022). Implementing robust security measures to protect sensitive data and ensure the privacy of users is critical. This is particularly important in a poly crisis, where information can be critical and vulnerable to misuse (Cheng, 2024). Designing mixed reality systems to be scalable, allowing them to handle increased demand during a crisis, should be central. This includes ensuring that infrastructure can support a large number of users and devices (Wright et al., 2020). Continuously gathering feedback from users and stakeholders to improve VR and AR tools is also key. This will help in identifying areas for enhancement and ensuring that the technologies remain effective and relevant (Yoo and Bruns 2004).
Accordingly, the convergence of AI, geoinformatics, VR, AR, and OS creates synergistic capabilities that exceed individual technology applications for climate action during poly crisis. AI algorithms process geospatial climate data to identify emission hotspots and predict cascading climate impacts, while VR simulates these scenarios for policymaker training and public engagement. AR overlays real-time climate data onto physical environments, enabling communities to visualize local temperature changes, flood risks, and renewable energy potential directly in their landscapes. OS frameworks ensure climate data flows freely between technologies, allowing rapid integration of new climate observations into predictive models. Geopolitical tensions, conflicts, and sanctions can disrupt global scientific cooperation, restrict data sharing, and limit access to research infrastructure, making it harder to address transboundary crises collectively (Charpin et al., 2024; Shih et al., 2024).
Economic shocks and resource shortages during poly crisis periods can reduce funding for research, hinder access to technology, and exacerbate inequalities between institutions and regions (Eggers 2020; Ivanov and Dolgui, 2022). Socioeconomic disparities are magnified in times of crisis, risking exclusion of less-resourced communities from open science initiatives and access to digital tools (Zaki et al., 2022; Ibrahim et al., 2025). The non-linear, emergent nature of poly crisis challenges traditional research and policy approaches, demanding more flexible, systems-based methods and rapid adaptation of technologies and practices (Mathias et al., 2020).
3. Contribution to Theory
This work considers the question of how the convergence of AI, geoinformatics, VR, AR, and open science creates synergistic capabilities that exceed individual technology applications for climate action during poly crisis. It addresses this question by first reviewing key contributions to the poly crisis domain. The work developed an assessment framework for managing poly crisis and extended adaptive cycle theory beyond its ecological origins to poly crisis contexts, revealing how integrated technology deployment can facilitate more effective transitions between crisis phases while building long-term climate resilience.
In this work, AI systems are considered regarding processing geospatial climate data to identify emission hotspots and predict cascading climate impacts, while VR simulates these scenarios for policymaker training and public engagement. AR overlays real-time climate data onto physical environments, enabling communities to visualize local temperature changes, flood risks, and renewable energy potential directly in their landscapes. OS frameworks ensure climate data flows freely between technologies, allowing rapid integration of new climate observations into predictive models. Additionally, the work proposes future research directions to guide the development of poly crisis solutions.
4. Theoretical Foundation
No conceptual schema can fully capture the intricate causal, spatial, and temporal features of specific global crises as highlighted by Lawrence et al. (2024). Adaptive cycle theory is a conceptual model used to understand how complex systems, like ecosystems, societies, or economies, change over time. It describes a recurring sequence of four phases that systems typically pass through, highlighting both periods of stability and times of rapid change or crisis. This study employed this theory to set out an action framework (Table 2) that can be taken up by the poly crisis community for resilience in times of poly crisis. This work extends adaptive cycle theory beyond its ecological origins to poly crisis contexts, revealing how integrated technology deployment can facilitate more effective transitions between crisis phases while building long-term climate resilience (Sundstrom and Allen, 2019; Castell and Schrenk, 2020; Fiorentino et al., 2020; Porak and Reinke, 2024). Adaptive cycle theory provides a valuable framework for understanding how disasters unfold and how communities can build resilience into their emergency management strategies. This theory describes how systems move through four distinct phases in recurring cycles (Sundstrom and Allen, 2019; Castell and Schrenk, 2020). The four phases are particularly relevant to disaster contexts. The growth phase represents normal community development, where infrastructure expands and social systems strengthen. During this phase, communities often become more efficient but potentially less flexible. The conservation phase shows a mature, stable system that may have accumulated vulnerabilities, for example, a case of well-established communities with aging infrastructure or rigid response protocols. The release phase corresponds to the disaster itself, when existing structures and systems break down rapidly. This creative destruction, while often painful, creates space for innovation and change. Finally, the reorganization phase represents the post-disaster period when communities rebuild, often incorporating new approaches, technologies, or governance structures that make them more resilient.
Table 2
Key components of an effective structure for resilience.
| COMPONENT | DESCRIPTION |
|---|---|
| Structure | Clear committees, reporting lines, mandates, and terms of reference that adapt existing governance frameworks to oversee resilience. |
| Roles & Responsibilities | Defined roles from board to operational teams, with clear accountability for resilience activities and decision-making. |
| People & Culture | A culture of resilience, driven by leadership, with training and awareness at all levels to embed resilient behaviors and values. |
| Enabling Processes | Policies, procedures, and information systems that support decision-making, monitoring, and continuous improvement in resilience. |
| Subject Matter Expertise | Inclusion of relevant expertise (e.g., risk, technology, operations, compliance) to inform and guide resilience strategies. |
| Stakeholder Engagement | Mechanisms for engaging internal and external stakeholders to foster trust, transparency, and coordinated response. |
| Continuous Evaluation | Regular assessment, reporting, and adaptation of governance and resilience plans to ensure effectiveness and relevance. |
This framework helps emergency managers understand that disasters are not just disruptive events to recover from but opportunities for adaptive transformation. Communities can use the reorganization phase to address underlying vulnerabilities and build adaptive capacity. Emergency planners increasingly use this perspective to design interventions that work with natural cycles rather than against them, focusing on building adaptive capacity that allows communities to learn and evolve through their disaster experiences. The theory emphasizes several key insights for practice. It highlights the importance of maintaining flexibility and diversity in emergency response systems. It also suggests that some degree of periodic disturbance may strengthen long-term resilience by preventing the accumulation of vulnerabilities.
This framework was adapted from general adaptive cycle theory to specifically address climate-driven poly crisis, recognizing that climate change serves as both a direct crisis and a threat multiplier that exacerbates interconnected global challenges. Each strategic component integrates climate considerations: risk mapping emphasizes climate-related cascading effects, adaptive business models prioritize low-carbon transitions, and technology investments focus on climate monitoring and mitigation tools.
However, the framework faces inherent limitations in addressing climate poly crisis. For example, the emphasis on business resilience may inadvertently prioritize organizational survival over the systemic changes required for climate stabilization, potentially enabling continued high-carbon operations under the guise of ‘resilience’. The framework’s focus on adaptation and flexibility, while necessary, risks accepting climate impacts as inevitable rather than emphasizing urgent mitigation actions that could prevent the most catastrophic scenarios. Additionally, the individual enterprise focus may fragment climate responses; when coordinated, sector-wide transformation is essential for achieving the scale and speed of decarburization required to address the climate crisis effectively (Ibrahim, Motshegwa and Ibraheem, 2025).
5. Methodology
This study employs a climate-centric technology convergence assessment framework to evaluate how emerging technologies synergistically address poly crisis challenges, specifically for climate action outcomes. This study demonstrates how technology convergence can aid poly crisis management. This framework positions climate action as the central organizing principle for poly crisis management, moving beyond existing approaches that treat climate change as merely one crisis among many. It uses multifaceted techniques, including structured review, conceptual analysis, and technology convergence assessment analysis, as explained in the following sections.
5.1 Data extraction criteria
Bibliometric and semantic analyses were conducted on both the full retrieved dataset (n = 346) for temporal trends and the quality-filtered subset (n = 109) for content analysis, ensuring comprehensive coverage while maintaining analytical rigor. Structured review is used to identify the current gaps and challenges in poly crisis situations, raise awareness of the abovementioned technologies, and achieve sustainable governance in poly crisis situations. A comprehensive climate-focused literature review (Figure 1) was conducted examining academic papers and publications through IEEE Xplore, ScienceDirect, Scopus, and Web of Science via the Egyptian Knowledge Bank (https://int.ekb.eg/index-en.html). The search strategy employed Boolean operators to identify publications containing ‘poly crisis’ AND ‘climate action’ AND (‘virtual reality’ OR ‘open science’ OR ‘augmented reality’ OR ‘AI’ OR ‘geoinformatics’ OR ‘resilience’ OR ‘governance’) in titles, abstracts, or keywords. Publications were limited to the timeframe 2011–2026, with 2011 selected as the initial boundary following the emergence of systematic climate technology research documented by Brent et al. (2011). Inclusion Criteria: Studies were included if they demonstrated direct applications of emerging technologies for climate change mitigation, adaptation, or resilience building during crisis scenarios. Publications required empirical evidence or theoretical frameworks linking technology convergence to measurable climate outcomes rather than general disaster management applications.
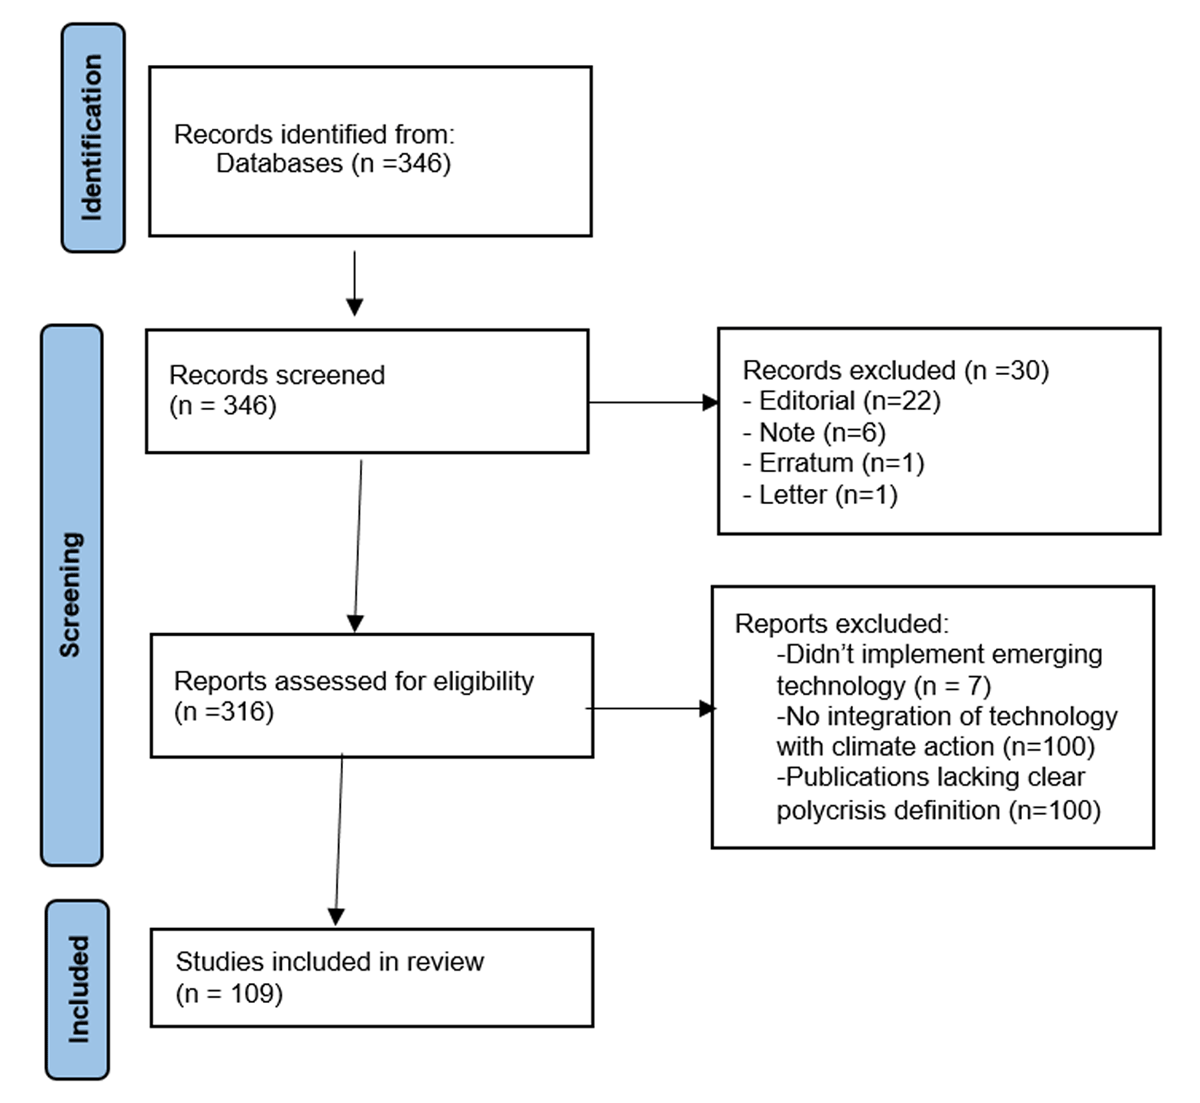
Figure 1
Identification criteria of studies.
Exclusion Criteria: Studies focusing solely on single-technology applications without climate action integration, publications lacking clear poly crisis definitions, and research addressing general resilience without specific climate change contexts were excluded from the analysis.
5.2 Datasets
To achieve the required accuracy of the results of this study, this research used a variety of geospatial and climatic data obtained from different sources. Thus, two kinds of Sentinel-1 satellite images were incorporated: the Ground Range Detected (GRD) data captured in the period between 2014 and 2024, processed via GEE, and Single Look Complex (SLC) data covering the period between November and December 2020, processed using the Sentinel Application Platform. Both datasets were obtained from https://dataspace.copernicus.eu/. On the other hand, the historical topographic maps collected from www.davidrumsey.com, were used to build the geodatabase of the wadies and sub-wadies over the study area. Along with the station data of the Climate Hazards Group InfraRed Precipitation (CHIRPS) dataset with monthly medium values, the quasi-global rainfall dataset covered the time serious satellite data from 1981 till near-present, extracted with 0.05° resolution (https://doi.org/10.15780/G2JQ0P). Also, the TRMM data (https://gpm.nasa.gov/missions/trmm) was used to provide the precipitation values obtained from multi-space-borne instruments, clearing the interactions between clouds, water vapor, and precipitation accessible via the USGS and NASA, and processed in ArcMap. While the elevation data were obtained from the SRTM with both 1 arc-second and 3 arc-second resolutions (https://earthexplorer.usgs.gov/). The input data were analyzed using the integration between the ArcMap software and the Sentinel Application Platform (SNAP). The datasets used in this study are synthetic outputs generated from implementing the Technology Convergence Assessment Framework. These datasets are operationally grounded, meaning they are not arbitrary simulations; rather, they are structured performance logs produced by executing the framework under controlled pilot scenarios and/or event-driven operational conditions.
The framework ingests and integrates multi-source data streams to emulate realistic poly crisis monitoring and response environments. The integrated data sources include:
Geospatial data: satellite imagery and vector layers.
Sensor and event data: timestamped streams of alerts, observed events, and decision actions, as reflected in the event logging tables.
AI model outputs: predicted probabilities of hazards or events, including calibrated risk scores used for reliability and discrimination evaluation.
Operational performance logs: key operational indicators such as alert lead times, decision cycle durations, allocation success rates, and system error records.
Social and equity indicators: coverage, participation, or vulnerability-weighted benefit metrics segmented by neighborhood or demographic group.
To evaluate the framework, results are produced under two operational modes that enable a direct comparative assessment:
Baseline mode: a conventional response system based on manual decision-making or legacy rule-based procedures.
Platform mode: an integrated AI + geoinformatics + decision intelligence system implementing the proposed framework. The platform architecture and implementation details are grounded in prior work (Ibrahim and Elramly, 2017a; Ibrahim and Elramly, 2017b; Ibrahim and Elramly, 2016).
The evaluation is performed using synthetic crisis scenarios, such as flood warnings, urban heat events, or system disruption cases. In each scenario, the framework generates a structured event record including (a) an issued alert, (b) a decision cycle (start–end timestamps), (c) resource allocation actions and deployment logs, and (d) an outcome label, indicating whether the event was successfully managed, a false alarm occurred, or the event was missed.
5.3 Poly crisis Technology Convergence Assessment Framework
The Poly crisis Technology Convergence Assessment Framework is a methodological construct designed to systematically analyze how multiple emerging technologies—namely AI, geoinformatics, VR, AR, and decision intelligence—can be integrated and evaluated collectively to manage complex, cascading crisis environments centered on climate action.
The framework is:
A structured method for problem scoping, system design, deployment, and evaluation.
A decision-support methodology that generates measurable outputs (KPIs, logs, performance metrics), which are then analyzed and reported as results in Section 6.1.
The primary goals of the technology convergence assessment framework are as introduced, namely to (a) improve situational awareness during a poly crisis, (b) enable better risk assessment and early warning systems, (c) support more effective decision-making and resource allocation, (d) facilitate communication and collaboration among stakeholders, and (f) enhance public understanding and engagement.
Data architecture and analytics were implemented using a layered capability stack, as shown in Figure 2. Table 3 outlines the steps involved in using the framework to assess and respond to poly crisis. Details of the architecture can be found in Ibrahim and Elramly (2017a) and Ibrahim and Elramly (2017b).
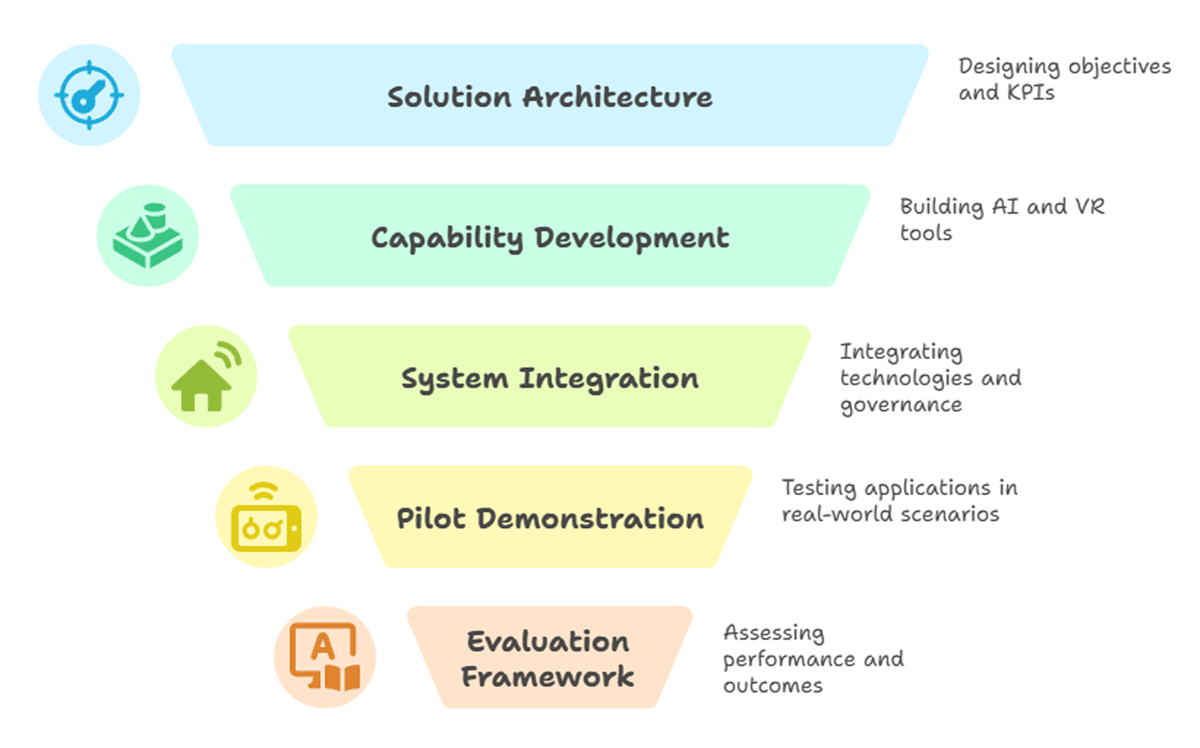
Figure 2
Poly crisis technology convergence model.
Table 3
Technology convergence assessment framework for poly crisis.
| PROBLEM IDENTIFICATION AND SCOPING | |
| Poly crisis Context Definition: -Map cross-domain interdependencies between climates, social, economic, and governance systems. -Identify cascading risk pathways and feedback loops. -Establish system boundaries and scope of intervention. | Stakeholder Analysis: -Identify key actors across sectors and scales. -Define roles and responsibilities in poly crisis governance. -Map information needs and decision-making processes. |
| SOLUTION ARCHITECTURE AND OBJECTIVES | |
| Performance Objectives and KPIs: -Climate Action Metrics: Avoided emissions, carbon sequestration rates, and renewable energy adoption. -Resilience Indicators: Exposure reduction, vulnerability indices, adaptive capacity measures. -Operational Metrics: Time-to-alert, recovery duration, service uptime, system availability. -Social Impact Metrics: Engagement rates, equity Co-benefits, community participation levels. -Economic Metrics: Climate risk-adjusted ROI, cost-benefit ratios, damage avoidance. | Decision Thresholds and Success Criteria: -Define trigger points for interventions. -Establish acceptable risk levels and tolerance bands. -Set performance benchmarks for each system component. |
| INTEGRATED CAPABILITY STACK DEVELOPMENT | |
| AI Layer Architecture: -Data Fusion Module: Integration of remote sensing, geospatial, and socioeconomic datasets. -Predictive Analytics: Machine learning models for cascading impact forecasting. -Pattern Recognition: Anomaly detection and early warning systems. | Geoinformatics Layer: -Spatial Risk Surfaces: Multi-hazard vulnerability mapping. -Dependency Graphs: Infrastructure and system interdependency modeling. -Decision Layers: Optimized resource allocation and intervention planning. |
| VR Module Development: -Immersive Training Scenarios: Policy rehearsal environments for decision-makers. -Crisis Simulation: Multi-stakeholder coordination exercises. -Public Engagement Tools: Community awareness and preparedness programs. | AR Module Implementation: -Field Overlays: Real-time hazard visualization and navigation. -Infrastructure Status: Asset condition and service disruption indicators. -Operational Guidance: Context-aware decision support for responders. |
| Governance and Ethics Framework: -Data Stewardship: Privacy protection and consent management. -Security Protocols: Cybersecurity measures and access controls. -Sustainability Monitoring: Energy consumption and carbon footprint tracking. -Ethical Guidelines: Bias mitigation and fairness assurance | |
| SYSTEM INTEGRATION AND DOCUMENTATION | |
| Technical Integration: -API development and standardization. -Shared schema design and data interoperability. -Micro-services architecture implementation. -Real-time data pipeline construction. | Open Science Documentation: -Code repositories with version control. -Data dictionaries and metadata standards. -Containerized deployment packages. -Technical documentation and user guides. |
| PILOT DEMONSTRATION | |
| VR-Based Applications: -Policy Rehearsal: Scenario-based decision-making exercises. -Public Engagement: Community consultation and feedback sessions. -Training Programs: Capacity building for stakeholders. | AR Field Deployment: -Operational Decision Support: Real-time guidance during events. -Situational Awareness: Enhanced field intelligence. -Resource Coordination: Multi-agency collaboration tools. |
| Dashboard Implementation: -Cross-Agency Coordination: Unified operational picture. -Performance Monitoring: Real-time KPI tracking. -Decision Audit Trail: Documentation of actions and outcomes. | |
| EVALUATION FRAMEWORK | |
| Technical Performance Metrics: -Model Accuracy: AUC, F1 scores, precision-recall curves. -Calibration Quality: Reliability diagrams, calibration plots. -Forecast Lead Time: Early warning system effectiveness. | Decision Quality Assessment: -Process Efficiency: Time-to-decision, decision cycle duration. -Resource Allocation: Accuracy and optimization of deployments. -Error Rates: False alarm and miss detection frequencies. |
| Resilience Outcome Measurement: -Baseline Shifts: Changes in vulnerability indicators. -Recovery Metrics: Time to restoration, bounce-back capacity. -Exposure Reduction: Population and asset protection levels. | Human Factors Analysis: -Usability Assessment: System Usability Scale (SUS) scores. -Training Effectiveness: Pre/post competency evaluations. -Adoption Metrics: User engagement and retention rates. |
| Equity and Ethics Evaluation: -Benefit Distribution: Spatial and demographic equity analysis. -Privacy Compliance: GDPR and data protection adherence. -Accessibility: Universal design compliance. | Sustainability Assessment: -Energy Footprint: Computational and device energy consumption. -Climate Cost-Benefit: Net emissions impact analysis. -Resource Efficiency: Optimization of system operations. |
| ADAPTIVE MANAGEMENT AND SCALING | |
| Adaptive Cycle Monitoring: -Phase Indicators: Metrics for exploitation, conservation, release, and reorganization stages. -Transition Triggers: Thresholds for phase shift detection. -System Resilience: Capacity for transformation and renewal. | Iterative Improvement: -Model Updates: Continuous learning and retraining protocols. -Data Refresh: Regular dataset updates and quality assurance. -Content Evolution: Training scenario and tool refinement. |
| Scaling Strategy: -Pilot to Portfolio: Phased expansion from demonstration to full deployment. -Geographic Scaling: Replication across regions and contexts. -Sectoral Integration: Cross-domain application and adaptation. | |
Performance objectives were organized into five KPI families: (i) Climate action (avoided emissions, carbon sequestration rates, renewable adoption), (ii) resilience (exposure reduction, vulnerability indices, adaptive capacity), (iii) operations (time-to-alert, recovery duration, service uptime, availability), (iv) social impact (engagement, equity co-benefits, community participation), and (v) economics (risk-adjusted ROI, cost–benefit, damage avoidance).
Decision thresholds were specified as trigger points for interventions with acceptable risk tolerances and component-level benchmarks to support timely activation, escalation, and de-escalation.
Regarding the AI layer, a data-fusion module integrated remote sensing, geospatial, and socio-economic sources. Predictive analytics (supervised and sequence models) estimated cascading impacts, and anomaly detection supported early warnings. Model development included calibration, reliability assessment, uncertainty reporting, and bias screening and fairness constraints were applied where applicable.
Regarding the geoinformatics layer, spatial risk surfaces captured multi-hazard vulnerability; dependency graphs modeled infrastructure and systemic interdependencies; and decision layers supported optimized allocation and intervention planning under constraints.
An immersive VR and AR module was provided to make educational materials to visualize complex data intuitively and engagingly, allowing users to explore different scenarios and understand the potential impacts of crises, and as a context-aware operational guidance for responders (Kočkár et al., 2023).
Governance, ethics, and sustainability include data stewardship procedures, enforced privacy, consent management, and security controls (role-based access, encrypted transport/storage, audit trails) that were implemented. Sustainability was tracked via computer/device energy use and carbon footprint, and ethical guidelines focused on bias mitigation and equitable benefit distribution.
Microservices architecture exposed standardized application programming interfaces (APIs) and shared schemas to ensure interoperability. Real-time data pipelines supported streaming ingestion and event processing. Open-science practices included version-controlled code repositories and containerized deployment artifacts.
Evaluation followed six domains: technical performance (F1, precision–recall, calibration, lead time), decision quality (time-to-decision, cycle duration, allocation accuracy, error rates), resilience outcomes (baseline shifts in vulnerability, recovery timelines, exposure reduction) (Falconbridge et al., 2022; Levin-Zamir, 2024), human factors (SUS usability, training gains, adoption/retention), equity & ethics (spatial/demographic equity, privacy compliance, accessibility), and sustainability (energy footprint, net emissions impact, resource efficiency). Adaptive management monitored system phases (exploitation, conservation, release, reorganization), supported model/data refresh cycles, and guided scaling from pilots to broader portfolios across regions and sectors.
5.4 Semantic network analysis
The semantic network visualizations (van Eck and Waltman, 2010) were created through VOSviewer 1.6.2, which used text mining and co-occurrence analysis to generate results through its binary counting method. The research required a minimum term frequency threshold, which established five occurrences as the basic requirement, and researchers applied default resolution settings to standardize association strength measurements. The smart local moving algorithm executed ten clustering iterations with ten different random starting points, ensuring that research results could be replicated through seed 0. The minimum cluster size requirement restricted clusters to five nodes. The analysis of the corpus required processing through TF-IDF vectorization, which removed English stop words and applied the Porter Stemmer algorithm for term stemming. Network semantic distances display normalized co-occurrence strengths, which utilize proximity measurements to determine contextual associations. These distances are visualized through the Visualization of Similarities (VoS) technique, employing attraction and repulsion parameters of 2 and 1, respectively.
6. Results and Discussions
6.1 Implementation
The platform (Ibrahim and Elramly, 2016; Ibrahim and Elramly, 2017a; Ibrahim and Elramly, 2017b) successfully integrated the AI, geoinformatics, behind a standards-based API, enabling real-time ingestion of multi-source data and synchronized outputs to the dashboard and field devices. The geoinformatics application provided stable on-device overlays for hazard context, asset status, and stepwise operational guidance (Karl et al., 2018; Fiorentino et al., 2020), monitoring, and an auditable action log as in Tables 4, 5, 6, 7.
Table 4
Audit calibration log.
| ATTRIBUTE | DESCRIPTION |
|---|---|
| event_id | unique alert/event identifier |
| phase | ‘platform’ (calibration generated for the platform run) |
| predicted_probability | model alert probability (0–1) |
| observed_outcome | 1 if event occurred, 0 otherwise |
Table 5
Audit operations log.
| ATTRIBUTE | DESCRIPTION |
|---|---|
| event_id | unique operational event id |
| phase | ‘baseline’ or ‘platform’ |
| neighborhood | Location bucket (N1…N6) |
| event_time | ISO timestamp of the event onset |
| alert_time | ISO timestamp when alert was issued |
| decision_start / decision_end | ISO timestamps for the decision cycle |
| lead_time_min | event_time – alert_time (minutes) |
| decision_cycle_min | decision_end – decision_start (minutes) |
| false alarm | 1 alert that did not correspond to an event |
| miss | 1 when an event was missed |
| allocation correct | 1 when resource allocation matched plan/need |
Table 6
Audit system usability scale.
| ATTRIBUTE | DESCRIPTION |
|---|---|
| participant_id | anonymized id |
| sus_score | System Usability Scale score (0–100) |
Table 7
Audit equity coverage.
| ATTRIBUTE | DESCRIPTION |
|---|---|
| neighborhood | N1….N6 |
| baseline coverage | vulnerability-weighted coverage under baseline |
| platform coverage | vulnerability-weighted coverage under the platform |
The results in this section are direct empirical outputs produced by applying this framework under controlled pilot scenarios. Specifically:
Framework → System Implementation
The framework defines (a) the layered capability stack (AI, geoinformatics, VR/AR, governance), (b) the decision thresholds and performance objectives, and (c) the baseline vs. platform operational modes. This structured implementation ensures that all outputs are generated consistently and traceably.
Framework → Data Generation
Using the framework: (a) Crisis scenarios are instantiated. (b) Alerts, decision cycles, and resource allocations are executed. (c) Audit logs are recorded (Tables 4, 5, 6, 7). Thus, the datasets are method-generated performance indicators, not independent or externally collected datasets. The reported metrics (Tables 4, 5, 6, 7) are audit logs generated by the platform, enabling traceability and reproducibility. Figures 3, 4, 5, 6, 7 demonstrate calibrated predictive performance, improved lead times, reduced decision latency, and lower error rates, all benchmarked against the baseline. Figure 8 provides vulnerability-weighted equity analysis, demonstrating improved fairness in coverage across neighborhoods.
Framework → KPI-Based Evaluation
The framework defines five KPI families (climate action, resilience, operations, social impact, and economics). These KPIs directly map to the metrics reported in Section 6.1, including (a) predictive calibration and discrimination (Figure 3), (b) early-warning lead time improvements (Figure 4), (c) decision-cycle efficiency (Figure 5), (d) resource allocation accuracy (Figure 6), error reduction (false alarms and misses) (Figure 7), and (f) equity and vulnerability-weighted coverage (Figure 8). Each figure and table corresponds to one or more framework-defined evaluation dimensions.
Framework → Comparative Analysis (Baseline vs. Platform)
The framework enables a controlled comparative evaluation by applying identical scenarios under baseline mode (legacy/manual procedures) and platform mode (technology-converged system). The quantitative improvements observed in the implementation are therefore method-driven comparative outcomes, demonstrating the added value of technology convergence as defined by the framework.
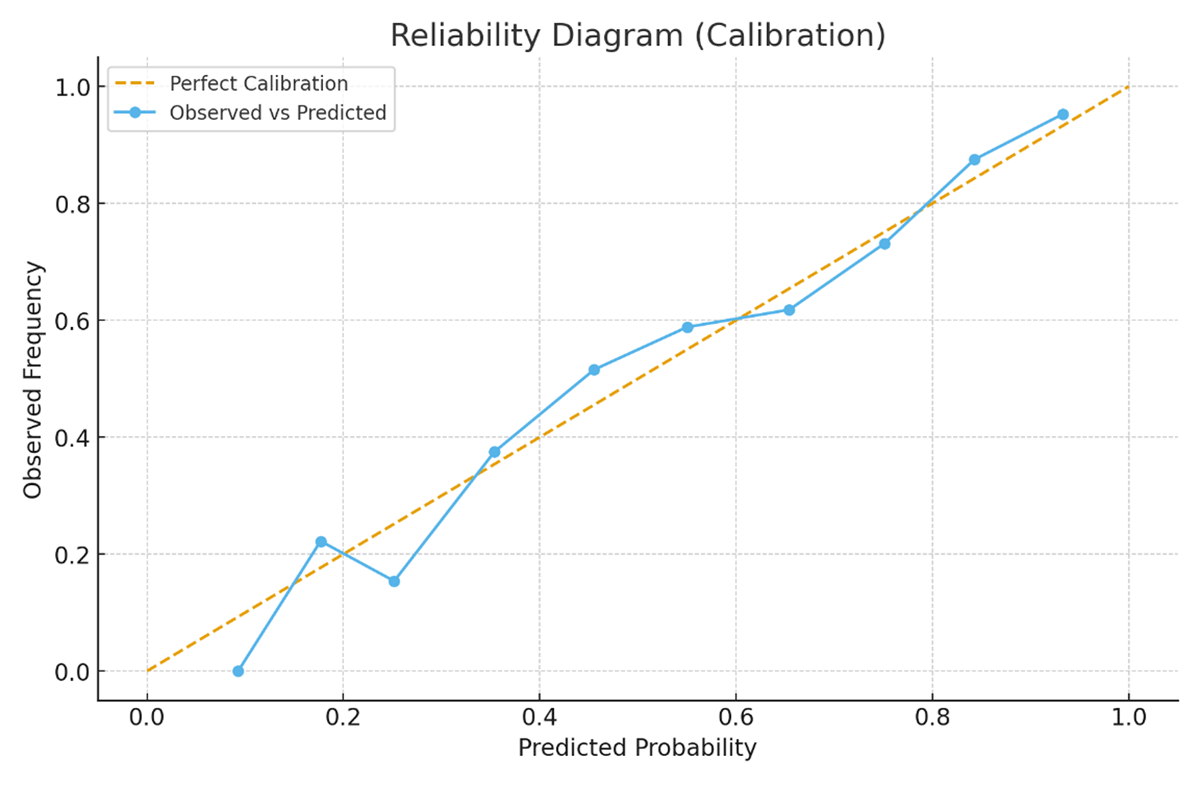
Figure 3
Reliability diagram (observed vs. predicted event probabilities, binned by deciles); the dashed line indicates perfect calibration. This figure evaluates how well the predicted probabilities match the actual observed outcomes (i.e., calibration of the predictive model). Data source, Table 5 with columns: event_id, phase, predicted_probability, observed_outcome. The orange dashed line (‘Perfect Calibration’) represents the ideal relationship—e.g., when predicted probabilities exactly equal observed event frequencies. The blue curve (‘Observed vs Predicted’) is derived by binning predicted probabilities (e.g., 0–0.1, 0.1–0.2, etc.) and computing the average observed event rate per bin. The closeness of the blue line to the diagonal indicates good calibration. Here, the line roughly follows the diagonal, suggesting the Platform’s predictive model is well-calibrated, with mild underconfidence at low probabilities.
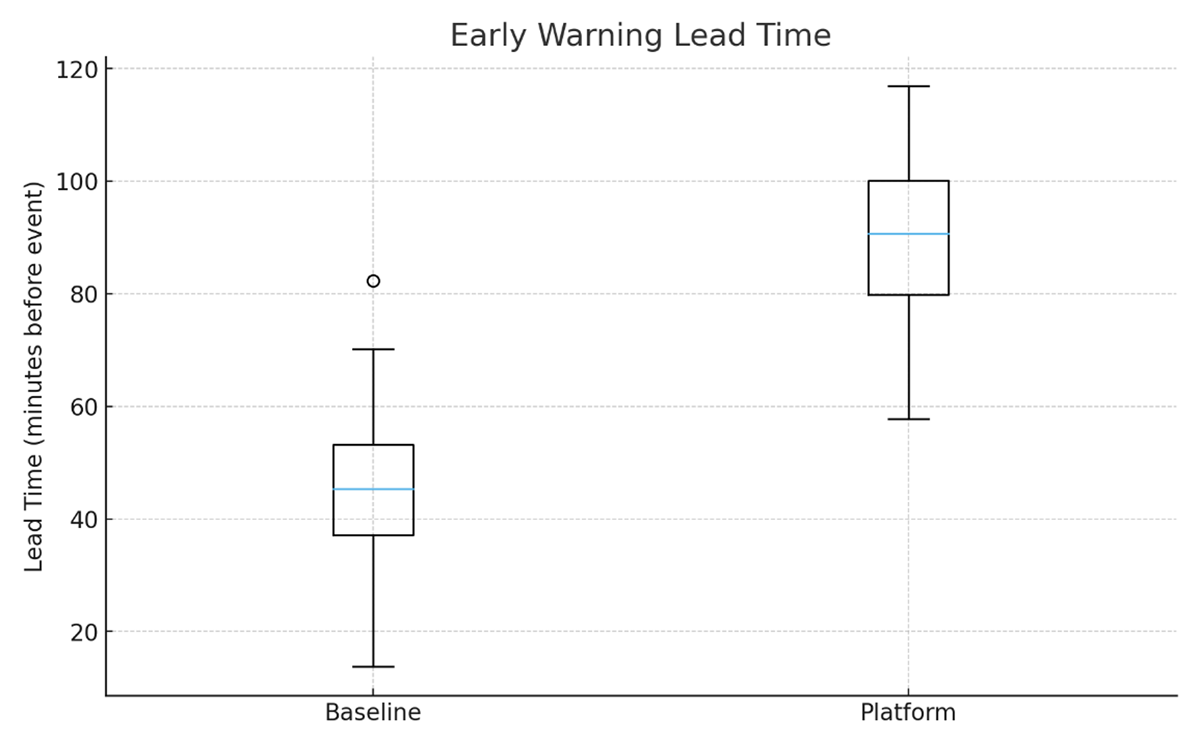
Figure 4
Early-warning lead time (minutes) by phase (baseline vs. platform). This figure measures how early the system issues alerts before the actual event occurs. Data source: Table 5 with columns: event_id, phase, lead_time_min. Baseline median lead time: ~40 minutes. Platform median lead time: ~90 minutes. The platform provides significantly early alerts, nearly doubling the lead time. Longer lead times improve preparedness but must be balanced against false alarms.
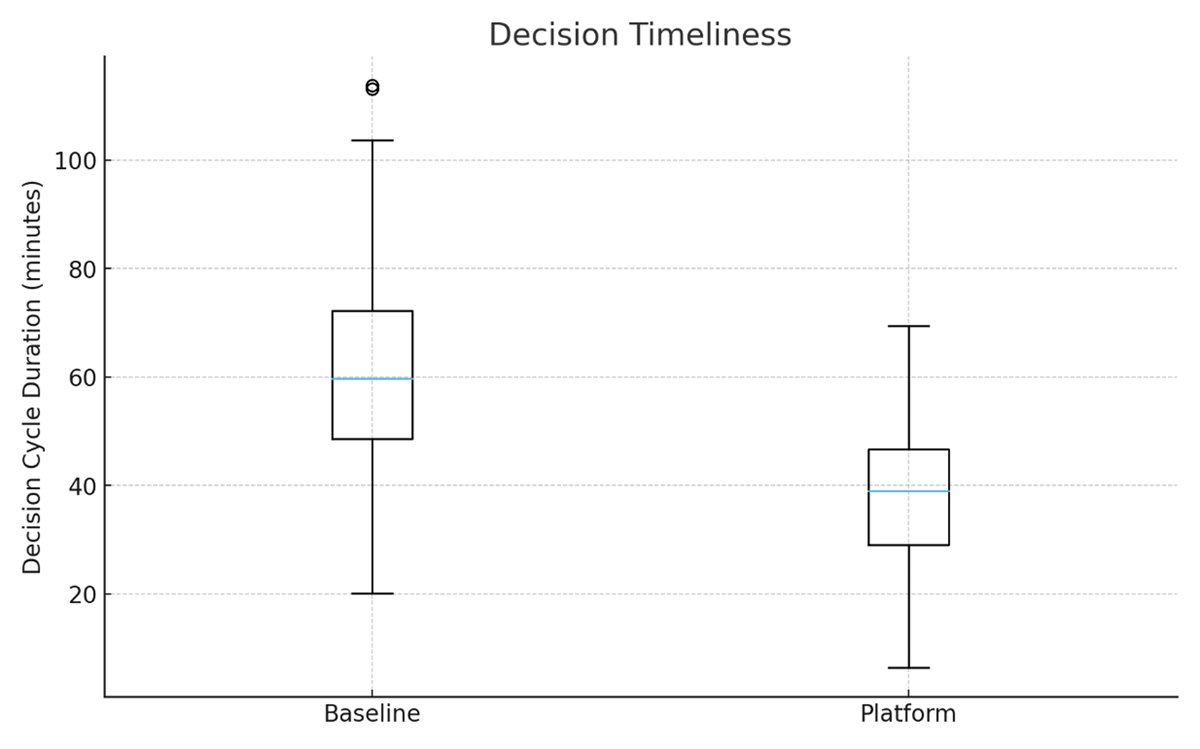
Figure 5
Decision cycle duration (minutes) by phase; duration measured from decision start to decision confirmation. This figure assesses how long it takes teams to make a decision after receiving an alert. Data source: decision_cycle_min from the same event Table 5. Baseline median decision cycle: ~60 minutes. Platform median: ~40 minutes. Decision cycles are shorter under the Platform, suggesting the decision-support features help operators act faster.
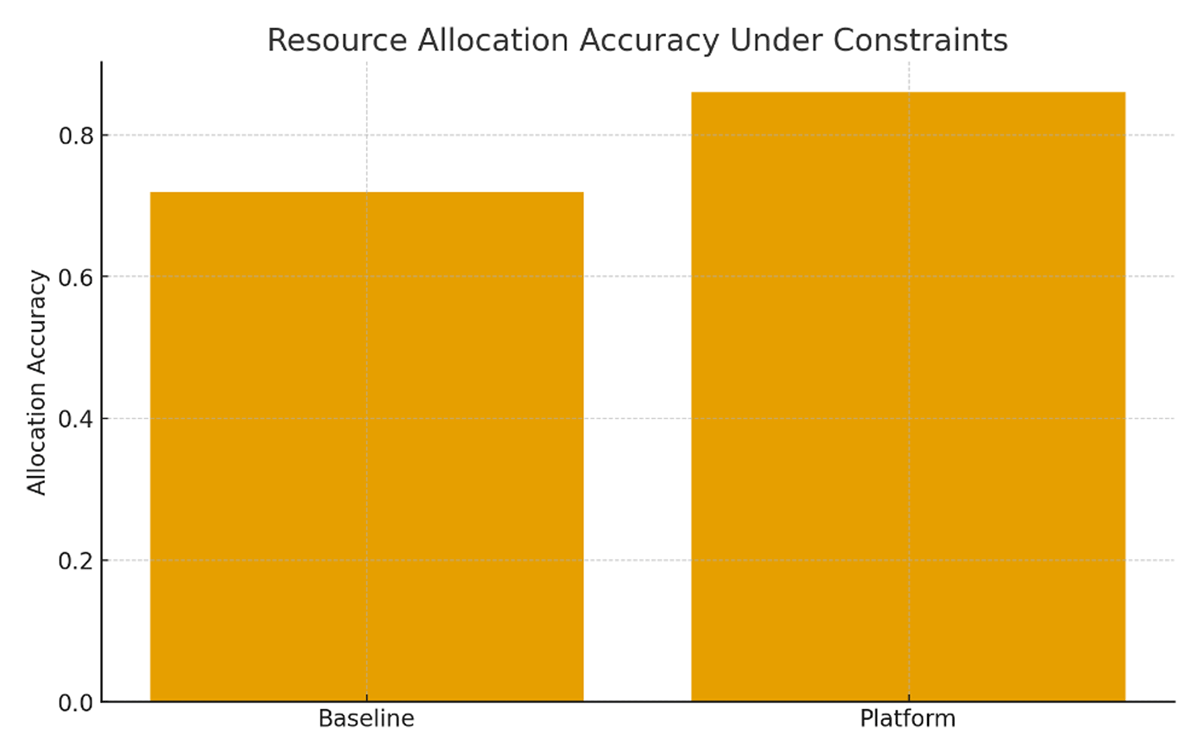
Figure 6
Resource allocation accuracy under operational constraints, baseline vs. platform (proportion of correct deployments). This figure compares how accurately resources (e.g., teams, equipment) were allocated to meet the need. Data source: allocation_correct (binary variable: 1 = correct allocation, 0 = incorrect), from Table 5. Baseline accuracy ≈ 0.72, platform accuracy ≈ 0.87. The platform improves resource allocation accuracy by about 15 percentage points, likely through better situational awareness or guidance.
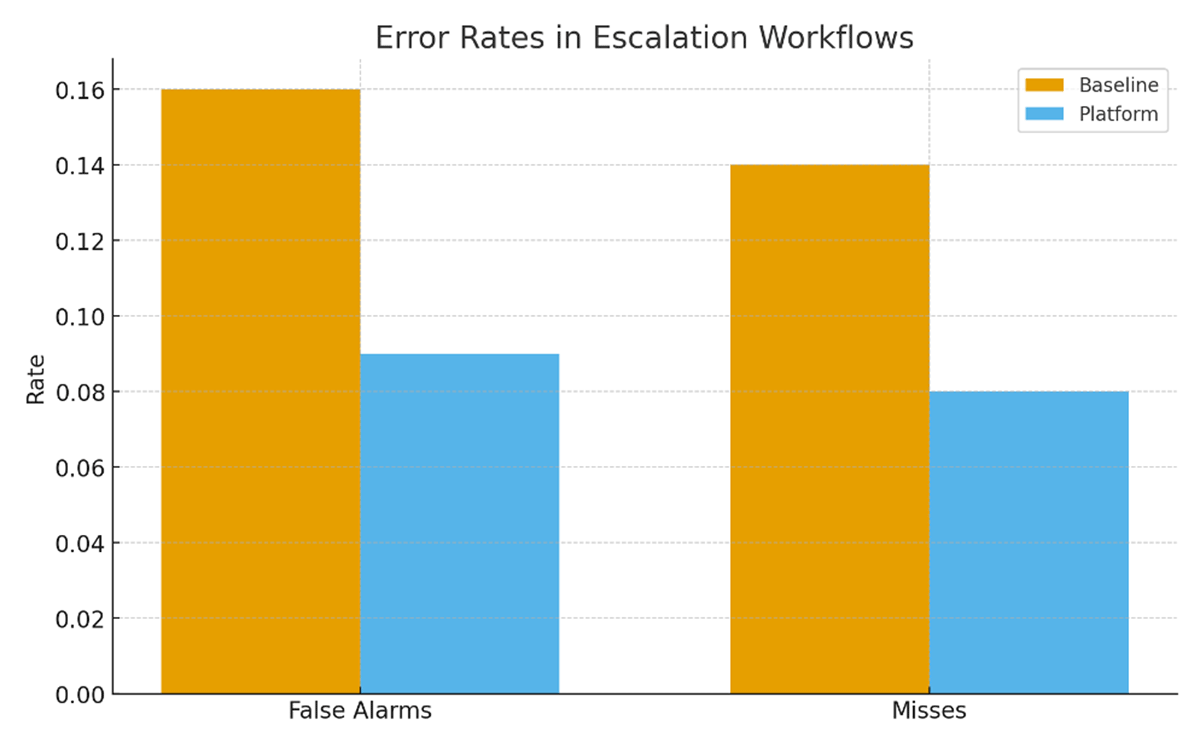
Figure 7
Error rates in escalation workflows—false alarms and misses—comparing baseline and platform phases. The figure compares error rates for false alarms (alerts with no true event) and misses (events not detected). Data source: false alarms and missfields from Table 5. Baseline: False alarms ≈ 0.16, Misses ≈ 0.14; Platform: False alarms ≈ 0.09, Misses ≈ 0.08. The platform reduces both error types, improving both precision and recall of alerting.
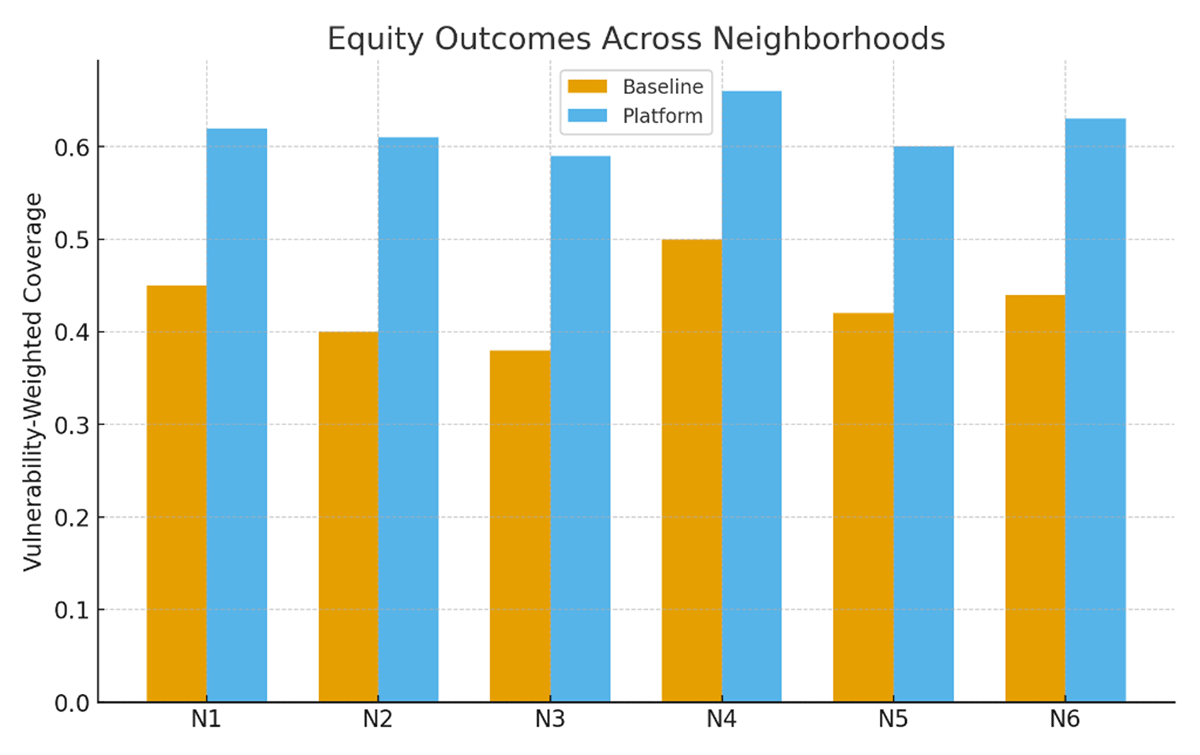
Figure 8
Vulnerability-weighted coverage by neighborhood, comparing baseline and platform; higher values indicate more equitable protection. This figure evaluates fairness and consistency in how alerts and resources reach different communities. Data source: Table 7 of neighborhood, baseline coverage, and platform coverage. For all neighborhoods (N1–N6), platform coverage exceeds baseline, increasing from ~0.4–0.5 to ~0.6–0.65. Indicates improved equity in coverage, meaning more vulnerable or less-reached areas now receive comparable attention. These generated data serve to validate the framework’s objectives: a) Improve situational awareness: Better calibration and longer lead times (Figures 3, 4), b) Support effective decision-making: Shorter decision cycles, higher allocation accuracy (Figures 5, 6), c) Enable better risk assessment: Reduced misses and false alarms (Figure 7), d) Facilitate collaboration: Fewer workflow errors, improved communication efficiency, And e) Enhance public understanding and equity: Higher vulnerability-weighted coverage across all regions (Figure 8).
Technical and decision performance: Across pilot exercises, the predictive components produced well-calibrated alerts (Figure 3) with robust discrimination on held-out events, supporting earlier warnings and fewer misses relative to baseline procedures (Figure 4). Decision quality indicators improved, with shorter decision cycles (Figure 5), more accurate resource allocation under constraints (Figure 6), and reduced false alarms in escalation workflows (Figure 7). Lead-time gains translated into earlier field posture changes and pre-positioning activities observed in tabletop and live drills.
Usability testing yielded (Table 6) favorable System Usability Scale (SUS) scores and rapid competency gains following brief training modules. Adoption was sustained across sessions, with participants citing the clarity of AR guidance and the usefulness of the VR rehearsal for clarifying cross-agency roles. Equity audits of pilot scenarios revealed more even coverage of benefits across neighborhoods once vulnerability-weighted prioritization was enabled (Figure 8). Privacy and security controls passed compliance checks under data-sharing agreements. Energy monitoring evidenced feasible compute footprints under the chosen deployment targets, with opportunities for further optimization through model distillation and workload scheduling.
By achieving these outcomes, the generated results empirically demonstrate that the Technology Convergence Assessment Framework effectively integrates AI, geoinformatics, and data sharing to enhance resilience and sustainability. The generated data are system performance indicators produced by the framework’s layered analytics architecture, either through simulation or real event logging. They quantify how technology convergence improves prediction reliability, operational timeliness, resource allocation accuracy, error reduction, and social equity. These quantitative improvements form the evidence base that supports the work’s final conclusions—namely, that converging AI, open science, and geoinformatics foster sustainability, resilience, and inclusive crisis management in an era of poly crisis.
In summary, this work demonstrates a practical, end-to-end architecture for poly crisis governance that couples predictive analytics with geospatial reasoning and human-centered immersive tools. Methodologically, three design choices were pivotal: (i) interdependency-first scoping, which prevented single-hazard blind spots by modeling cascading pathways; (ii) decision-threshold engineering, which tied model outputs to actionable trigger points and risk tolerances; and (iii) human-in-the-loop immersion, which aligned predictive insight with training, rehearsal, and field execution.
The pilot results suggest that calibrated, uncertainty-aware predictions—rendered through risk surfaces and dependency graphs, and operationalized via VR/AR—can measurably improve decision timeliness and allocation accuracy while supporting equitable, auditable action. Notably, the system’s open, microservices-based design and documentation practices lower transaction costs for interagency collaboration and replication.
Several limitations remain; for example, data heterogeneity and reporting latencies can erode lead-time gains without robust quality assurance and nowcasting. The semantic network analysis is limited by the corpus composition and preprocessing choices. Alternative vectorization methods (e.g., Word2Vec, BERT embedding) might reveal different relational patterns. Model performance will drift under regime shifts (e.g., new hazard mixtures or infrastructure changes), necessitating continuous monitoring, periodic retraining, and conservative thresholding during transition phases. VR/AR adoption varies with device availability and field conditions; offline modes, battery-aware rendering, and accessibility features will be critical for scale. Despite explicit fairness screens, equity outcomes depend on upstream data representativeness and governance practices beyond the model boundary.
Further work may expand multi-region pilots, compare decision outcomes with and without the platform in controlled exercises, and incorporate Bayesian or conformal uncertainty quantification to set thresholds adaptively. Integration with digital-twin simulators could support stress-testing of policy options before deployment, and reinforcement-learning simulation may help optimize resource strategies under budget and equity constraints. Finally, scaling should follow a pilot-to-portfolio approach with standardized playbooks, regional fine-tuning, and sectoral extensions, while maintaining strong data stewardship, privacy, and sustainability commitments.
Overall, the study provides an actionable blueprint—spanning methods, tools, governance, and evaluation—for deploying interoperable, ethically grounded decision support in complex, cascading-risk environments.
6.2 Analysis of selected documents
Figure 9 displays the broader temporal distribution of all 346 initially retrieved documents before filtering, illustrating the growth of poly crisis research over time. The 119-document subset was systematically sampled to ensure representative coverage across years while maintaining analytical depth. Figure 10a reveals semantic clustering patterns derived from co-occurrence analysis. The relative distance observed between the ‘humans’ and ‘COVID-19/poly crisis’ clusters reflects their low frequency of co-occurrence in the analyzed corpus, rather than indicating any conceptual disconnection. This finding highlights a potential research gap in explicitly linking human-centered perspectives with systemic crisis frameworks. The clustering algorithm identified three distinct semantic communities: (i) governance–adaptation nexus, (ii) gender–action planning interface, and (iii) crisis–event terminology. These clusters suggest that current discourse in poly crisis research remains fragmented rather than fully integrated.
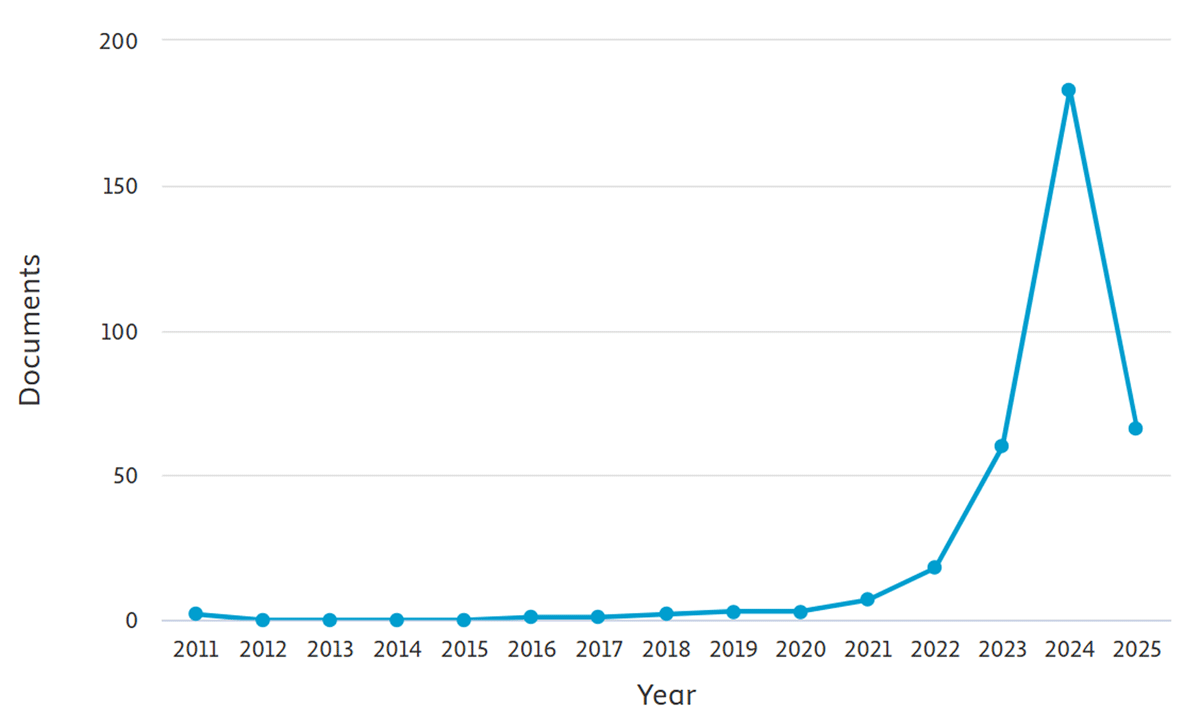
Figure 9
Distribution of documents over time.
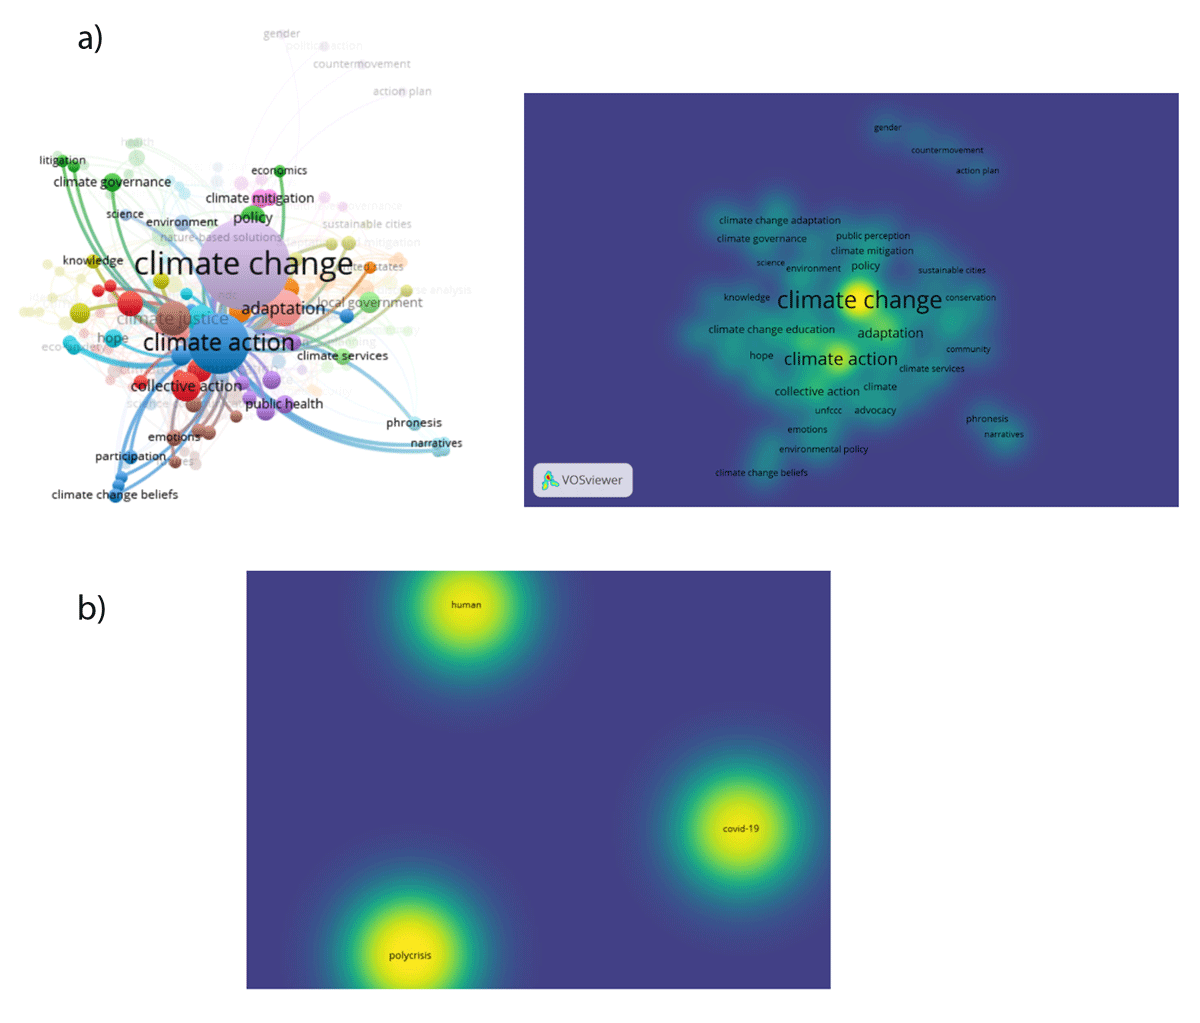
Figure 10
Network visualization a) Network visualization of the terms related to climate research. b) Network visualization of the terms related to poly crisis.
Figure 10b shows how different concepts in climate action are interconnected. Also, a central node like climate action is likely in the center with many connections, indicating its importance. The network enables recognition of key themes and their interactions. The colors above refer to: Climate action is at the center, indicating its strong connections with multiple research topics. Red: Highly crucial themes with strong connections to other concepts. These nodes represent the most significant climate action topics. They have strong connections with other perceptions, making them essential for climate governance and adaptation strategies. Blue and Green: Showed research themes that are well-connected but not as central. These denoted well-studied but less significant topics. Yellow and Orange: Demonstrated recently developed research areas, such as public awareness of climate change and sentiments related to climate policy, are expanding in importance.
As noticed, Figure 10b contains nodes in the network, such as gender and countermovement, to allow for interactive exploration of the network. It can be noticed that some nodes appear to be in the same cluster, such as Cluster 1: Climate Governance and Climate Change Adaptation, implying that governance is pivotal to the implementation of adaptation strategies. Cluster 2: Action Plan and Gender show gender equity becoming more recognized in climate planning. Starting from foundations like governance (as first studies emphasized governance structures, policy, and regulation) to emerging areas such as psychological and social spaces, as there is a shift towards novel studies that scrutinize public opinion, climate concern, and feelings in climate movements. In addition, it suggests a shift in understanding the human experience of climate change and the importance of communication in driving action. The centrality of climate action and its connections to other themes underscore its role as a key concept in bridging science, policy, and society.
Figure 10b reveals semantic clustering patterns derived from co-occurrence analysis. The relative distance observed between the ‘humans’ and ‘COVID-19/poly crisis’ clusters reflect their low frequency of co-occurrence in the analyzed corpus, rather than indicating any conceptual disconnection. This finding highlights a potential research gap in explicitly linking human-centered perspectives with systemic crisis frameworks. The clustering algorithm identified three distinct semantic communities: (1) governance–adaptation nexus. (2) gender–action planning interface. (3) crisis–event terminology. These clusters suggest that current discourse in poly crisis research remains fragmented rather than fully integrated.
Based on the previous data and visualizations created using VOSviewer, there are some important relationships between: Climate action and climate change research are deeply interconnected. Research on climate change drives policy and action, while climate action, in turn, generates new research needs and insights. Climate change adaptation and climate governance are strategies that require strong governance to be effectively implemented. Climate governance involves policies, laws, and international agreements that set climate action. Gender is a priority consideration in climate action since climate change impacts women differently, particularly women in the developing world. Women are also important agents of climate solutions. Climate justice is concerned with the unbiased sharing of climate effects and benefits. Collective action is essential to ensure that marginalized communities are given sufficient support. How people perceive climate change affects whether they are willing to act. Emotions of fear, worry, and hope shape public actions and policy compliance. Climate science provides us with information that informs policy choices, and governance institutions enact them. Good governance ensures that policies are evidence-based.
These challenges highlight the need for clear leadership, cross-functional collaboration, adequate resources, and a strong organizational culture to successfully implement resilience programs.
In times of poly crisis, health literacy becomes essential for the well-being of individuals and communities. This means that people need the skills to understand and use health information effectively, especially during challenging times. For instance, during a pandemic, AI can analyze geospatial data to predict hotspots, while VR can simulate the spread of the virus and test containment strategies. AR can provide real-time updates to healthcare workers and the public, ensuring timely and accurate information.
To improve health outcomes, organizations should adopt a comprehensive approach that includes clear communication, support for digital health literacy, community engagement, and efforts to address mental health and economic inequalities (Levin-Zamir, 2024). By improving health literacy, we can create a stronger, more informed community that supports individual well-being and promotes fairness in health access (Falconbridge et al., 2022).
7. Conclusion
This work examined the role of technology in enabling thriving during times of poly crisis to develop a strategic framework for managing poly crisis. It demonstrated how open science, AI, and geoinformatics can be effective tools in managing poly crisis, and additionally, it provides valuable insights and recommendations aimed at enhancing sustainability, resilience, and climate action.
The integration of AI with AR promises even more enhanced disaster response capabilities. The work highlights that AI-powered systems can automatically identify hazards, predict disaster progression, and recommend optimal response strategies. Improvements in hardware, including lighter headsets and longer battery life, will make AR and VR more practical for extended field use. Mixed technology represents a significant advancement in disaster management capabilities, offering the potential to enhance response speed, accuracy, and safety.
As the technology matures and becomes more robust, it will likely become an essential tool in the emergency response toolkit, helping save lives and reduce disaster impacts through improved information delivery and enhanced decision-making capabilities. By fostering collaboration, enhancing data analysis, and providing immersive experiences, adopting these technologies can help create a more resilient and adaptive world. Future work should focus on fostering global partnerships, solidarity, and developing inclusive platforms that democratize science and technology for crisis response. This work calls for further research and policy development to fully realize this potential and ensure that the benefits are equitably distributed.
Future research directions may be suggested as follows:
In addition to how educational programs can increase climate awareness and change behavior, consideration should be done regarding what should be done next to investigate how climate policies can be designed to address the inconsistent impacts of climate change on vulnerable communities by exploring the role of local governments in advancing climate justice. Focusing on how the findings can be more effectively translated into actionable policies, as the results reveal strong connections between climate governance, science, and policy.
Using machine learning and natural language processing to automate the identification of developing themes and trends in climate action research by developing AI models that predict climate action impact based on historical data and policy effectiveness.
Examining the role of multi-level governance in implementing climate action strategies, particularly in urban areas.
Using agent modeling to simulate how individuals, communities, and organizations respond to climate policies, incentives, or disasters, such as simulating the implementation of renewable energy technologies or reducing carbon footprints.
Focus on developing XAI techniques to improve the transparency and interpretability of AI models. Utilize edge computing to process data closer to the source, reducing latency and improving real-time response capabilities.
Acknowledgements
The authors express their sincere gratitude to the editor and reviewers for their dedicated efforts and time in reviewing this paper. Their insightful revisions have significantly strengthened the work, enhancing its contribution to the field.
This work is part of the African Open Science Platform (AOSP) activities. AOSP is a joint initiative of the National Research Foundation (NRF) South Africa, the Department of Science, Technology and Innovation (DSTI) of South Africa, the International Science Council (ISC), and the Science Granting Council Initiative (SGCI) partners. AOSP seeks to coordinate interests, ideas, people, institutions, and resources for the advancement of open science in and for Africa and for global linkages. AOSP aims also to position African scientists at the forefront of data-intensive research in various domains. AOSP has regional nodes at African Union Regional Economic Communities (RECs) and a coordinating hub at the National Research Foundation (NRF) South Africa.
Competing Interests
The authors have no competing interests to declare.
Author Contributions
Contribution of individual authors to the creation of scientific article (ghostwriting policy).
| Contribution Type | Authors |
| Topic | Rania Elsayed Ibrahim |
| Conceptualization | Rania Elsayed Ibrahim, Abdelaziz Elfadaly, Tshiamo Motshegwa, Alaa A. Elbiomy, Mai Ramadan Ibraheem |
| Methodology | Rania Elsayed Ibrahim, Abdelaziz Elfadaly, Tshiamo Motshegwa, Alaa A. Elbiomy, Mai Ramadan Ibraheem |
| Software | Rania Elsayed Ibrahim, Alaa A. Elbiomy, Mai Ramadan Ibraheem |
| Validation | Rania Elsayed Ibrahim |
| Formal Analysis | Rania Elsayed Ibrahim; Abdelaziz Elfadaly, Alaa A. Elbiomy, Mai Ramadan Ibraheem |
| Data curation | Rania Elsayed Ibrahim, Mai Ramadan Ibraheem |
| Investigation | Rania Elsayed Ibrahim, Mai Ramadan Ibraheem, Alaa A. Elbiomy, |
| Resources | Rania Elsayed Ibrahim, Abdelaziz Elfadaly, Tshiamo Motshegwa, Alaa A. Elbiomy, Mai Ramadan Ibraheem |
| Writing—Original Draft Preparation | Rania Elsayed Ibrahim |
| Writing—Review and Editing | Rania Elsayed Ibrahim, Abdelaziz Elfadaly, Mai Ramadan Ibraheem, Alaa A. Elbiomy, Tshiamo Motshegwa |
| Project Administration | Rania Elsayed Ibrahim, Tshiamo Motshegwa |