
1. Introduction
1.1 Bycatch overview
Bycatch refers to unwanted and unsustainable but reportable species caught anywhere during legal and illegal fishing operations, including fish, invertebrates, marine mammals, turtles, and seabirds (Hall, 1996; Komoroske and Lewison, 2015; Lewison et al., 2004; Senko et al., 2014). Bycatch can be quantified in data and carries a legal concept. It can come from artisanal and industrial fisheries alike; and it tends to have a rather negative and far-reaching impact on marine ecosystems at large. It is known for instance to affect biodiversity and destroy pristine habitats, and it is documented to harm and kill protected species (Benaka, Cimo and Jenkins, 2012), such as, in the North Pacific, the short-tailed albatross (Phoebastria albatrus, TSN: 554377; e.g., Phillips et al., 2010). It can further include contamination as well as ‘ghost nets’ spoiling and killing marine life for a long-time (Senko et al., 2014), as it is also reported for Alaska (see Maselko, Bishop and Murphy, 2013, for an example in crab fishery). Bycatch has specific negative effects on marine biodiversity at large—many are long term and across administrative boundaries—through affecting top predators, the individual’s removal of different populations and the wide elimination of prey (Hall, Alverson and Metuzals, 2000; Lewison et al., 2004), especially in a system of severely reduced resilience to fishing by fishing (e.g., Estes et al., 2011). While data are widely missing and not mandated, to a varying degree, bycatch occurs virtually in all fishing fleets around the world (Clay et al., 2019; Davies et al., 2009). It is poorly resolved, yet, and it is part of a capitalistic, exploitive framework and modern encroachment of humans in remote oceans—usually made much worse by the excessive use of the combustion engine, polyplastic-filament nets, winches and industrialization and of the WWW (World Wide Web)—easily taking marine components from the ocean for human consumption and use on a vast scale without relevant data reporting or subsequent ethics (Davies et al., 2009; Gilman, Dalzell and Martin, 2006; Hall, Alverson and Metuzals, 2000; Komoroske and Lewison, 2015; Lewison et al., 2014).
It further affects the fish brand and the ‘product’ itself, the sourced Exclusive Economic Zones (EEZ) as well as its wider market, the economy, and food chain at large. Bycatch was also considered by Pauly et al. (1998) as a possible feature of the fishing-down effect on marine food webs. Just now it becomes clear that data do not fully exist and the massive impacts already present, e.g., Sea around us project (https://www.seaaroundus.org/). Impacts usually occur globally, and monitoring now includes some industrial self-policing—often surveyed and enforced through GPS, satellites, computing, and associated banking industries and economic schools (Bresnihan, 2016; Orofino et al., 2023 for GPS tracking in fisheries management; Patrick & Benaka, 2013).
Bycatch affects nations and their subsidies, e.g., in the EU (Cazé et al., 2022). Another bycatch-related problem, and one of the motivations why it actually is widely studied, was the economic losses that fishermen and nations face themselves as a socio-economic impact (Campbell and Cornwell, 2008). Exact estimates of bycatch must be included in sustainability computations for stock assessments but missing data and formats and protocols remain vague, at best. Those impacts are all related to the damaged stocks, loss of landings and the discard of marketable catch due to regulatory requirements (but see Lin et al., 2023 for China; Patrick & Benaka, 2013). China has not yet established a national legal Open Access system to combat illegal, unreported and unregulated (IUU) fishing (Gou and Yang, 2023). This results in a wide uncertainty—usually lack of—reporting data by fisheries workers of bycatch data (undisclosed ‘underground numbers,’ and unconfirmed ‘shadow reporting’), leading to an underestimation of the issue by researchers and managers. The latter situation affects proper assessment and good guidance for science-based fisheries to reach defendable sustainable levels in the public eye using science and analysis (Moore et al., 2013). This easily turns into a cultural, governance and institutional problem with true unknown impacts while a natural resource is harmed, and socioeconomics get damaged, globally (Lewison et al., 2004) with while best professional practices being are ignored. It adds to the ‘race to the bottom’ (Revesz, 1997).
1.2 Selection of marine species affected in the study area
Finding public fisheries data explicit in space and time for Alaska remains difficult. While the list of species affected by fisheries is long, the bycaught species that are described in public thus far consist primarily of charismatic marine megafauna (i.e., seabirds, marine mammals and sea turtles). Whereas bycatch is considered a major factor contributing to the negative conservation outcomes observed in many seabird species (Anderson et al., 2011; Croxall et al., 2012; Werner et al., 2015). Some characteristics of their life history and demography are necessary features to describe and understand the bycatch trend in those species (e.g., Heppell, Caswell & Crowder, 2000). Marine megafauna typically has ‘culture,’ show individualism, are k-strategists (= carrying capacity; Oro, and Martínez-Abraín, 2009) and thus carry a long lifespan (Plot et al., 2012; Tavares et al., 2019), the sexual maturation occurs late in life and relies on an iteroparous reproductive strategy (Cordes, 2011; Lewison et al., 2004). Essentially all the traits of marine megafauna ecology are related to ecosystem functions and services (Tavares et al., 2019), and they require a high rate of survival of adult and subadult individuals. This means that anthropogenic impact, such as the described bycatch, on their population tend to have devastating, long-term population-scale effects beyond just the individual (Lewison et al., 2004; Melvin et al., 2006; Melvin et al., 2019).
1.3 Alaskan fisheries
The state of Alaska is part of the US, and thus even before taking into account the species’ life history and demography, the fishing effort and bycatch risk must be assessed and publicly released due to legal requirements (Magnuson-Stevens Act, 2007). Whereas the actual data format required for such reporting remains not well specified for details, hardly follows modern concepts and essentially not addressed nor effectively reported or exist (further details below).
In Alaska (US), many fisheries do occur using different stocks, e.g., salmon (Dietrich, Kuletz and Moon, 2025), herring and shellfish and crab and groundfish fisheries—Pacific Cod–Gadus macrocephalus, Pollock–Theragra Chalcogramma (McHuron et al., 2025), Sablefish–Anoplopoma fimbria (Woodby et al., 2005). The fisheries in Alaska are widely structured and governed around industry and gear, less by meaningful ecological units, science or ecological needs of the fish. Alaska is world-renowned for its natural resource wealth; it’s also perceived as a good global role model and has many individually managed stocks (currently 23 stocks; ADFG, 2024a). In this assessment, we decided to focus on Alaskan longline groundfish and Pacific halibut fisheries, just a small portion of that otherwise huge Alaskan fishery, but thus far they are the only ones that we could find a peer-reviewed data explicit in space and time to use and digitize for a modern analysis.
1.4 Longline fisheries
Pelagic longline fisheries appeared to be among the biggest fishery typologies to affect natural populations and wilderness (Fader, Elliott and Read, 2021). It usually is industrial and a multi-national effort with many nations involved in international gear and supply chains as well as a global workflow and marketplace helped by commercial airlines (Huettmann, 2005) whereas official data reporting remains weak. Halibut longline fisheries in Alaska show evidence of clear and acknowledged negative effects on seabird populations (Dietrich, Parrish and Melvin, 2009; Melvin et al., 2006; Melvin et al., 2019; Moore et al., 2009), beside other impacts, e.g., socio-economic. A large number of seabirds have been caught after trying to take bait from the hooks of the lines and they drown in large quantities (easily many 1,000s, Anderson et al., 2011; Dietrich, Parrish and Melvin, 2009). Many marine mammal populations are also affected and threatened by longline fisheries, but the stakeholders as well as decision makers are more concerned regarding economic losses and not the status of the populations or a science-based management with public data (Hamer, Childerhouse and Gales, 2012; Werner et al., 2015).
Further it is noteworthy that in some dominating professional fisheries circles—often those are commercial and even national but outside of the wider scientific community and consensus—the world is widely perceived as underfished (The Guardian, 2024) and with resources ready to be monetarized as much as one can. This perspective raises important questions in relation to the concept of Ecological Impact and Maximum Sustainable Yield (MSY): although MSY was originally developed as a tool to balance exploitation and conservation, its application to whaling is highly contentious, as it often parsimonious and thus overlooks broader ecological considerations, including the complex population dynamics of whales and their critical role in marine ecosystems (Roman et al., 2014).
1.5 Laws and policies in bycatch and data
In the study area different laws and policies are active, we can find the United Nations Law of the Sea (UNCLOS), the Magnuson-Stevens Act, as well as other specific policies on the management and conservation of species such as the Marine Mammal Protection Act (MMPA), the Migratory Bird Treaty Act (MBTA), and the Endangered Species Act (ESA). Laws and policies background that are significant for the study area are summarized in Table 1 of the textual Appendix and a more comprehensive description of those is provided in the textual Appendix.
Table 1
List of the species and their conservation status occurring in Alaskan waters. Last column shows the individual animals bycaught, as reported in the NOAA National Bycatch Report amended in 2019 regarding data for 2015 (Benaka et al., 2019). For some species no data are shown, and for other species (sooty shearwater, glaucous-winged gull and red-legged kittiwake) the data presented here refer not to species individual bycaught but to higher taxonomic level, respectively, Procellariidae (two species), Laridae (one species) and Rissa (one species). These data refer to all fishery typologies in Alaskan waters. Only for the short-tailed albatross, the data are for, 2014, and the individuals caught in the Bering Sea/Aleutian Islands region. For marine mammals, the dataset is from 2011 to 2015 (IUCN; Benaka et al., 2019, Tables: 5.5.2–5.7.1–5.7.2). Taxonomic serial numbers (TSN) are reported from the Integrated Taxonomic Information System (ITIS) website (www.itis.gov). IUCN: https://www.iucnredlist.org/. ESA: https://www.fws.gov/law/endangered-species-act.
| # AND COMMON NAME | SCIENTIFIC NAME (TAXONOMIC SERIAL NUMBER TSN FROM ITIS.gov) | ALASKAN WATCHLIST STATUS (2017) | IUCN STATUS | ENDANGERED SPECIES ACTSTATUS | BYCAUGHT INDIVIDUALS |
|---|---|---|---|---|---|
| 1. Killer whales | Orcinus orca (180469) | Data Deficient | Endangered | 1.0 | |
| 2. Pacific white-sided dolphins | Lagenorhynchus obliquidens (180444) | Least Concern | |||
| 3. Harbor porpoises | Phocoena phocoena (180473) | Least Concern | |||
| 4. Beluga whales | Delphinapterus leucas (180483) | Least Concern | Endangered | 0.21 | |
| 5. Red-legged kittiwake | Rissa brevirostris (176845) | Declining (Red list) | Vulnerable | 12.0 | |
| 6. Glaucous-winged gull | Larus glaucescens (176814) | Declining in various areas | Least Concern | 1,244.0 | |
| 7. Sooty shearwater | Ardenna grisea (174553) | Declining | Near Threatened | 377.0 | |
| 8. Northern fulmar | Fulmarus glacialis (174536) | Least Concern | 3,430.0 | ||
| 9. Short-tailed albatross | Phoebastria albatrus (554377) | Depressed (Red list) | Vulnerable | Endangered | 9.0 |
| 10. Black-footed albatross | Phoebastria nigripes (554379) | Near Threatened | 359.0 |
Within a conservation management perspective, the US coverage under a Marine Protected Areas (MPAs) network is thought to comprise around 30% by 2030, these days, with the most-protected area being the remote Central Pacific (96%; Sullivan-Stack et al., 2022). The Alaska region, however, currently lacks effective MPAs, with only 24,190 km2 designated, accounting for just 0.7% of the total marine area in Alaska (Sullivan-Stack et al., 2022). None of the MPAs are really ‘no take’ or dynamic, and a cohesive and effective plan for the future and in times of climate change is lacking.
Noteworthy for all of those laws is the lack of a unifying data topic, namely to collect, share, and provide data in a consistent protocol and effective format. While the US is a signatory nation of GBIF.org and a major data provider—including in OBIS.org and ITIS.org—in earnest, the bycatch and marine policy realm remains widely void of data.
1.6 Selected key species used for bycatch estimates
Alaskan waters support many and very large populations of seabirds (a total of 549 species of land and seabirds: as per Checklist of Alaska birds; Withrow et al., 2025), as well as marine mammals (33 marine mammals occur in Alaska waters; Wikipedia, 2024), with many of these species acting on a global scale. Many so-called landbirds do actually appear offshore (see Huettmann, Riehl and Meißner, 2016 for boreal region examples). Regarding seabirds, more than 40 species occur and over 80 million living individuals are estimated annually (Dahlheim, White and Waite, 2009; Eich et al., 2016; Wild et al., 2023). For this investigation, we selected a set of ten key species for a proof-of-concept study using Open Access data with commercial and Open-GIS, aiming to assess spatially how the longline groundfish fisheries affect marine populations in Alaska, both a re-assessment and risk assessment. The list of the considered species and their conservation status is presented in Table 1. We use as a source the Alaskan Watchlist (Kirchhoff and Padula, 2010), that is an important source because due to lack of research and expertise on the ground the IUCN seems to be incomplete and problematic biased (Donaldson et al., 2016), for Alaska and US in general.
1.7 Machine Learning and aims of the study
For the data at hand, a more holistic and modern assessment was pursued using open-source and commercial GIS with Machine Learning (ML) ensemble algorithms. This approach makes for a powerful non-parametric method of Artificial Intelligence (AI) in which the outcome can be presented with decision trees. It has the objective to produce predictions with the highest possible model accuracy for inference using the best-available predictors/data (Breiman, 2001b; Fox et al., 2017; see also Humphries, Magness and Huettmann, 2018 and Robold and Huettmann, 2021 for approaches; sensu Breiman, 2001a). Prior to our study, the only other statistical approaches used in Alaskan and bycatch studies, have been raw counts, data descriptions, LMs, GLMs, and parsimony (e.g., Dietrich, Kuletz and Moon, 2025; Dietrich, Parrish and Melvin, 2009; National Bycatch Report: Benaka et al., 2019), where the underlying assumptions remain narrow, parsimonious, untested, used as a ritual, univariate, not testable, or are known to fail providing modern inference (e.g., Guthery, 2008; McArdle, 1988; Whittingham et al., 2006). Correlations remain a key argument in such inference while research design and sampling for a hypothesis are widely absent, e.g., Dietrich, Parrish and Melvin (2009), McHuron et al. (2025). While our work tries to be the first exploration as an applied re-assessment of the new frontier of Machine Learning and Open Access data with GIS as the analysis platform of choice, one should remember that this work remains still far from a complete and correct assessment (for best practices and ethics in Open Access see Huettmann, Schmid and Humphries, 2015). This is due to lack of field data, proper research design and geo-referencing, ISO-compliant metadata, reporting and knowledge even covering just two of over 20 stocks in Alaska (~5%) in a limited area of EEZ overall.
For the first time, data types and formats in fisheries science were wider considered, an area that has thus far received limited attention despite the critical importance nationally and globally (Huettmann, 2015 and Huettmann and Arhondistis, 2023, compare also with Huettmann, 2020 in conservation management). We think that this emerging field holds significant potential for advancing conservation through improved data accessibility and transparency. By promoting Open Access fisheries data, we think it can support modern science-based management and more effective ecosystem protection strategies. Our work lays the groundwork for a standardized, reproducible approach to fisheries data integration (sensu Huettmann and Arhondistis, 2023).
The first aim of this work is to study and generate bycatch data, which are currently lacking or incomplete in US legislation as a baseline, in order to fill a critical gap for the sustainable management of fisheries and the conservation of marine species.
Using those modern seascape principles (Huettmann, 2015; Pittman et al., 2021) under an Open Access framework (BioTIME, 2024), the second aim of this study was to spatially and temporally estimate the bycatch risk of selected seabirds and extend it to some cetaceans in the EEZ of Alaska, US. These model methods are already widely and successfully employed in Species Distribution type Models (SDMs; Beaumont, Hughes and Pitman, 2008; Humphries, Magness and Huettmann, 2018), in which it is important to understand the degree and extent of climate change.
Overall, this work aims to start a discussion and an assessment of the status quo of data as well as a prediction of bycatch for the study area with a future outlook trend of 2050 using an above-average temperature scenario (+3.0°C) (Holsman et al., 2019). Finally, the evaluation of the impact on different species was made, ranking how present and future scenarios would influence the species under investigation leading to policy input based on actual data.
2. Methods
2.1 Study area and associated data compilations
The area of investigation and data assessment is the Exclusive Economic Zone (EEZ) of Alaska, US and adjacent waters (Figure 1). Administratively, this EEZ is divided into three main zones (Bering Sea, Aleutian Islands, and Gulf of Alaska) and further into 25 sub-management areas within, all according to the official and legally binding National Marine Fisheries Service (NMFS) classification based on ESRI GIS shapefiles (ESRI, 2024) but lacking ISO-compliant metadata, e.g., its geographic projection and spatial accuracy (National Marine Fisheries Service, 2023). Every zone has a unique label, and this label is used as a policy reference (details in Figure 1).
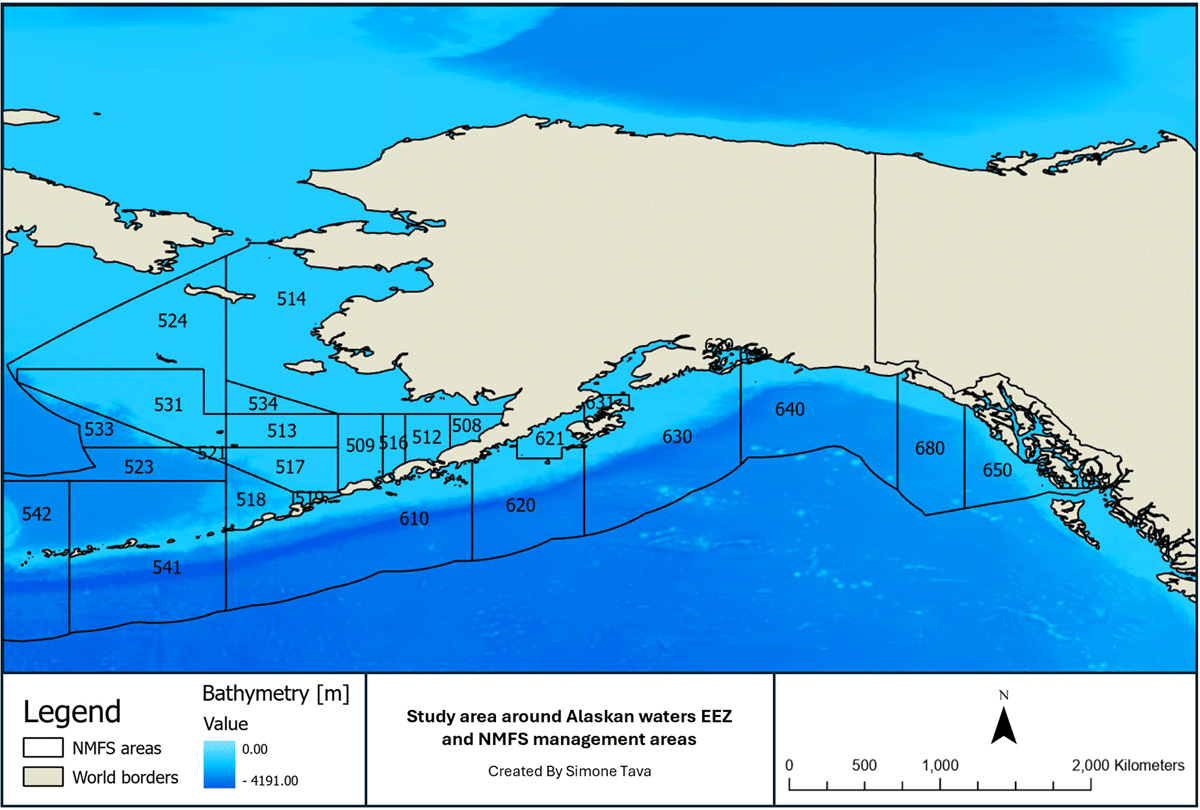
Figure 1
Study area within Alaska’s Exclusive Economic Zones (EEZ) from National Marine Fisheries Service (NMFS). Management areas from 509 to 534 belong to the Bering Sea, Aleutian Islands are 541 and 542, Gulf of Alaska is from 610 to 680. The map is obtained from the manuscript of Dietrich, Parrish and Melvin (2009).
Despite various inquiries, we were not able to obtain Open Access data in a GIS format and with ISO-compliant metadata for the metrics of fishing effort and the number of seabirds dead per hook (bycatch rate) in the Alaskan EEZ. Thus, authoritative maps from previous reports and scientific studies (e.g., Dietrich, Parrish and Melvin, 2009; NMFS, 2023) were used in this study to work from, i.e., two maps, for the time span 1995–2001. Further data details below.
2.2 Raw fishing effort (‘Number of hooks per year’) data as well as Raw ‘Number of Seabirds dead per Hook’ (NSDPH; ‘bycatch rate for seabirds’ and used as an ‘index of generic bycatch risk for cetaceans’) data for the study area
For the Alaskan EEZ study area we were not able to locate spatial bycatch data available as open access in a GIS database format to pursue an assessment of impact in a scientific and quantified manner. To overcome this problem, we employed the open source QGIS (3.28.0) and ArcGIS Pro (University of Alaska Fairbanks UAF license) software. Two maps were manually digitized there: the first represents the raw fishing effort of groundfish, and halibut longline fisheries expressed as average/hooks per year and digitized by us from Dietrich, Parrish and Melvin (2009; figure 1a within) (see below Figure 2). The second shows the mean bycatch rate in waters of the Alaska EEZ measured as ‘dead seabirds per 1,000 hooks’ (NSDPH, see below Figure 3), and also digitized by us from Dietrich, Parrish & Melvin (2009; figure 1b within).
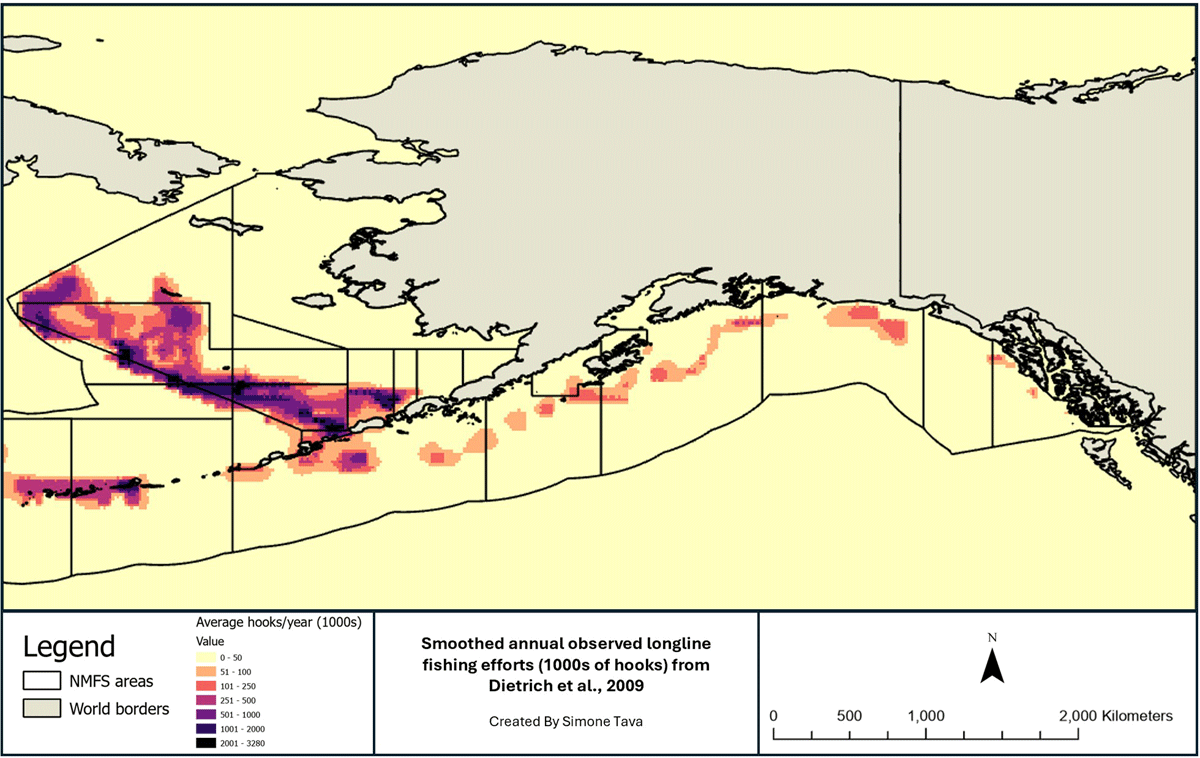
Figure 2
Raw fishing effort as average hooks/year within the study area digitized from Dietrich, Parrish and Melvin (2009) manuscript and smoothed for the study area.
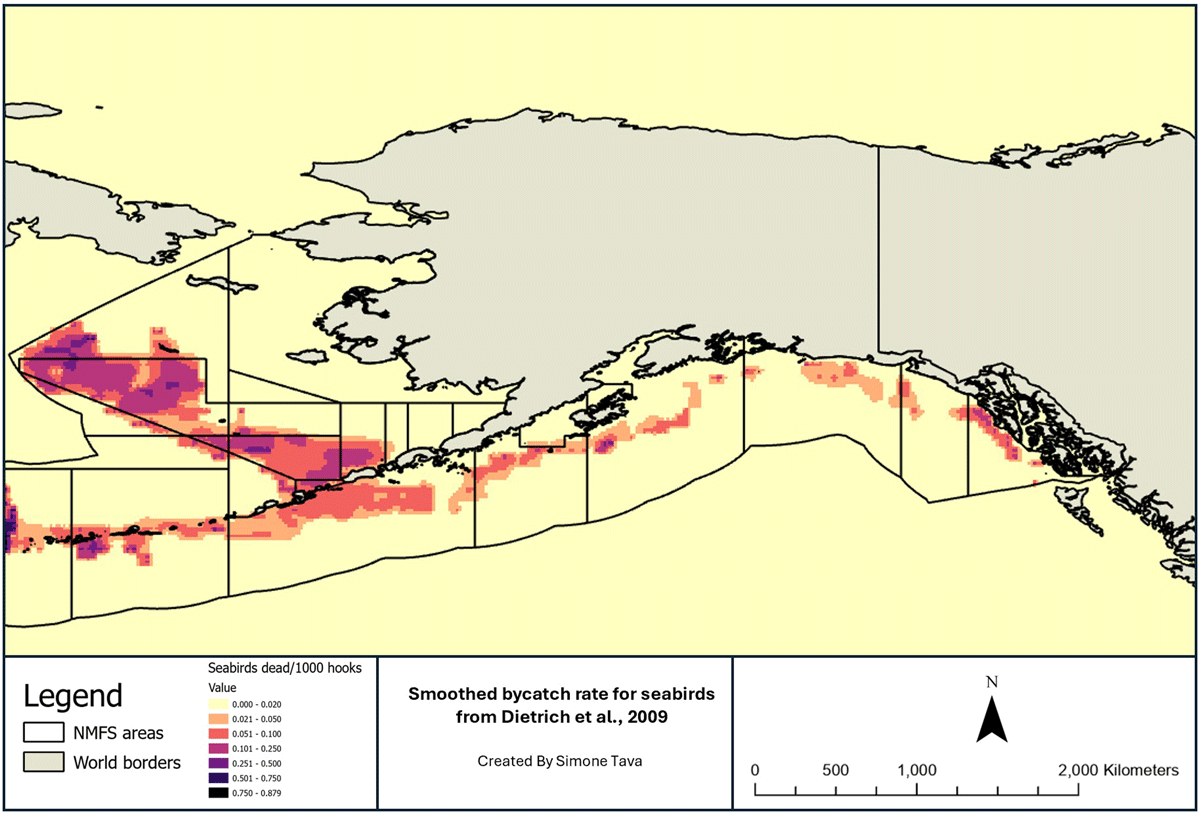
Figure 3
Raw bycatch rate, obtained by the number of seabirds dead per 1,000 hooks of seabirds digitized from manuscript of Dietrich, Parrish and Melvin (2009) and smoothed for the study area.
This second map may be perceived as an ‘index of generic bycatch exposure risk’. Because seabirds are reported at large, it will include an entire ‘cocktail’ of species in the absence of better information and thus may serve as an ‘index of generic bycatch exposure risk.’ We then used these raw data from Figure 3 and created a predicted ‘index of generic bycatch exposure risk’ covering the entire study area for a more-complete assessment, beyond what Dietrich, Parrish and Melvin (2009) had provided.
All the maps here and subsequently were used and created with the WGS84 (EPSG, 4326) projection, as described in their ISO-compliant metadata.
The Minitab-SPM software (EWHALE lab model license, Minitab-SPM software, 2024) was applied to score a new prediction of the bycatch rate (previously NSDPH) in the study area lattice with the Machine Learning algorithm Random Forest. The eight environmental predictors (description of these predictors in section 2.3.2 and Table 2) were used to model predictthe map digitized from Dietrich, Parrish and Melvin (2009), using them as predictors; hereafter this map is called ‘bycatch exposure map’ for the study area. The reasoning here is to create the best assessment of the bycatch data as a study area map to compare it with the RIO of the species, indicating the species most affected. These maps were compared to infer areas where the bycatch rate existed but was not yet assessed towards a more complete EEZ-wide assessment.
Table 2
Environmental predictors and sources.
| PREDICTOR | SOURCE | REFERENCE | GRID SPACING (°) |
|---|---|---|---|
| Sea Surface Temperature (SST) [°C] | NOAA World Ocean Atlas (WOA) | Reagan et al., 2024 | 0.250 |
| Nitrate [µmol/kg] | NOAA World Ocean Atlas (WOA) | Reagan et al., 2024 | 1 |
| Dissolved Oxygen [µmol/kg] | NOAA World Ocean Atlas (WOA) | Reagan et al., 2024 | 1 |
| Silicate [µmol/kg] | NOAA World Ocean Atlas (WOA) | Reagan et al., 2024 | 1 |
| Phosphate [µmol/kg] | NOAA World Ocean Atlas (WOA) | Reagan et al., 2024 | 1 |
| Sea Surface Salinity (SSS) | NOAA World Ocean Atlas (WOA) | Reagan et al., 2024 | 0.250 |
| Bathymetry [m] | ETOPO Global Relief Model | www.ncei.noaa.gov | NA |
| Distance from the coast [°] | S. Tava | ArcGIS calculation | NA |
| Coastline | ESRI | www.arcgis.com | NA |
All data we created and used are openly shared upon request as well as in Appendices A, B, C, and D.
The index ‘generic bycatch exposure’ was used for all species as a proxy. That was done in order to gain insights also on cetaceans for the study area, in which spatial data on bycatch was never examined yet, at least in Alaskan waters overall. As a validation of the Random Forest model for bycatch exposure, we used the RMSE (Root Mean Squared Error) as well as GRV files containing validation results, given directly from the SPM software and available in Appendix D of this manuscript.
2.3 Obtaining species prediction data
2.3.1 Presence only data (Step 1) for species-level bycatch impacts
Neither Alaska nor its EEZ have a species distribution atlas data yet. To overcome this problem, we employed basic species distribution model predictions using public open access presence only data (raw data) for the study species listed in Table 1: killer whale (Orcinus orca), pacific white-sided dolphin (Lagenorhynchus obliquidens), beluga whale (Delphinapterus leucas), harbor porpoise (Phocoena phocoena), red-legged kittiwake (Rissa brevirostris), glaucous-winged gull (Larus glaucescens), sooty shearwater (Ardenna grisea), northern fulmar (Fulmarus glacialis), short-tailed albatross (Phoebastria albatrus), and black-footed albatross (Phoebastria nigripes). Those were downloaded from the Open Access data source Ocean Biodiversity Information System (OBIS, 2024) mapper as csv files and transformed into shapefiles using ArcGIS Pro and open source QGIS. The occurrence data points that we downloaded from OBIS were then clipped for the Alaskan study area. A lattice grid of 0.3 degrees was created in QGIS as a shapefile and used to obtain information from the areas where the species did not have occurrence points.
2.3.2 Environmental predictors (Step 2)
For environmental predictor data, we downloaded eight shapefiles from Open Access sources and created layers using ArcGIS Pro and QGIS to infer the ecological niche of the species thus obeying data gaps and allowing us to create a new assessment for the study area of the bycatch rate previously estimated by Dietrich, Parrish and Melvin (2009). The predictors from the World Ocean Atlas (WOA; see Table 2 for all sources and URLs) were downloaded as points of a grid, the time period selected was ‘Averaged decades,’ and the available field used was the ‘Statistical mean.’ After the download, the dataset was clipped for the study area and cleaned for the non-existing values/gaps (–99999). Subsequently an Interpolated Distance Weight (IDW) method was used to obtain a smoothed grid surface of all the predictors in ArcGIS Pro for the study area overall. The bathymetry data was downloaded from the National Centers for Environmental Information (NCEI-ETOPO, 2024) as a geotiff file for the latest year 2022 version. The distance from the coast map was obtained by calculating the Euclidean distance/proximity of the points from the Alaska shoreline using the proximity tool in ArcGIS Pro. All the predictors and their data sources are listed in Table 2 below. The maps of the environmental predictors can be found in the Appendix B of this manuscript.
The lattice grid as well as the occurrence points of the species previously created were used to obtain point values of the predictors using the function ‘Extract Multi Values to Points’ in ArcGIS Pro. The lattice grid previously created contains the values of environmental predictor data for every grid point (aka ‘background points’), and the ‘species presence only’ file contains environmental values for the species presence only data. Both were exported as csv files and merged to obtain a file with presence/background data of a single species (P/A) creating the ‘Data cube’ used for subsequent analysis. The environmental predictors were all saved as geotiff files in GIS.
2.3.3 Ecological Niche model predictions with ML/AI ensembles to overcome lack of official Alaskan species ranges (Step 3)
To create predictive surface data Salford Predictive Modeler (SPM) software was used again to apply the ensemble Random Forest (RF, bagging) (see: Breiman, 2001a; Cutler et al., 2007) creating Relative Index of Occurrence (RIO) for the species respectively in the study area.
A RIO is obtained in RF for the lattice points, and it shows the suitability of habitats for the species (Grillo et al., 2024; Huettmann and Hueffer, 2021; Humphries, Magness and Huettmann, 2018; applications with Mi et al., 2017). The response values range from Low to High. From those points, an Inverse Distance Weighted (IDW) interpolation was again used to smooth the occurrence of the species in the study area. The distributions of the species as geotiff raster files are available in Appendix A of this manuscript.
2.4 Data Mining of species contributing to the predicted ‘index of bycatch risk’
We followed a multiple regression concept to determine which species will be affected and contribute to the predicted ‘index of bycatch risk.’
TreeNet (stochastic boosting) models were used in Minitab-SPM (Friedman, 2002; for an application see Yang et al. (2016), and Cai, Huettmann and Guo (2014) for specific model inference from the ‘trees’).
For a subsequent model fit and rank analysis, the TreeNet algorithm was then applied using the Minitab-SPM Software (Formula 3) to obtain which of the analyzed species (Tab. 1) is more affected by the bycatch exposure map revisited and created in this work. This model aimed to create a ranking of species involved (Table 3).
Table 3
Species affected by our modelled bycatch scenario in the present and future (%).
| SPECIES | PRESENT | FUTURE (2050) |
|---|---|---|
| Short-tailed albatross | 100.00% (1) | 100.00% (1) |
| Red-legged kittiwake | 36.77% (2) | 35.44% (6) |
| Killer whale | 20.56% (3) | 56.37% (3) |
| Black-footed albatross | 6.00% (4) | 68.01% (2) |
| Harbor porpoise | 5.94% (5) | 39.34% (5) |
| Sooty shearwater | 5.15% (6) | 24.23% (8) |
| Glaucous-winged gull | 4.75% (7) | 52.59% (4) |
| Pacific white-sided dolphin | 4.46% (8) | 29.66% (7) |
| Northern fulmar | 2.72% (9) | 14.84% (9) |
| Beluga whale | 0.00% (10) | 0.00% (10) |
As a validation of the TreeNet model, we used the simplistic ROC (Receiver Operating Characteristic Curve) for Learn and Test data, as well as GRV files containing further validation results, given directly from the SPM software and available in Appendix D of this manuscript.
2.5 Future scenario 2050 data
Finally, Alaska has no stated future vision or any associated data to go by for fisheries and bycatch So here we created a scenario dataset using the Random Forest (RF) algorithm to infer the future trend of the bycatch rates in 2050, i.e., where the risks approximately would be located and what species would be involved. This prediction was made using an assumed medium-impact scenario habitat predictor for the future as an expected increase of +3.0°C of global Sea Surface Temperature (SST) (Holsman et al., 2019). While this is a rather simplistic approach (compared with more sophisticated ocean circulation and sea ice models, e.g., Hunke, Lipscomb and Turner, 2010), it might allow for general first trends in the study area, in the wide absence of mutually agreed upon easy-to-use GIS ocean-model and habitat layers (e.g., compare with Antarctica in Huettmann and Schmid, 2014; Mueter et al., 2021; Polyakov et al., 2020). Similar as done before, in Formula 3, the TreeNet algorithm is then again applied to this future map of predicted bycatch risk 2050 with the predicted distribution of the species for 2050 in order to learn which ones would be more affected by this trend and whether there would be a specific conservation effort needed for the future management plans of those species in the area. Also, the ranking was developed for species more influenced by the future trend of global warming (Table 3).
For an overview, the overall workflow used in this study is presented in Figure 4. All the formulas that explain the predictions can be found in the textual Appendix. The last version of the data used to create the models can be found in Appendix D as csv file.
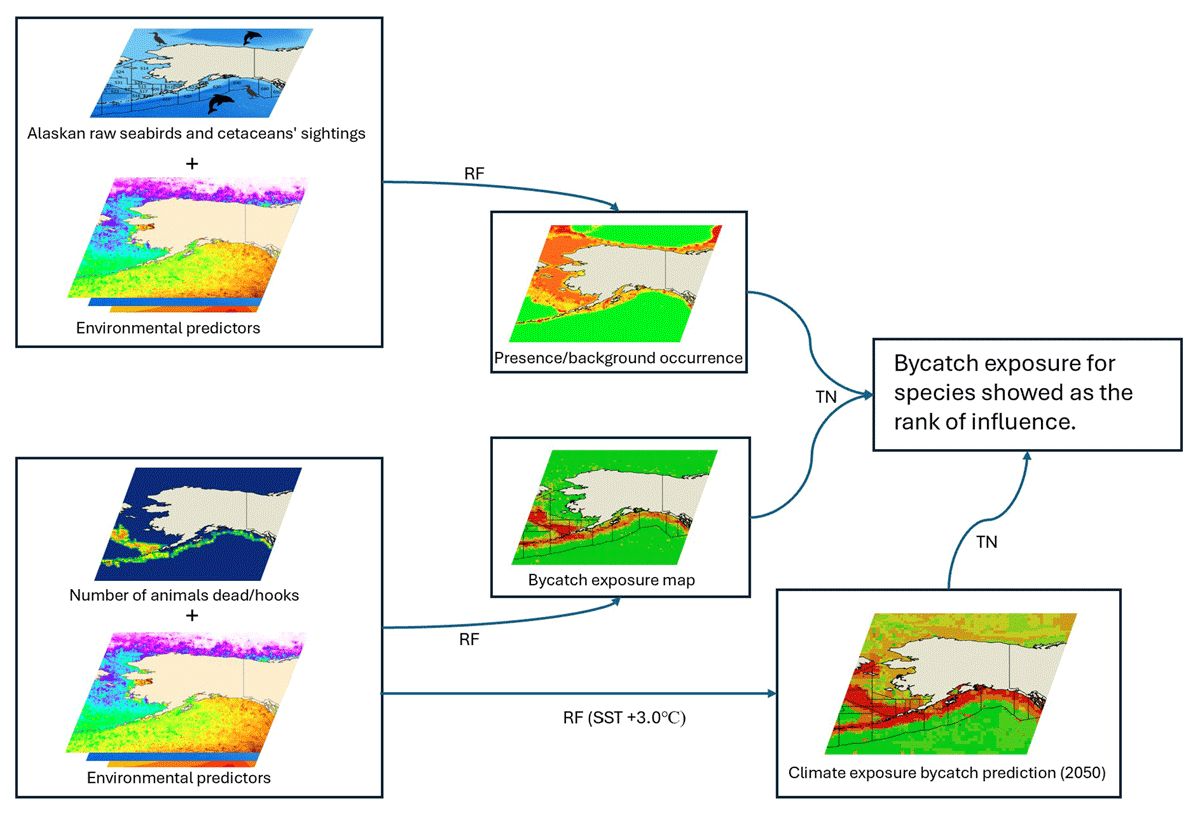
Figure 4
Workflow and steps used in the study, from the raw points of species in Alaskan waters to the predictions of the bycatch of present and future. The lines which connect the workflow stand for the models used: RF = Random Forest; TN = TreeNet.
3. Results
3.1 Data compilations
Figures 2 and 3 show the publicly spatial available raw data for the fishing effort and for the bycatch risk in the study area that were digitized for this work. While of lower sophistication and relatively coarse, this presents the first ever publicly available GIS layer and quantified fisheries bycatch data available as Open Access and with ISO-compliant metadata for the Alaska EEZ. We perceive that this is good progress beyond just data. Those figures quantify the evidence, respectively, for the fishing effort of longline fisheries for groundfish and Pacific halibut, as well as the bycatch risk for seabird species in the Alaska EEZ, 1995–2001 (both maps can also be found in the Appendix C as GIS source for further assessment and scrutiny).
3.2 Number of Seabirds dead per Hook (NSDPH, ‘predicted bycatch rate for the study area’) data
We also tried to assemble the best public assessment using environmental predictors for any species bycatch risk in the study area (Figure 5). We used it to evaluate its influence on seabirds and marine mammals for the present time (1995–2001) as well as for the future scenario (2050) as a generic ‘exposure map’ for the study area (Table 3). The relative index of occurrence (RIO) of the species that we used for the species impact rank analysis was obtained and the distribution maps created with Machine Learning (TreeNet) and Open Access data are available in Appendix A.
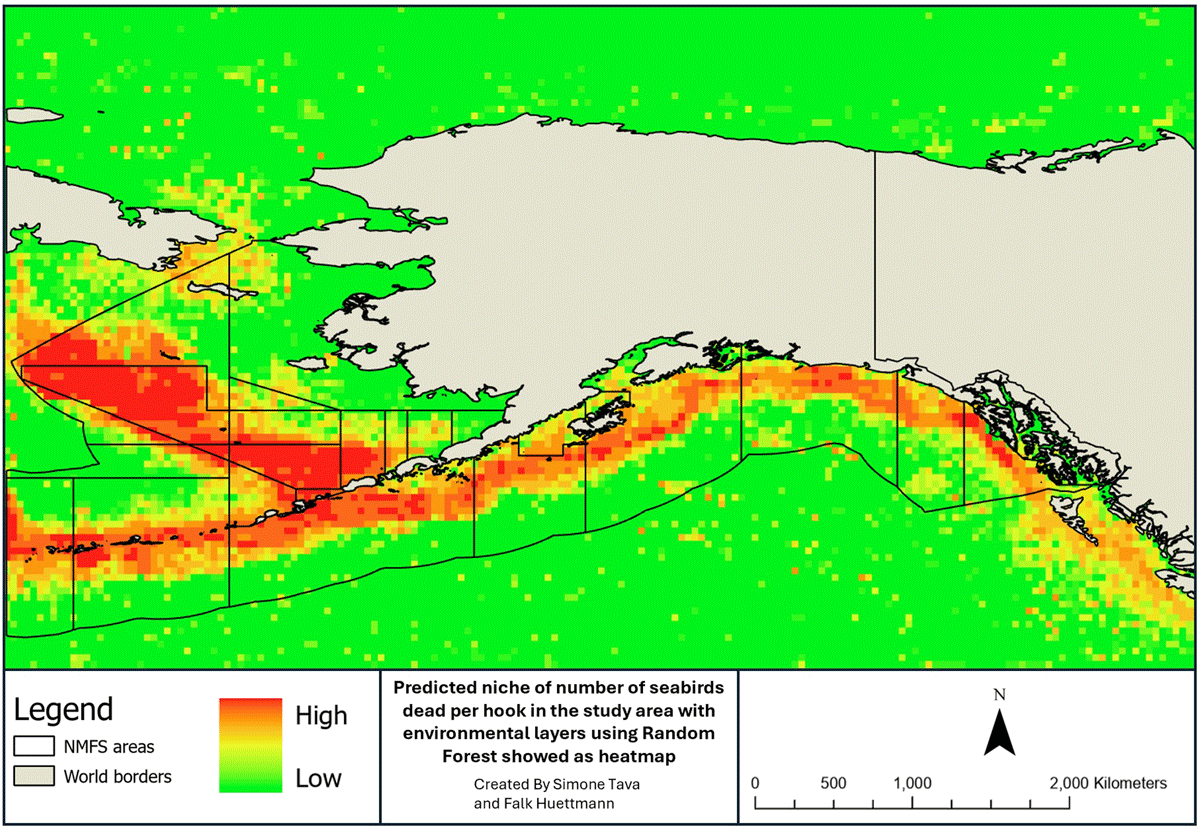
Figure 5
Predicted bycatch exposure assessment for predicted ecological niche model pixels with seabirds and marine mammals revised using environmental predictors and presented as a heatmap. RIO values range from Low (0.0) to High (6.26).
Using the Random Forest algorithm, here we were able to create the first predicted map data of the bycatch risk for the study area based on the eight environmental predictors (Figure 5). This map shows a different estimation of the bycatch risk than that previously reported by Dietrich, Parrish and Melvin, 2009). A closer comparison with the initial map in Dietrich, Parrish and Melvin (2009) actually shows a larger bycatch footprint and thus confirms what is well known in the public record. An inherent underestimation of the bycatch areas in the Alaska EEZ and likely for US fisheries at large is shown. The resulting differential map between the initial estimate by Dietrich, Parrish and Melvin (2009) (= Number of seabirds dead per hook previously digitized) and our scenario (with Random Forest), created using this workflow shown in Figure 4, led to identify also the NMFS areas where unwanted catch was actually not well estimated. Some management areas, such as 517 and 531, appear to have more by-catch problems than others (Figure 6) although the problem remains widespread throughout the EEZ and is widely not really addressed. For this model, the validation using the RMSE is 0.3423, showing a good fit.
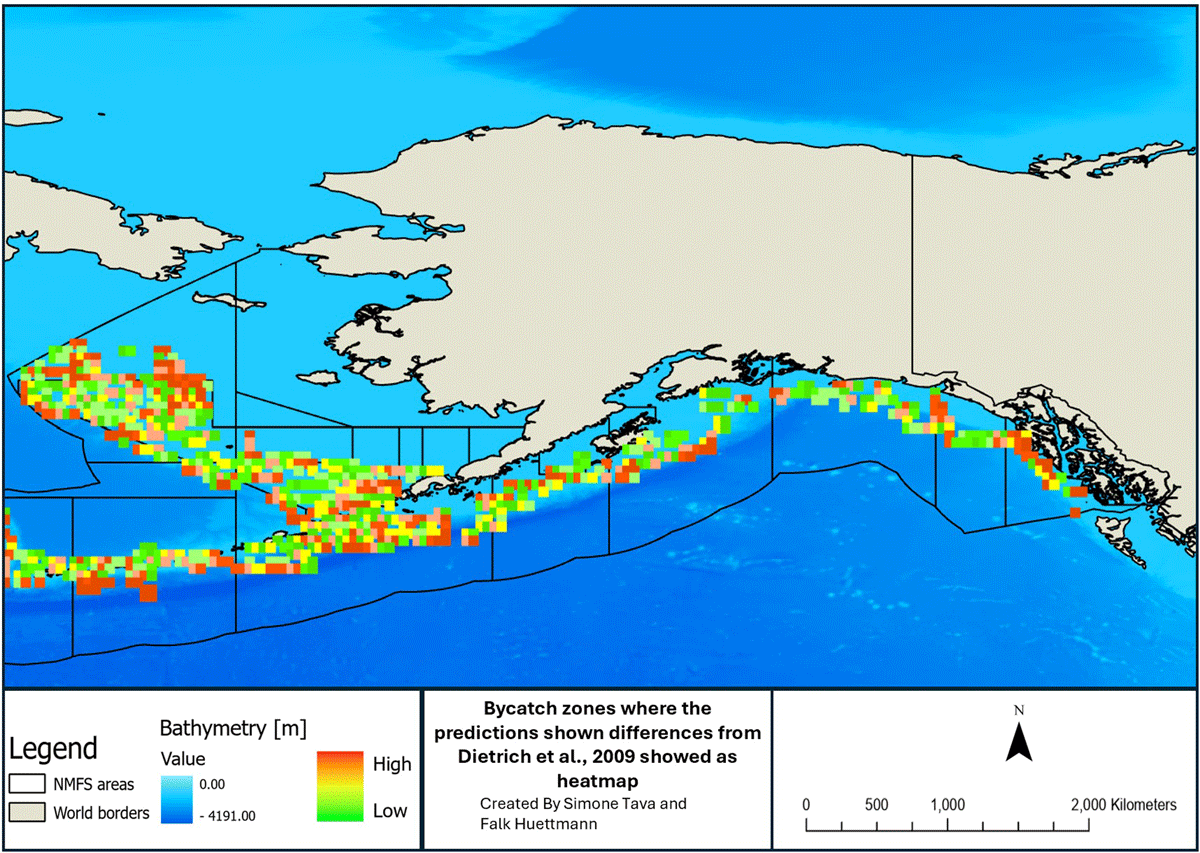
Figure 6
Differential map from our assessment and bycatch and the one found in literature (Dietrich, Parrish and Melvin, 2009) presented as a heatmap. RIO values range from Low (0.0000001) to High (2.550000). With this map we intended to show which of the areas are affected by an underestimation of bycatch, going from values around zero (if pixels have not an underestimation) to values around 2.55 (pixels have highly bycatch underestimation).
3.3 Species contributions to predicted bycatch risk in the study area
In the absence of official data for Alaska, we used a model to identify what contributes to the bycatch. The species affected by the fishery’s unwanted catch are reported in Table 3. Their influence is shown as the percentage rank contributing to the species prediction model (metric of variance explained). The TreeNet model for the current time period explains ca. 80% of the variance of the bycatch rate prediction on the few selected species. For this model, the ROC for Learn Data was 0.9332 and for Test Data was 0.8972. These two ROCs showed a pretty high fit and accuracy of the model. As in decent agreement with Dietrich, Parrish and Melvin (2009) it is shown that the two most-affected seabird species in Alaska EEZ are the short-tailed albatross and the red-legged kittiwake. The albatross being particularly affected by population decline deriving from the bycatch issue. The short-tailed albatross is endemic to the North Pacific and was an endangered species at the time of study (see Piatt et al., 2006). The red-legged kittiwake is also endemic and in decline, already labelled by IUCN as ‘vulnerable’ (Orben et al., 2015) but lacking effort in times of global change. While it might be perceived that marine mammals would not so much’ be affected by the bycatch in the current scenario, this assumption is easily misleading due to the vast size of the study area and thus, the ecology of scale; due to the magnitude of the impact one may call the EEZ of Alaska easily a ‘seascape of death’ (for quantification see Pauly and Zeller, 2016). Further, the ‘Ecology of Fear’ (Zanette and Clinchy, 2019) matters for those species and adds additional major concern. In reality, marine mammals are dramatically stressed, affected in their behavior, and many are killed in the process of fishing—with lag affects—and in those related activities in which humans encroach on their ecological niche space, e.g., via synergy effects from fishing fleets, sonar waves, engine sound, contamination, submarines, chronic oil pollution, nets etc. (e.g., Chambers and James, 2005; Erbe et al., 2019). Killer whales are the first mammal species in the model rank and otherwise show a relatively high contribution in this model. That species is already widely discussed by the public as a bycatch victim, with metrics of decline, e.g., missing offspring (e.g., The Alaska Beacon, 2024). Due to the large study area, and considering uncertainties, this finding should not be ignored. It easily implies larger impacts at large scale and can certainly impact behavioral aspects (see Dolman and Moore, 2017 for behavioral perspectives of bycatch; see Mul et al., 2020 for short-term behavioral implications of herring fisheries on Norwegian killer whales).
3.4 Threat assessment model
This study also allowed us to obtain the first as well as basic data for trends using a future bycatch prediction, as it is to occur in a changing marine environment and when no relevant mitigations occur within a well-developed management plan. The scenario shows as a first future prediction trend that the bycatch issue will increase. Our data show that the species and the communities affected will clearly change, with an ongoing rising trend. However, the composition within that trend remains somewhat uncertain for the needed management of the species bycaught. The scenario that this study obtained in the future is shown in Figure 7. This prediction suggests that in the future, most NMFS management areas in Alaskan waters will experience a relevant increase in the impact of bycatch on marine resources. In the prediction data for 2050, the endemic albatross seems to be the most affected species by the bycatch prediction and killer whales should be the first marine mammal species affected (ranking #3). For albatrosses, the North Pacific has three species, and all are of a certain conservation concern (the short-tailed albatross debounces but still has a very low population overall). For the time of study, short-tailed albatross was endangered (BirdLife International, 2018) but not given such consideration when variances and numbers were unknown or vast underestimated. This situation still has not changed.
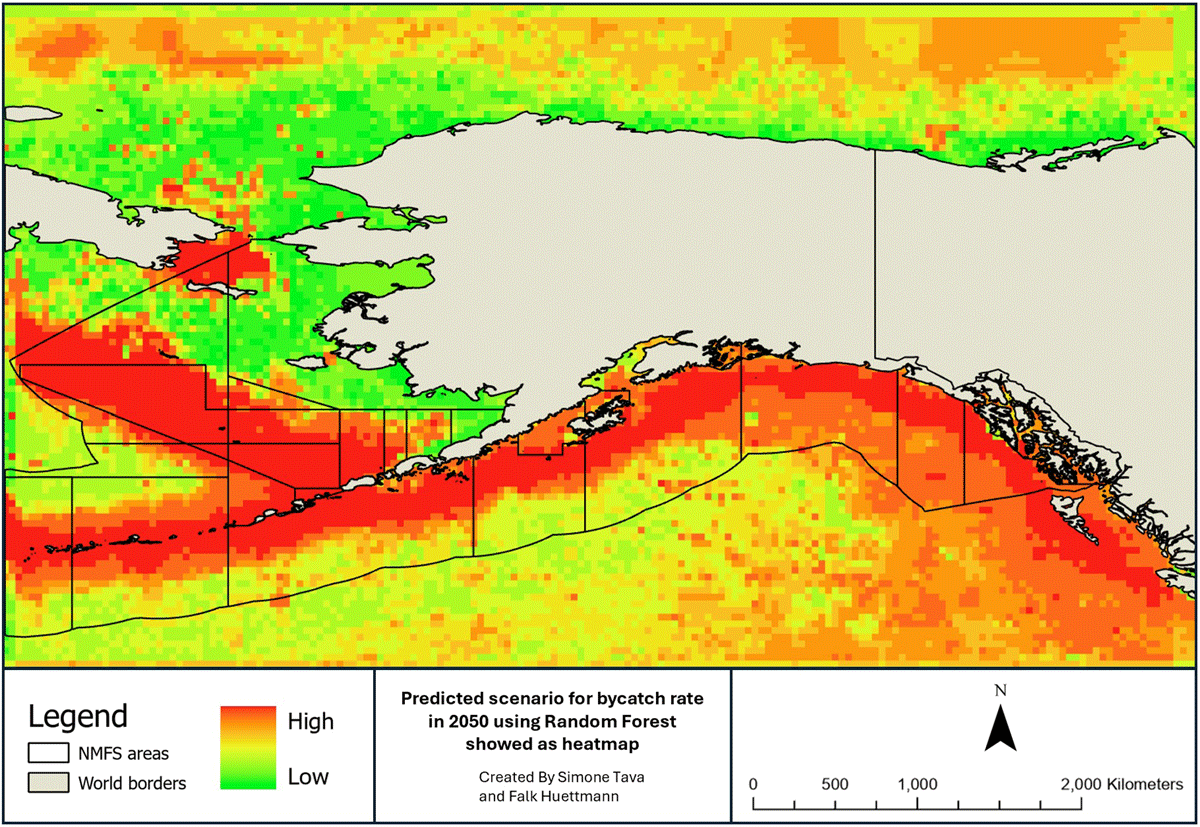
Figure 7
Scenario created from the bycatch exposure for 2050 using the eight environmental predictors and considering a raising in Sea Surface Temperature of 3.0°C. The map is presented as a heatmap. RIO values range from Low (0.000) to High (4.574).
4. Discussion
For this project, we investigated bycatch data and data content, and we inquired about publicly available spatial datasets, but found none (addressing a clear lack of management data for bycatch in the US). We had to develop and curate our own spatial bycatch dataset. The Magnuson-Stevens Act in the current version still lacks any relevant digital bycatch data sharing, useful formats and open access concepts other than just the annual summary bycatch report in PDF online (i.e. National Bycatch Report: Benaka et al., 2019). With this work we want to promote a renewed discussion and suggestion of Open Access data, code and formats for meaningful and modern research. Bycatch estimation layers explicit in space and time (coordinates, time, and species caught) with ISO-compliant metadata will be available and mandatory under the Magnuson-Stevens Act and in line with generic best professional practices, e.g., Huettmann and Arhonditsis, 2023 for overview in Informatics and Ecology).
As a good starting point, the US and associated laws can learn here and improve from the actual EU legislation and associated data mandates, for instance (Dolman et al., 2016). In Table 4 our data are listed and suggested to be considered in the Magnuson-Stevens Act for meaningful science-based management based on actual data.
Table 4
Fishery and bycatch data in the Exclusive Economic Zone of Alaska and under the Magnuson-Stevens Act.
| DATASET | DATASET DESCRIPTION | DATA FORMAT | METADATA | PRESENCE IN MAGNUSON-STEVENS ACT |
|---|---|---|---|---|
| Bycatch spatial data (Dietrich, Parrish and Melvin, 2009) | Spatial bycatch data of seabirds in Alaskan EEZ | Digitized data This work aimed to have it in GEOTIFF and shapefile | No | Yes |
| Predicted bycatch map (this work) | Prediction of influence of bycatch on marine megafauna | GEOTIFF and shapefile | Yes (this work) | No (to be included) |
| Predictors | Variables used to create distribution maps | GEOTIFF and shapefile | Yes (this work) | No (to be included) |
| Future prediction | Prediction of influence of bycatch on marine megafauna for, 2050 | GEOTIFF and shapefile | Yes (this work) | No (to be included) |
4.1 Bycatch in a professional and global Open Access context
Science and its data can help to study and to improve management. In fisheries, it can for instance improve the quantification of bycatch explicit in time and space for better policy and sustainability. Such a science-based management with actual and meaningful data supports sustainability and natural resources, especially in somewhat ‘wild’ remote areas. It’s a peculiar finding here that Open Access data and ISO-compliant metadata on the topic are not available, but as a scheme usually are supported elsewhere by legal policies and best professional practices worldwide (e.g., Freedom of Information Act FOIA, Biodiversity Data Agreements, FAIR principles and with many NGOs: Jacobsen et al., 2020; see also Huettmann, 2015). The Alaskan bycatch topic and EEZ simply exposes a wide lack of an otherwise widely used and promoted culture of shared data elsewhere, as well as missing transparency and scrutiny for a public trust resource (Magnuson-Stevens Act, 2007 and amendments) with scientific etiquette explicit in space and time. Here we tried to assess the topic and how it can be overcome by starting to create the first Open Access bycatch science for the Alaskan EEZ. While we have achieved some progress, it’s obvious that one is still far from fully achieving this goal. Our assessment just covers a fraction of the species affected and of fisheries involved. And with so much subsidy/international funding provided for, and involved in, these fisheries it makes the challenge even harder. The Alaska EEZ internationally exchanges fish quotes, and Alaska received for instance, $50 million for 2020 in fisheries assistance (Alaska Policy Forum, 2024), distributed based on the plan of the ADFG (ADFG, 2024b). Just in 2021 it received $40 million in fisheries assistance from the Consolidated Appropriations Act (2024). The notion of mandated data remained unaddressed. Despite that, Alaskan fisheries are still widely referred to as private and also being among the best managed fisheries globally (Raymond-Yakoubian, Raymond-Yakoubian and Moncrieff, 2017), yet we find that most relevant details and data are actually not available, not collected with a relevant format, nor well scrutinized (Pauly and Zeller, 2016 for statistics), including metadata, management science protocol and an EEZ species distribution atlas (see Brown et al., 2000 for Canada; North Atlantic has a species distribution atlas specific for seabirds: Price, Droege and Price, 1995). Whereas the decision-process at large remains unclear and ‘in the dark’ lacking public data and engagement.
Considering the sheer size of the resource and extraction effort easily ongoing for over 100 years in the large and remote study area, only a few studies have been conducted in relation to fisheries with marine species and bycatch in Alaskan waters (e.g., Dietrich, Parrish and Melvin, 2009; Melvin et al., 2006; Melvin et al., 2019; Dietrich, Kuletz and Moon, 2025); similar is true in many other areas of the world (e.g., Ancha, 2008; Komoroske and Lewison, 2015; Mustika et al., 2021; Ramírez et al., 2024; Rey and Huettmann, 2020; Swimmer, Zollett and Gutierrez, 2020). Virtually none of these studies provide consistent, or any science-grade data to use for science transparency and repeatability. Data are not in good modern format like in commercial or Open GIS files or in public library repositories like dSpace/scholar works or GitHub with confidence (see Carlson, 2019 for Svalbard Repository data sharing topic). Our work, on the other hand, can be considered as the first assessment that uses Machine Learning (ML) ensemble algorithms, GIS and an Open Access data platform to investigate and present the bycatch topic in Alaska for betterment and sustainability. Using this approach linked with GIS allowed us to show inherent variance and underestimates and deficiencies in published bycatch rates, and then to quantify those explicit in time and space (see map data in Figures 5 for present and 7 for future) and for areas where species conservation urgently needs to be improved. Our work allows us to set priorities in a quantified fashion.
The future outlook, however, seems rather grim (e.g., man-made climate change unabated and see Pauly, 2010 for overfishing status) and it features even more accelerating and chaotic impacts., e.g., brought by governance. Data issues seem to be the least of the priority, thus far. At minimum, our results show already a major impact and huge threats to the sustainability of the species and the environment in Alaska overall, as well as beyond US, in the industry and globally. This means it can lead to further environmental damage and destruction. These damages can reflect on the economics of a country, confirming that ecology and the economy are tightly related (Czech et al., 2004). Therefore, economists as well as politicians should consider the limits of a finite resource and thus involve ecological expertise in their decision processes (e.g., Chapin et al., 2010; Czech et al., 2004) but with data perspectives included and budgeted for. After all, human economy and well-being are embedded in the ecosystem and its limits (Daly and Farley, 2011); the digital economy in real life (Huettmann, 2015). When the overlap data approach of the bycatch risk map and the relative index of occurrence (RIO) of seabirds and marine mammals for same pixels in the study area were used, to no surprise it showed that seabird and mammals communities are getting negatively affected by the current management of marine resources. Likely, a more thorough data-focus would present a better and more severe picture. All awhile the data and subsequent science at those locations are non-existent, not done well, nor repeatable or transparent and not according to Open Access principles and best professional practices (e.g., Huettmann and Arhonditsis, 2023). It remains a good question to link those at-sea numbers to seabird colony monitoring. While the latter lack sensitivity, populations of species like the Common Murre have recently already decreased by ca. 50% in Alaskan waters owing to climate change (see Renner et al., 2024, for a single marine heat wave impact). Those are dramatic changes that affect fish, the fisheries profession and business, and the ecosystems at large, and human well-being. Thus far, none are truly addressed.
4.2 Institutionalized data deficiencies of bycatch, and cultural acceleration in the last decades
Our results show that around the Alaskan EEZ there is an evident lack of, and associated underestimation, of bycatch data (Figures 5 and 6), and here our work tries to progress and obtain the best estimation of a real-world scenario. Confirming our results, missing open access data and the underestimation of bycatch has already been implied in US fisheries as a generic feature (Savoca et al., 2020).
4.3 Alaskan EEZ and foreign fleet data
Industrial usage of the Alaskan EEZ without proper data effort is clearly resulting in a wider plethora of problems (such as the exploitation of migratory and marine fishing stock in Alaskan EEZ hardly accounted nor managed; Zolotov, 2021). For most seabirds, the Migratory Bird Treaty Act applies, but is essentially not surveyed or accounted for either due to access and enforcement issues in the remote EEZ (for details see example in Humphries and Huettmann, 2012 for wide lack of enforcement capabilities even within most of the wider EEZ and boundaries). These foreign fleets in the EEZ of Alaska came, for instance, from Asia (Japan, China, Indonesia and Philippines) and Russia, beyond others (Zolotov, 2021), whereas proper data are missing. Overexploitation performed by these fleets can create further impact because of their various unknown methods. Use of ‘bad gear’ and lost gear creates additional problems. This promotes overall a further bycatch underestimation in the area without relevant data for the present day and an increased impact and many uncertainties in the future. It influences the reports of species caught and how documented, leading to a difficult and not-optimized—hardly defendable—management and science of the area’s aquatic resources (i.e., management of Alaskan EEZ waters and their sustainability: Blackford, 2009; Waters et al., 2014). In support of our statement, the Global Fishing Watch (GFW, 2024) shows clear evidence, as some minimum map data readily available, for the public to see where the fishing effort is located in the waters globally: it’s obvious that Alaskan waters are overexploited with unreported bycatch data, and moreover, details on the science are missing and not really made publicly available, hardly well-managed or improved.
4.4 Marine fisheries sustainability
The results we obtained stand in contrast with Loring’s (2013) statement citing Alaskan fisheries as one of the best-managed fisheries. Instead, it easily aligns with Pauly (2010; see also Sea Around Us website), who showed that fisheries in US are not always so well managed, and the current overfishing trend is often unsustainable. Further, it widely fails on a modern digital Open Access reporting scheme online explicit in space and time. To achieve an improvement toward sustainable fisheries management, the utilization of market tools as eco-certification has already been said to increase this goal (Salomon et al., 2011). However, in reality, it has not worked nor does it have a digital Open Access data aspect, for example, due to the certification process costs (Pérez-Ramírez et al., 2012) as well as incomplete fleet monitoring and lack of open access data (in Alaska just a few stocks are monitored, with tiny fractions of the fleet and virtually no data are available open access as evidenced here. The fisheries observer data are either lacking with many fleets not well covered, or video recording data are private and not for public access, hardly carry a scientific research design for inference). What is shown in our assessment, based on Open Access data and models, creates even more doubt on the credibility of (international) certification of sustainable fisheries (Cho and Taylor, 2020; Shelton, 2010). The Responsible Fisheries Management (RFM) and the Marine Stewardship Council (MSC—as one of the most widely recognized schemes) certifications—are required by the stakeholders to identify sustainable fisheries for the US market but lack a focus on mandated Open Access.
4.5 Rank of the species and data affected
Species are differentially affected by the mortality and lag effects caused by bycatch owing to their natural-history patterns. As shown in Table 3 it appears that, numerically, our selected seabird communities are more affected than cetacean communities using bycatch as a driver. In our data, the species most strongly affected—also by proportion of its population size—is the endemic short-tailed albatross. This species is more affected than others due to its relative numbers (ratio of low population size vs individuals caught/dead) and its extreme k-selected life strategy (delayed maturity, low reproductive rate, low natural mortality rate, longer lifespan (~80 years), etc.) characterizing albatross species (Deguchi et al., 2014; VanderWerf and Young, 2011). This species, in Alaskan fisheries, is subject to a triple whammy (endemic, long-lived, prime victim). Worldwide, generally, albatrosses with petrels and shearwater are known to be the most-affected seabird species through bycatch in longline fisheries, with vastly unsustainable levels of mortality (Anderson et al., 2011; Croxall et al., 2012; Eich et al., 2016). The short-tailed albatross, as reported by NOAA in, 2020, are incidentally caught ‘on rare occasion’ (Krieger and Eich, 2021). However, our assessment data shows instead, in times when they were labelled ‘endangered,’ that this is the most influenced species by the spatial model of bycatch. Further evidence is provided by studies like Smith (2024) showing that wider underreports occur. That would indicate that something is poorly reported and not well classified for risk in this species’ accidental mortality. In the meantime, the species meager population increased slightly, likely due to the intense efforts at nesting grounds in Japan funded in part by the US. It may be an initial success and the turnaround of a dire situation, with huge costs though. Either way, we are still very far away from the initially large populations for such species through time though (Carter and Sealy, 2014). Meanwhile mandated Open Access data and a true research sampling, with an accepted and effective research design or proper detection surveys for real numbers available open access in professional standard are clearly missing in the extensive marine range of the species. There is almost no relevant science or subsequent Open Access data on the topic. Unfortunately, the biggest impact of the bycatch prediction for 2050 shows that this species will probably be again the most affected species, closely followed by the black-footed albatross (e.g., breeding in Hawaii: VanderWerf et al., 2019). We think that albatrosses will likely remain a key species of bycatch for decades to come and thus have a grim conservation outlook (as per Croxall et al., 2012).
Other species that we tested in the data appear relatively less affected by the issue, although northern fulmar should be noted. For this species, our results differ from the estimation in groundfish fisheries, whereby this species in 2021 was the second most occurring seabird in the fisheries (Tide and Eich, 2022). Northern fulmar, like albatross, is a long-lived, k-selected species and is one of the most affected seabird species (Baetscher et al., 2022), comprising more than a half of the seabirds accidentally caught in Alaska groundfish fisheries (Benaka et al., 2019) as well as in longline fisheries worldwide (Anderson et al., 2011). In our assessment, the species seems not to be so much affected in the present scenario, unlike the future scenario, reaching around 14% in the rank of affected species, even if it will be again the last species in the ranking. The populations of seabirds, as well as other species, are also affected by another climate issue, the increasing number and intensity of heatwaves (Smith et al., 2023). In Alaska, a recent analysis shows that more than 50% of individuals in populations of common murres (Uria aalge) dyed after a large heatwave in 2014–2016 (Renner et al., 2024). As well in this case, these numbers do not really reflect pro-active and effective management of natural resources, ecosystems and contamination levels (all major cities in Alaska feature large coal-fired plants, as well as state-wide mining and an intense oil & gas industry effort).
This situation demonstrates the importance of unified effective science-based conservation management and knowledge creation to resolve the bycatch issue in order for progress and better governance to be achieved with a valid legal framework.
In our present and future prediction data, killer whales are the most influenced cetacean species by accidental catch and for a species facing many other anthropogenic impacts. For instance, the interaction of fisheries with orcas occurs in many NMFS management areas (Dahlheim, Cahalan and Breiwick, 2022; Olsen et al., 2020; Peterson et al., 2013; Trites et al., 2007). Already the reduced or missing reproduction cohort for this species in 2024 should be of major concern, in addition to damage not yet recovered due to the Exxon Valdez oil spill 25 years ago (EVOS; Fraker, 2013; Short and Maselko, 2023). More details of a widely acknowledged public discussion of those topics can be readily seen and are available, e.g., The Alaska Beacon (2024).
Looking closer to the future scenario (see also more in-depth work of ocean modelers (e.g., Overland and Wang, 2007; Van Vuuren et al., 2008), the environment will change constantly and warm up, and it will create an attainable new scenario for human activity as well as it will affect marine ecosystems and species, re: warming and borealization (e.g., Polyakov et al., 2020). This is already confirmed by the prediction trend assessed in our work for 2050. The bycatch map (Figure 7) shows that in the future this phenomenon will increase in the waters around Alaska. The species affected will change in type and magnitude. It means that the anthropogenic impact on this species can be strong and have effects on killer whale’s populations, and with data hard to come by, thus far (arguably, the current trend to attach more devices on animals will not halt the roots of the problem at all).
4.6 Conservation action required with a data focus
More than 20 years of bycatch research has been conducted, with a continued increase in species so-called ‘accidentally caught’ by fisheries. This study shows how far humans still need to go to resolve one of the biggest issues related to marine megafauna populations, in Alaska and likely globally: unwanted killing of species in industrial efforts. While not intended, these deaths are not just an accident. These deaths essentially occur by the design of ‘allowing so-called modern’ fishery methods made effective to catch animals (fish being the target), as an inherent part of industrialization, capitalism, and the associated federate governance. This happens under a UN framework whereas relevant data or Open Access platforms are widely missing without allowing for a science-based professional conservation management.
As our data show, the lack of an effective conservation program in the area, with a huge non-reported bycatch of marine megafauna including a future perspective, will not be sustainable. Using this work, we show vast misconceptions in the public records and without a proper database. In addition to mandatory Open Access policies, we recommend the review of an effective Marine Protected Area (MPA) strategy of Alaskan Exclusive Economic Zones. We also recommend the institution of no-fishing zones with the aim of limiting the bycatch of marine megafaunal communities and promoting sustainability. We think that to create a better conservation plan, focused on the conservation of marine top predators, an extension of MPAs can urgently be examined and taken into consideration by the stakeholders and decision makers, once proper data exist.
As this study shows, arguably, the management of Alaskan fisheries is in a crisis state (more details shown in Table 2 of the textual Appendix). Here we try to provide some constructive paths forward, setting the stage for the use of open access data as platform, GIS and machine learning algorithms, rather than laissez-faire, linear regressions and parsimony (Humphries, Magness and Huettmann, 2018). This recommended workflow is a start and can be implemented with the usage of real and new spatial data of generic bycatch risk, in order to have a better understanding of the issue in Alaskan waters.
5. Conclusion
Despite decades of science, a mandated open access data platform was never set up and developed, and indirect impacts of industrial fishing activities are not well documented. Most fisheries catches are not correctly reported, are ecologically underestimated overall and are not following necessary rules and best practices. Any deeper and a more honest look—like done here—show serious errors and doubts, with damage to marine megafauna and ecosystem, in the sustainability management framework of fisheries in Alaskan waters, despite their placement in the governance framework of Magnuson-Stevens Act and UNCLOS. None carry a relevant underlying Open Access data platform with ISO-compliant metadata. Future research and subsequent revision are fundamental, and workflows like the one presented here, involving Open Access, ML/AI and GIS to understand and address our comprehension of bycatch, offer a promise of improvement. Our work quantifies shortcomings, affecting the level of doubts about the true sustainability of the fisheries, as practiced. Debate is now possible that lead to future investigations and improvements.
Otherwise, because of the current and ongoing lack of acknowledgement and mitigation based on data, and unless cultural changes and good governance are made for betterment, the future of the oceans remain grim, along with associated food security in Alaska, US and globally.
Appendices
Appendices A, B, C, D with Open Access data (with ISO compliant metadata) and the textual appendix are freely available on dSpace platform, accessible from this link: https://scholarworks.alaska.edu/handle/11122/16225.
Acknowledgements
S.T. acknowledges his family and friends, and C. Tagliavini, that helped to pursue the idea of visiting the—EWHALE lab—UAF in Alaska. S.T. acknowledges also F. Huettmann for the opportunity to collaborate.
F.H. acknowledges the data providers, as well as the support by E. Huettmann and H.K. Berrios and also teams Chrome and Bee1–17. This is EWHALE lab publication #353.
Competing Interests
The authors have no competing interests to declare.
Author Contributions
Project idea and initiation by F.H., fine-tuned by S.T. Data were compiled and searched by S.T. and F.H. for several years using public sources, online repositories and public inquiries; metadata by F.H. and S.T. Maps were digitized by S.T. Models were done by F.H. The first draft was made by S.T., and other drafts were edited and accepted by both S.T and F.H.