
Table 1
Layers of our atmosphere.
| LAYER | DESCRIPTION & RELEVANCE TO HUMANITY |
|---|---|
| Troposphere | Closest to our habitat–stretching up to 10 km above earth. Its temperature decreases inversely with distance from the centre of the earth (approx. per kilometre) (Omrani et al., 2022). |
| Stratosphere | Consists the majority of atmospheric ozone, which absorbs ultraviolet radiation and protects us from potential health risks. It is characterised by high temperatures over summer and lowest over the winter period (Xu et al., 2023). |
| Mesosphere | The temperature varies inversely with vertical height above ground (Laštovička, 2023). |
| Thermosphere/Ionosphere | Absorption of energetic ultraviolet & X-ray radiation from the sun, thus temperature increases with vertical height. They also vary between night and day as well as between seasons. It reflects and absorbs radio waves, allowing global radio wave transmission (Goncharenko et al., 2021). |
| Exosphere | Contains mainly oxygen and hydrogen atoms, but they rarely collide - they follow “ballistic” trajectories under the influence of gravity (Janches et al., 2021). |
| Magnetosphere | The outer region surrounding the earth, where charged particles spiral along the magnetic field lines, with the earth behaving like a huge magnet (Lu et al., 2022). |
Table 2
Selected key air pollutants.
| DATA ITEM | DESCRIPTION | DIMENSION & COMPLETENESS |
|---|---|---|
| (FSPMC) | Fine Suspended Particulates (FSP) | samples: missing |
| NO_2 | Nitrogen Dioxide | samples: missing |
| Nitrogen Oxides–in Hong Kong | samples: missing | |
| O_3 | Ozone | samples: missing |
| (RSPMC) | Respirable Suspended Particulates (RSP) | samples: missing |
| Time | Daily and hourly recording | From 00:00hrs to 23:00hrs of 1–31 January 2023, 1–30 April 2023, 1–31 July 2023 and 1–31 October 2023 (inclusive) |
| DayTimes | Discretised time periods of day |
|
| Period | Monthly weather periods | January, April, July and October |
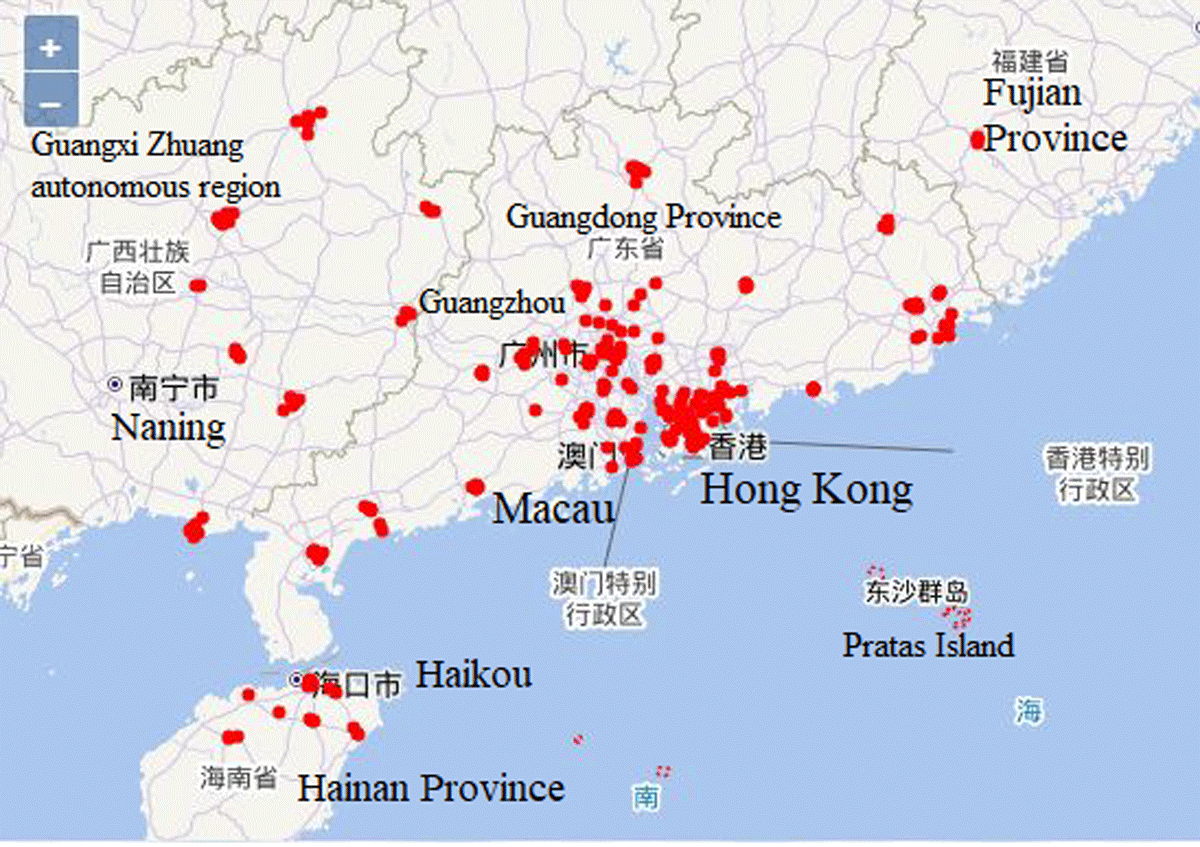
Figure 1
Data sources in southern China including Hong Kong and Macau.
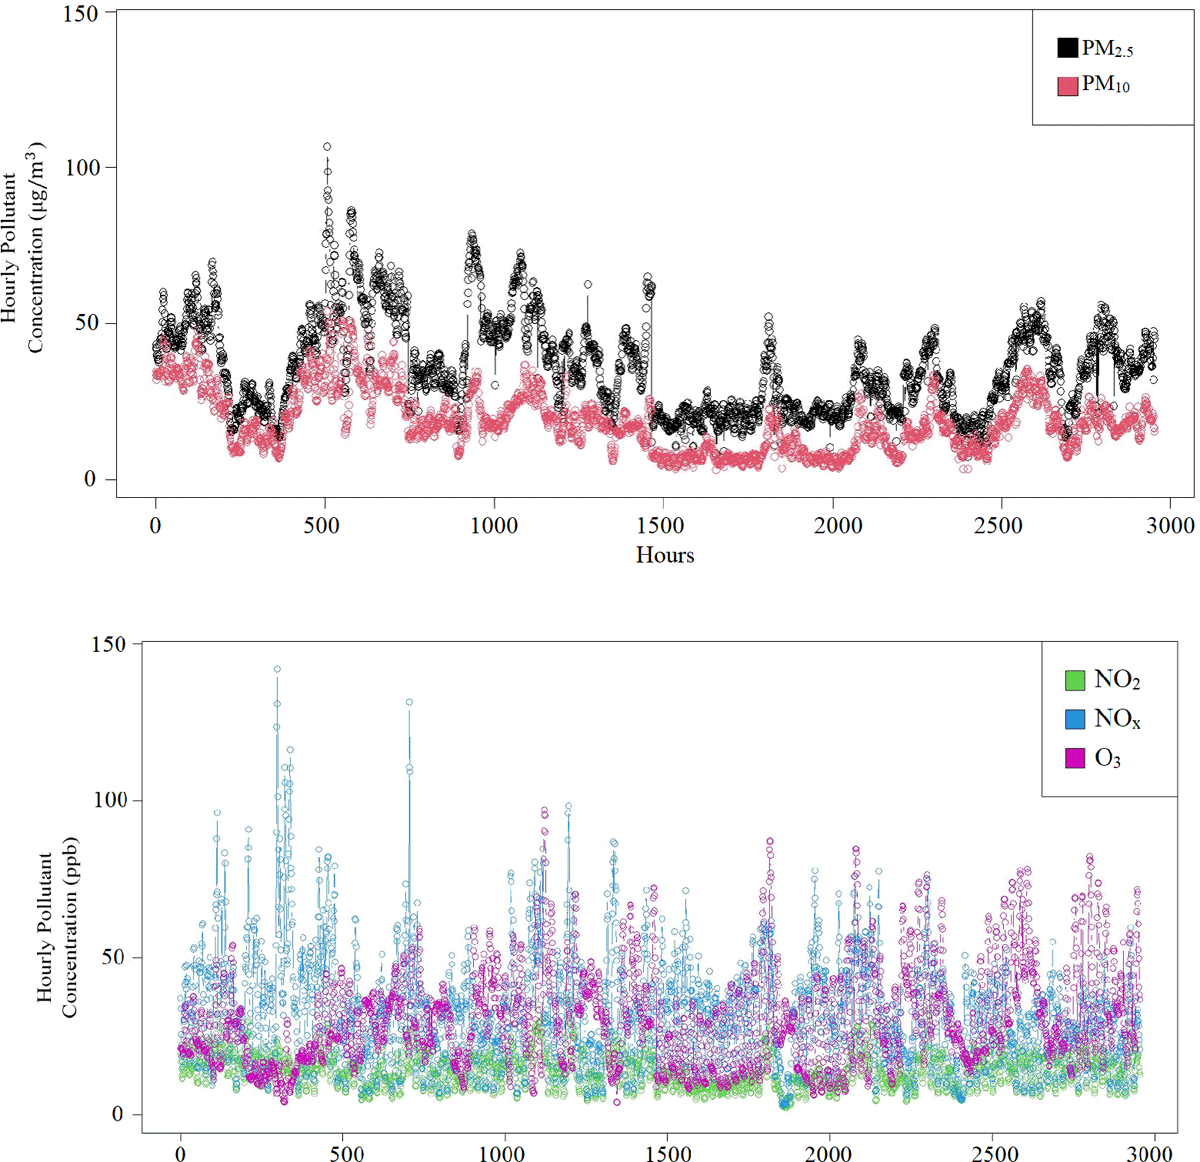
Figure 2
Hourly averaged concentrations for all sampled pollutants.
Table 3
Daily and monthly averages.
| START HOUR | END HOUR | HOURS RANGE | CATEGORIES OF DAY |
|---|---|---|---|
| 00:00hrs -Jan-2023 | 23:00hrs -Jan-2023 | hour | Night, Morning, Day, Evening |
| 00:00hrs -Apr-2023 | 23:00hrs -Apr-2023 | hour | Night, Morning, Day, Evening |
| 00:00hrs -Jul-2023 | 23:00hrs -Jul-2023 | hour | Night, Morning, Day, Evening |
| 00:00hrs -Oct-2023 | 23:00hrs -Oct-2023 | hour | Night, Morning, Day, Evening |
Table 4
Daily and monthly average concentrations of each pollutant.
| AVERAGE TIME | |||||
|---|---|---|---|---|---|
| PERIODS | ppb | ppb | ppb | ||
| Day | 20.08 | 15.77 | 38.00 | 39.51 | 35.52 |
| Evening | 21.51 | 15.99 | 35.85 | 30.29 | 38.41 |
| Morning | 19.96 | 13.61 | 34.79 | 23.70 | 34.68 |
| Night | 19.60 | 11.05 | 22.37 | 25.47 | 35.35 |
| January | 28.36 | 15.30 | 39.38 | 26.06 | 45.01 |
| April | 19.51 | 15.93 | 33.47 | 34.17 | 41.77 |
| July | 9.05 | 11.69 | 35.56 | 29.44 | 23.05 |
| October | 20.14 | 14.49 | 29.79 | 35.79 | 33.84 |
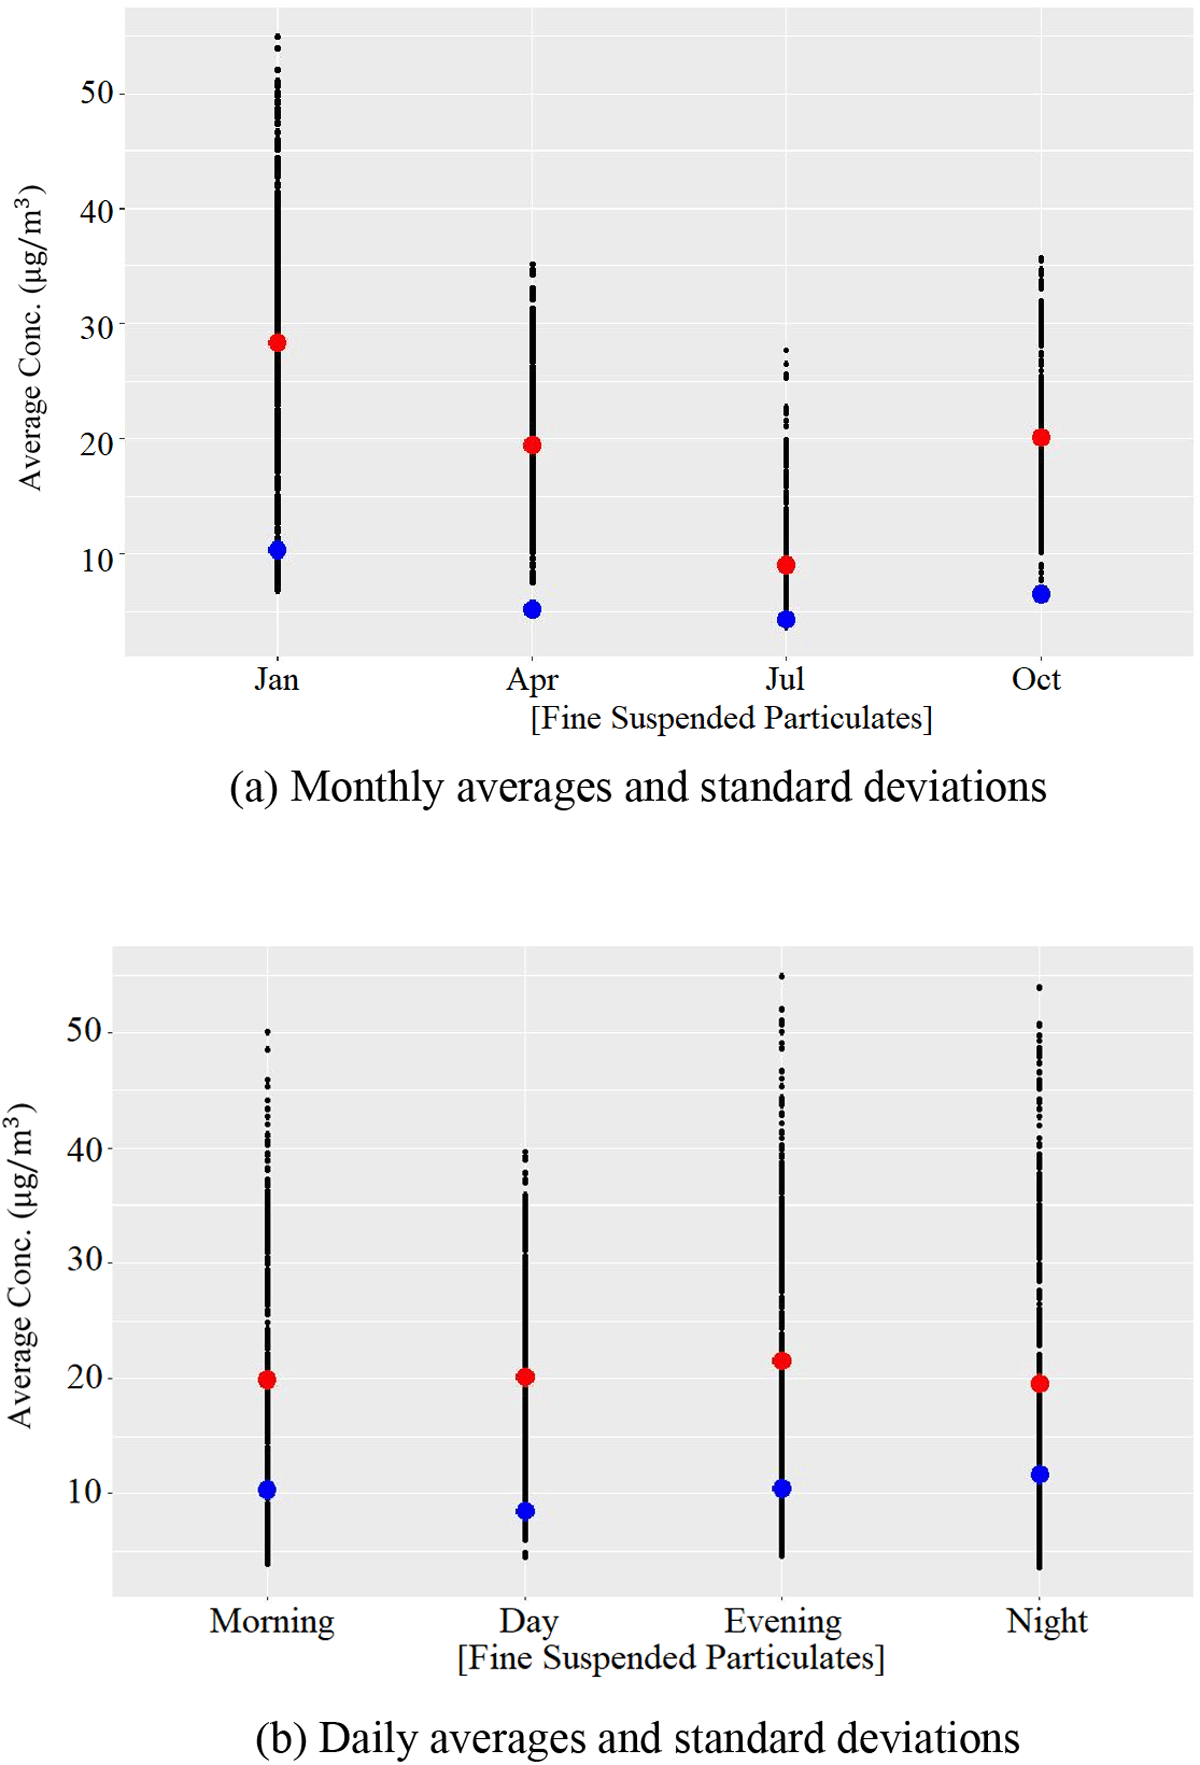
Figure 3
Fine suspended particulates monthly and daily averages and variations.
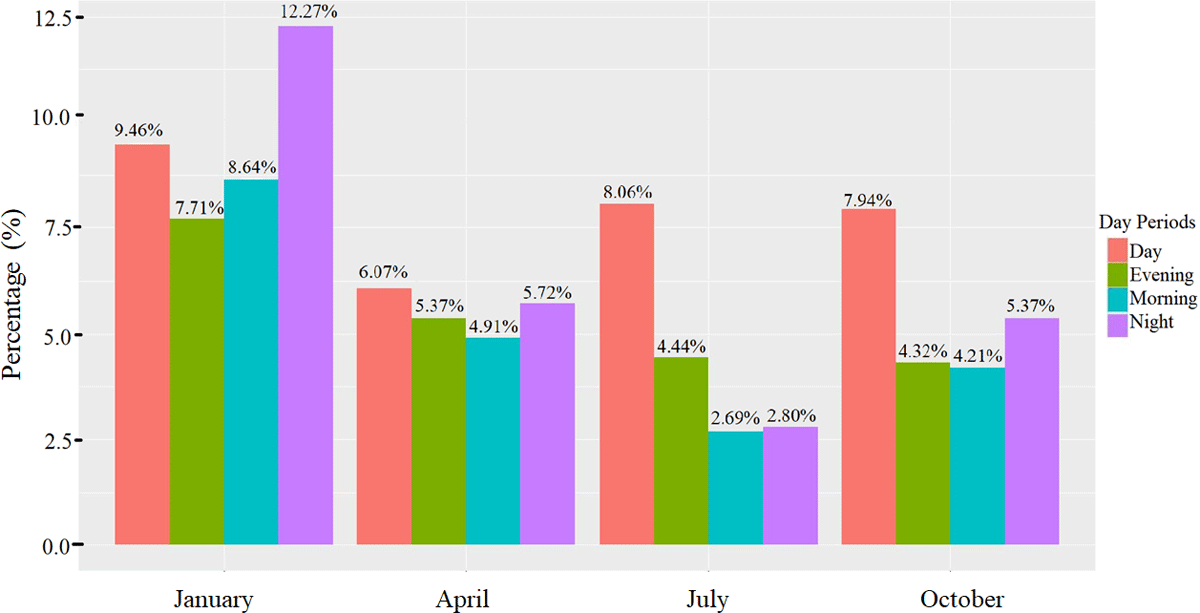
Figure 4
Pollution levels across the year 2023.
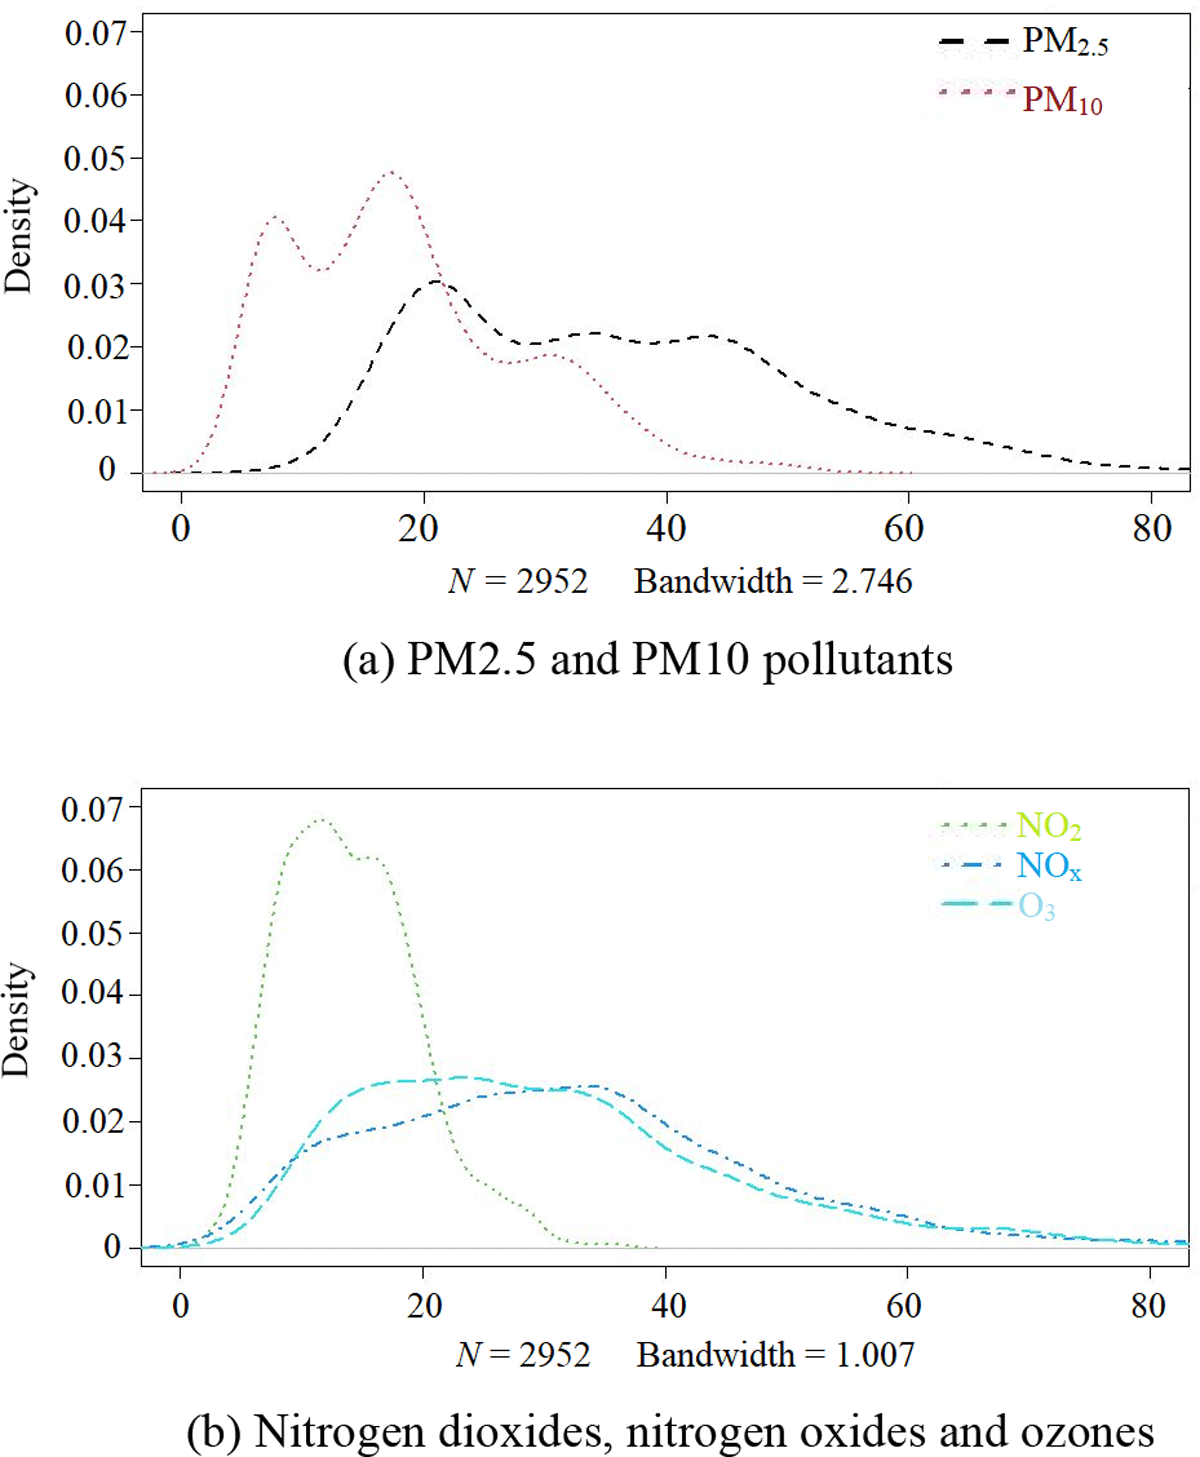
Figure 5
Density distribution of pollutants across day time periods.
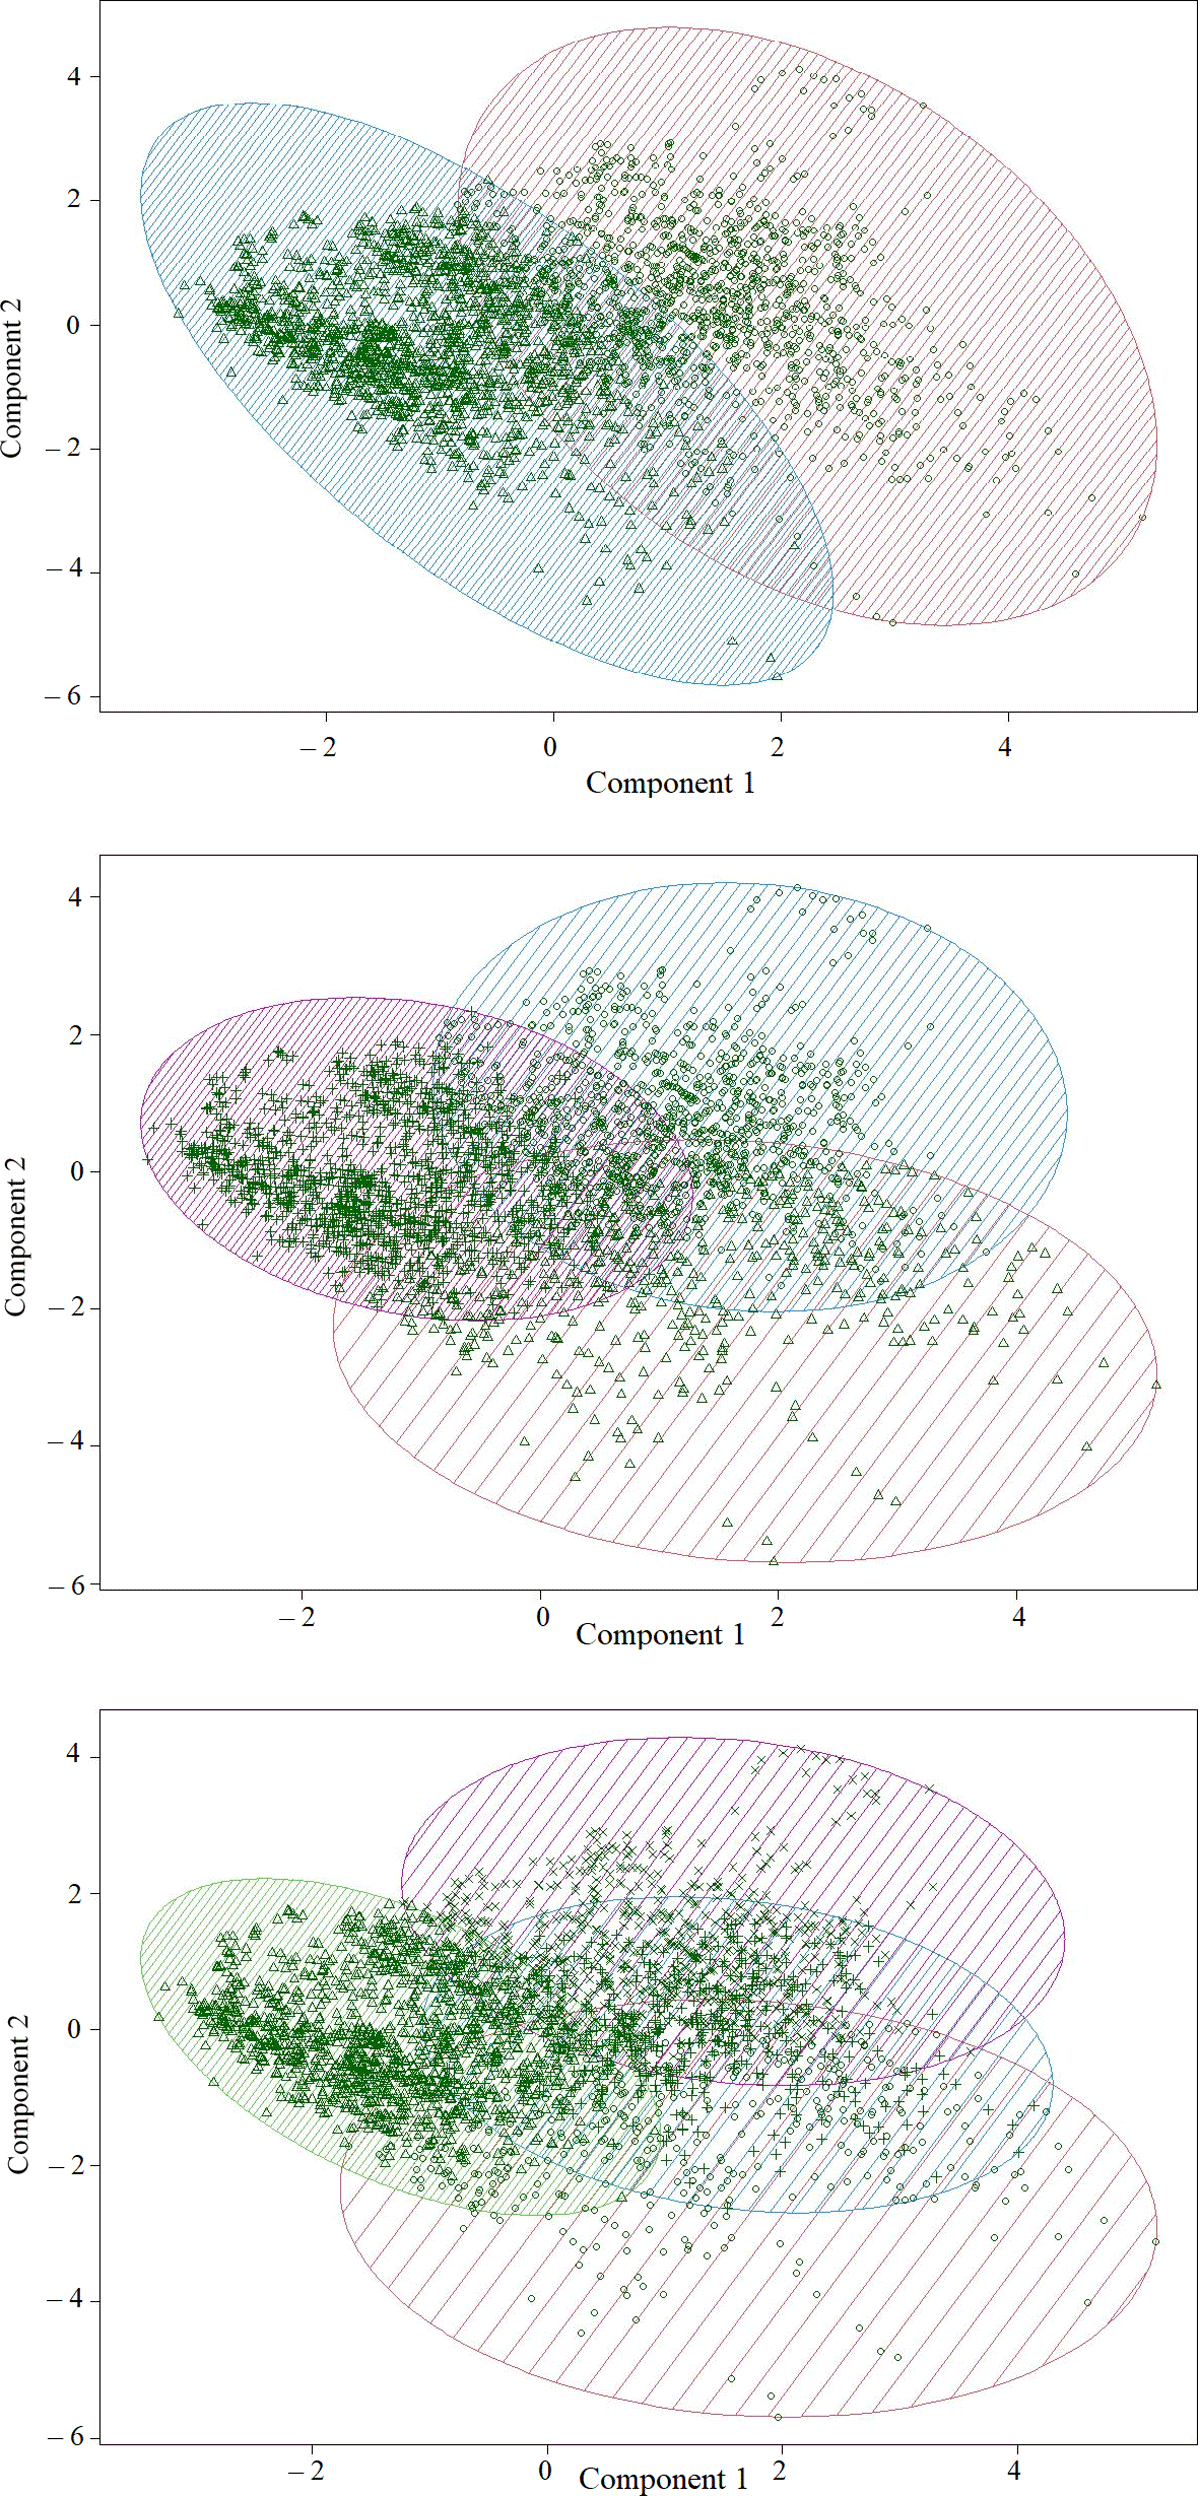
Figure 6
Pollution data points on a multidimensional scaling.
Table 5
Centroids of the selected clusters formed.
| POLLUTANT | 2 CLUSTER CENTRES | 3 CLUSTER CENTRES | 4 CLUSTER CENTRES |
|---|---|---|---|
| Fine Suspended Particulates () |
|
|
|
| Nitrogen Dioxide (NO_2) |
|
|
|
| Ozones (O_3) |
|
|
|
| Nitrogen Oxides () |
|
|
|
| Respirable Suspended Particulates () |
|
|
|
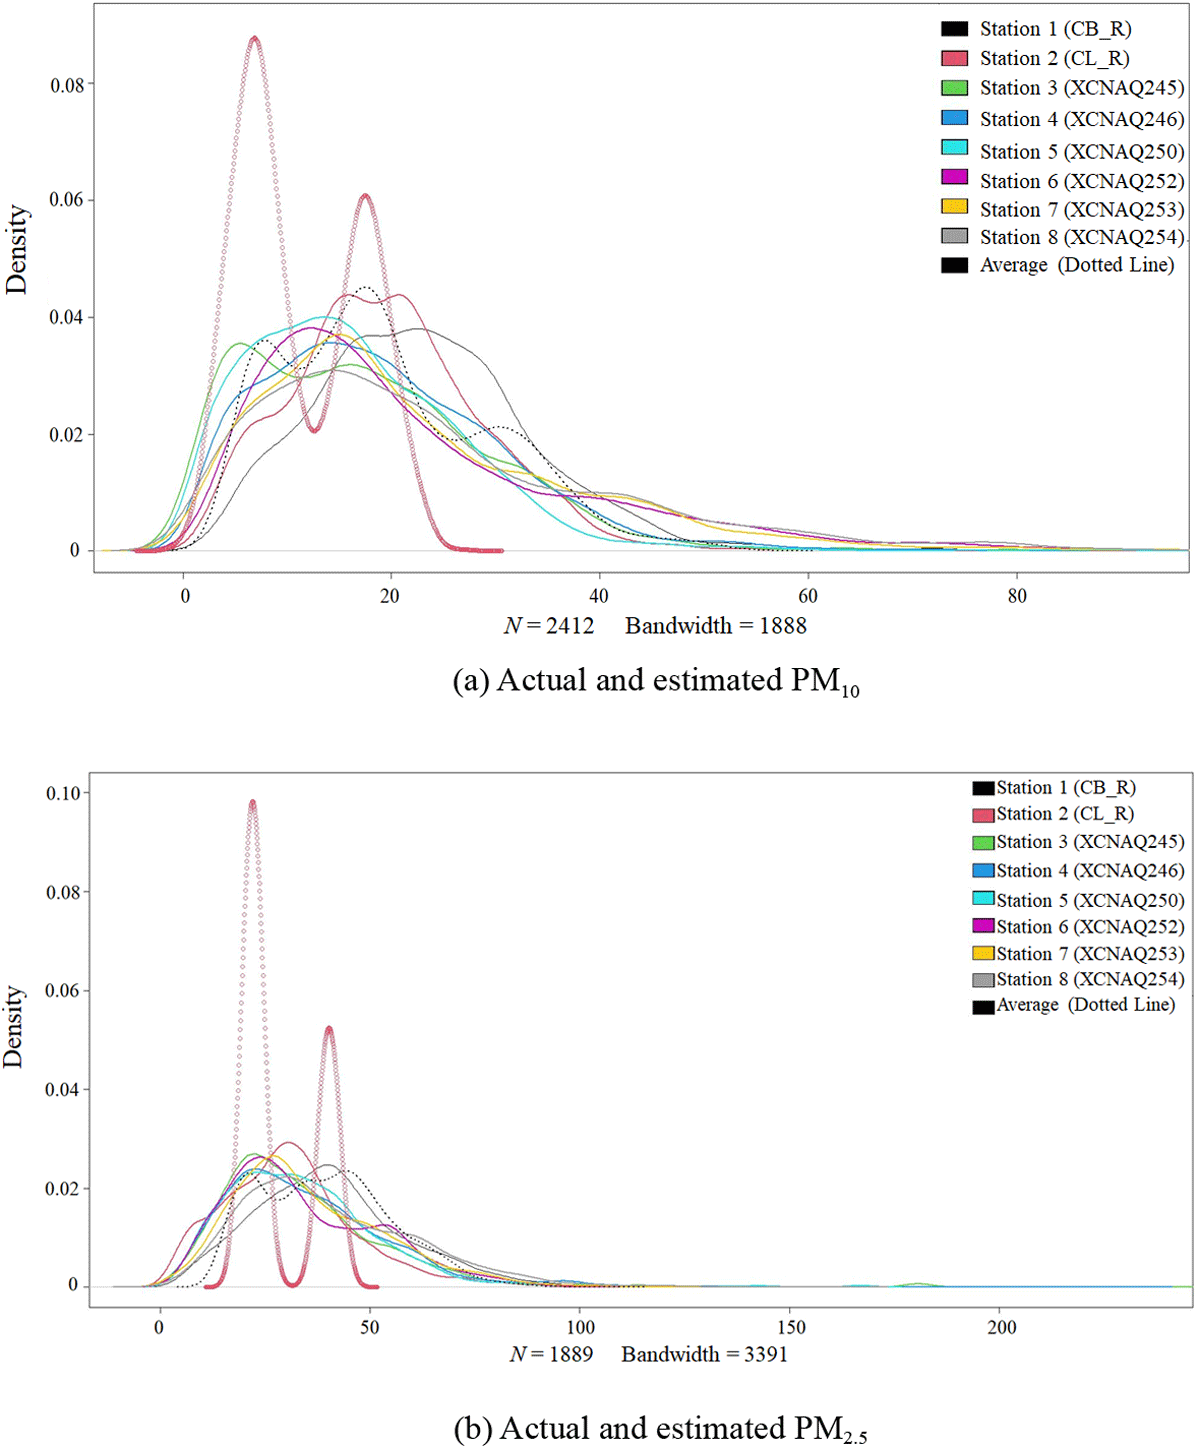
Figure 7
Actual and estimated (Left) and (Right).

Figure 8
Correlations among paired pollutant variables.
Table 6
Component loadings–contribution of each pollutant in each component.
| LOADINGS | |||||
|---|---|---|---|---|---|
| POLLUTANT | COMPONENT 1 | COMPONENT 2 | COMPONENT 3 | COMPONENT 4 | COMPONENT 5 |
| 0.399 | 0.334 | 0.822 | 0.221 | ||
| Nitrogen Dioxide () | 0.162 | –0.200 | 0.203 | –0.944 | |
| Ozones () | 0.536 | 0.199 | –0.816 | ||
| Nitrogen Oxide () | 0.258 | –0.935 | 0.225 | ||
| 0.679 | 0.203 | 0.469 | –0.524 | ||
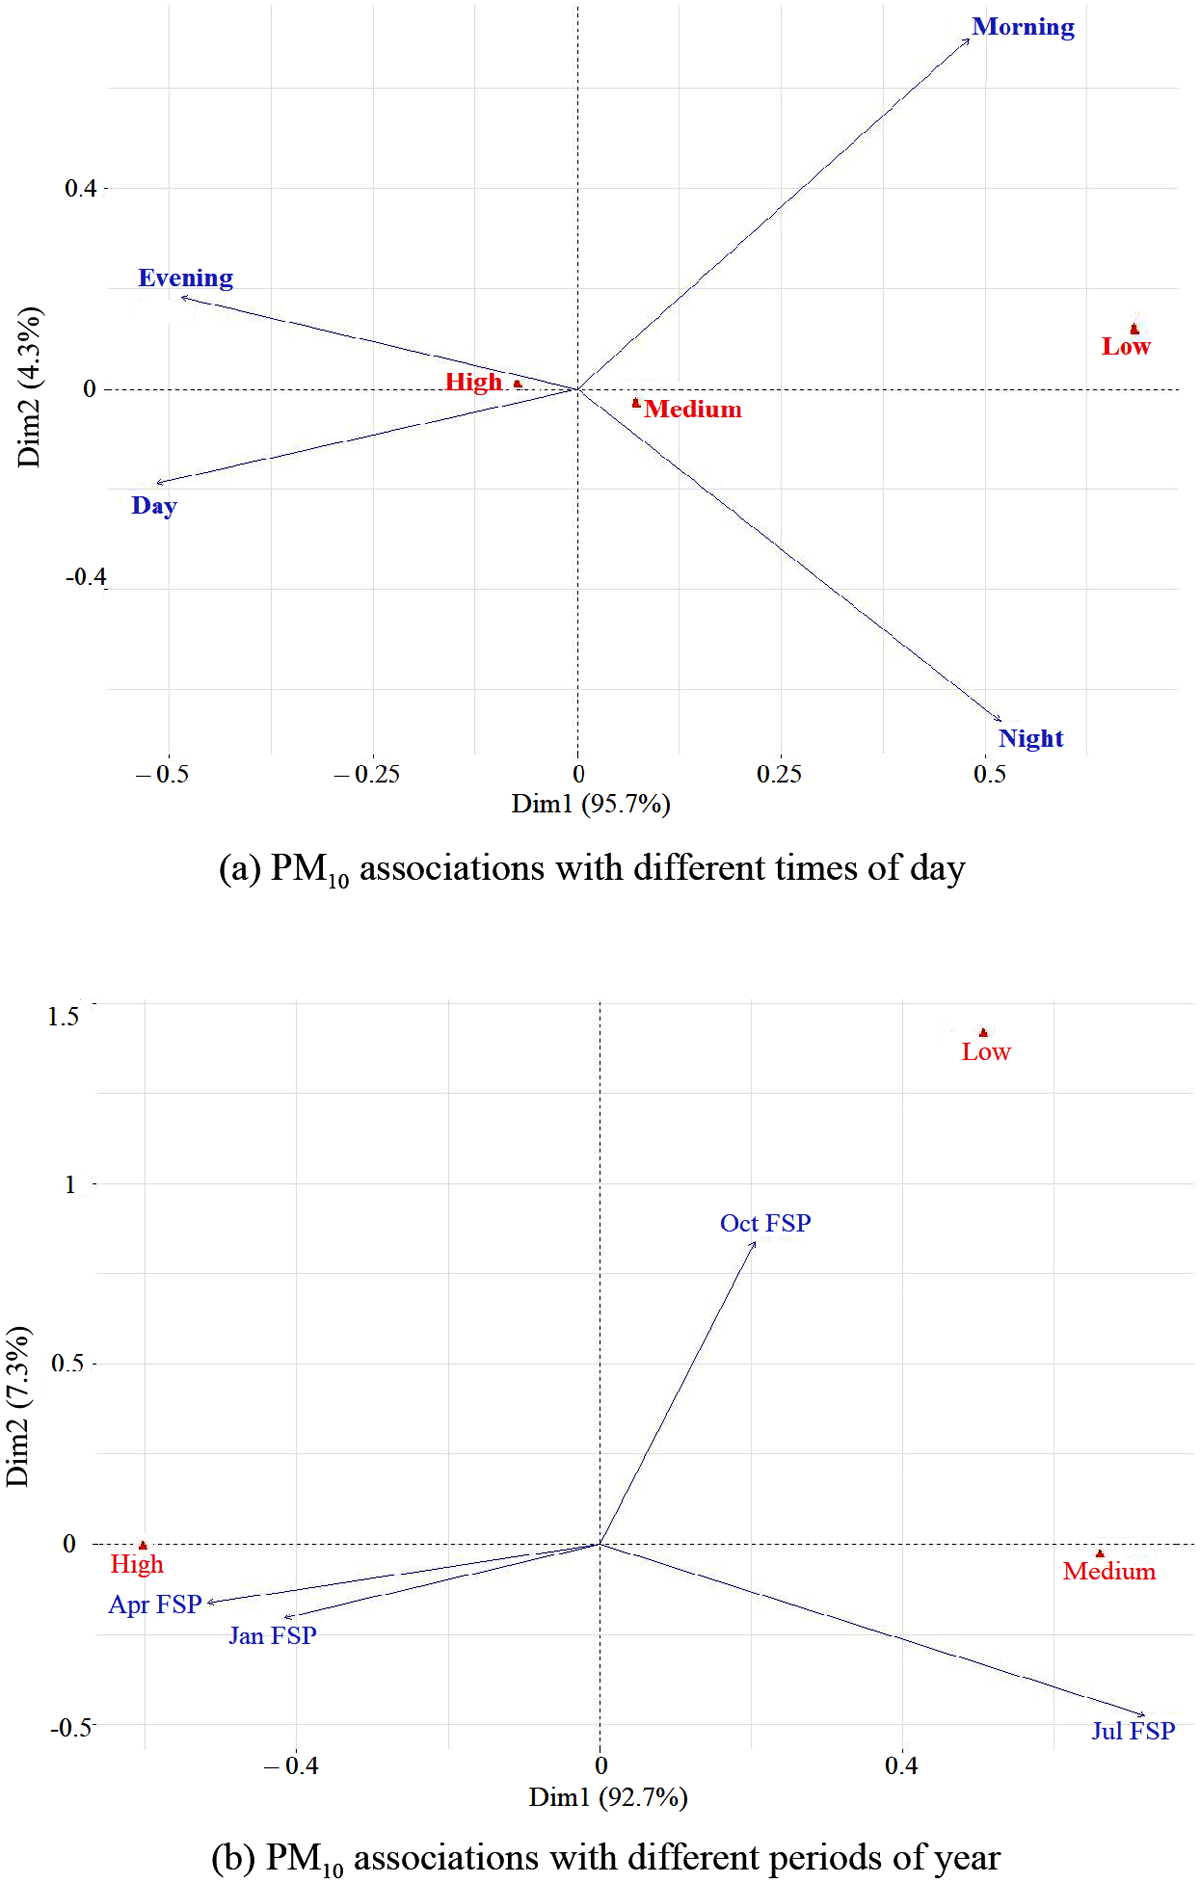
Figure 9
associations with daily and annual periods.
Table 7
Row points vs Principal Dimension 1.
| HIGH | LOW | MEDIUM | |
|---|---|---|---|
| Day | 484 | 4 | 373 |
| Evening | 352 | 3 | 260 |
| Morning | 369 | 20 | 349 |
| Night | 351 | 17 | 370 |
Table 8
Columns vs Principal Dimension 1.
| HIGH | LOW | MEDIUM | |
|---|---|---|---|
| January | 587 | 0 | 157 |
| April | 618 | 0 | 102 |
| July | 58 | 4 | 682 |
| October | 293 | 40 | 411 |
Table 9
Row points vs PD 1 for Day Times.
| DIMENSION 1 | DIMENSION 2 | |
|---|---|---|
| Day | 26.50596 | 3.576712 |
| Evening | 23.52921 | 3.377988 |
| Morning | 23.04545 | 49.011043 |
| Night | 26.91938 | 44.034257 |
Table 10
Columns vs PD 1 for Annual Periods.
| DIMENSION 1 | DIMENSION 2 | |
|---|---|---|
| April | 26.778387 | 2.672733 |
| January | 17.240575 | 4.196079 |
| July | 51.795246 | 22.524998 |
| October | 4.185793 | 70.606190 |
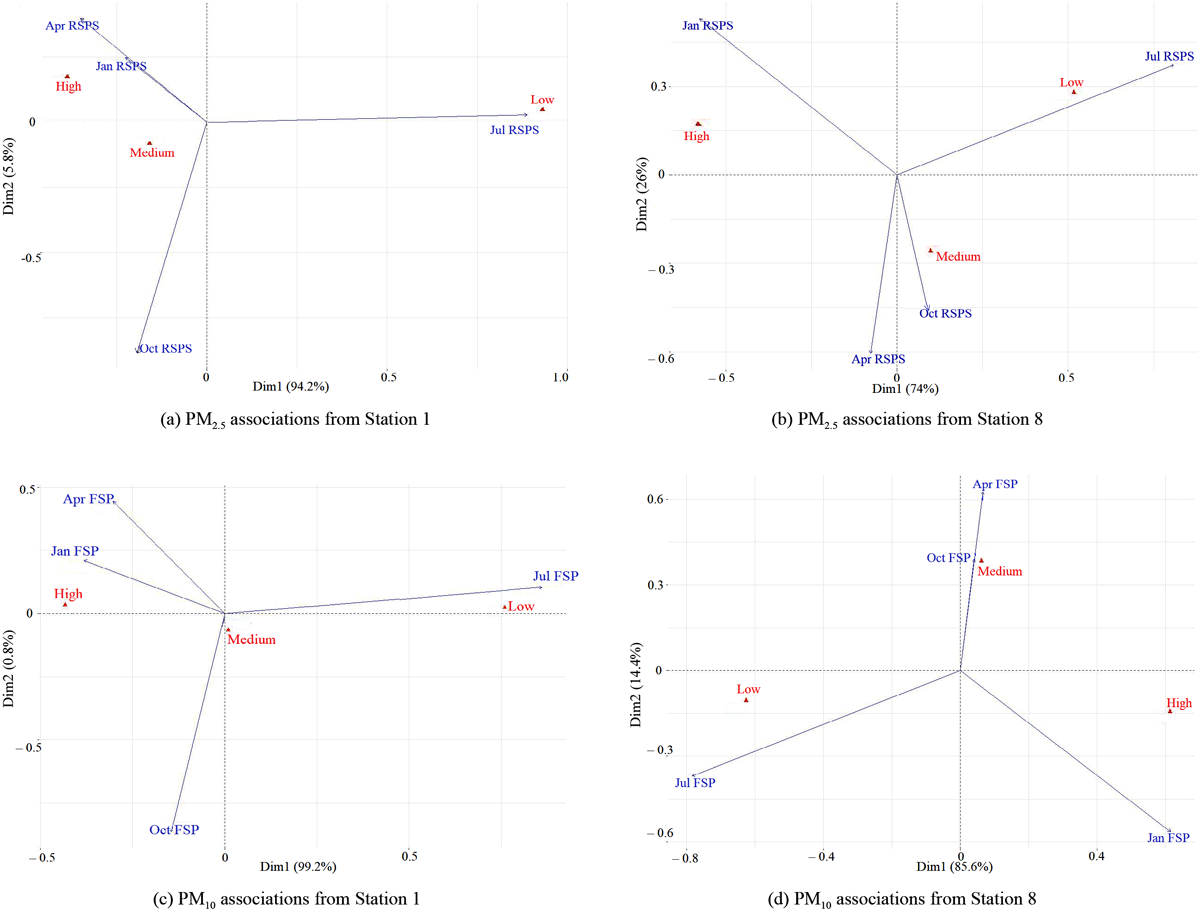
Figure 10
and associations from Stations 1 and 8.