
1 Introduction
Data is more than just a set of numbers; data tells a story if you know how to read it. However, that story can be inaccurate if the data is not high quality. This project set out to try to understand the outliers and unusual trends in livestock population data to determine which source, between the World Organization for Animal Health (WOAH) and the Food and Agriculture Organization of the United Nations (FAOSTAT), has a higher probability of being more accurate. There is no way to definitively say which source is more accurate, but when evidence can be found to corroborate one source more than the other, it gives that source a high likelihood of being the most accurate. Even then, it cannot be definitively the “correct” source as researchers cannot know the true population, and because evidence might exist but not have been found for the other source. In this research, FAOSTAT and WOAH data are compared against each other, against national data and UN Agricultural data, as well as against recorded events that occurred in the country. FAOSTAT and WOAH were chosen because FAOSTAT is often used as a resource for livestock population data; WOAH is also often used but draws from different sources to collect its data. FAOSTAT collects data from multiple sources, such as local ministries of agriculture, national statistical offices, and other government organizations (FAOSTAT, 2025a). WOAH collects its data by working with the country’s veterinary authorities and laboratories (WOAH, 2025). These comparisons were completed to help to validate WOAH and FAOSTAT data and to identify outliers. Using these methods the FAOSTAT and WOAH data was labeled for fifteen countries’ cattle, sheep, pig, and chicken populations to help identify if outliers were caused by an external influence or potentially by an inaccuracy in the data. All the labelled data was organized and given a score before being made available on the Global Burden of Animal Diseases (GBADs) GitHub repository for researchers to use. This allows researchers to get a deeper understanding of the data they are using, and allows them to pick more accurate sources according to historical events and influences on livestock populations. It is often not immediately obvious which source is the most consistent so currently researchers investigate the data to determine which they believe to be the most accurate given the evidence they have found.
The purpose of this project was to find outliers in livestock population data to see if historical documents or publications could show a cause for the outlier, and to create and outline methods that researchers can use to reproduce this research for themselves with other countries and species. It has been found that data from FAOSTAT, WOAH, national census data, and United Nations census data can have internal and external inconsistencies (internal inconsistency is when data is being compared between itself, and external inconsistency is when two datasets reporting the same data are compared against each other) (McKechnie, Raymond and Stacey, 2024; Raymond et al., 2024). GBADs wanted to investigate these inconsistencies to see if it was possible to explain them with a historical event that could have influenced the livestock population. An example would be the cattle and chicken populations in Ethiopia. These populations dropped dramatically from 2010 through 2011. This drop could seem arbitrary and possibly an error in the data, but investigation further revealed that Ethiopia had droughts during that time (Mera, 2018). Given that cattle eat grass and chickens forage for plants, bugs, and small animals, their food sources would have been impacted and reduced during this time. This research into records of drought was able to show that the drop in cattle and chicken for this period was most likely a symptom of the drought.
The implications of this research are such that researchers who use livestock population data will now have easier access to labelled data with annotations for individual data points allowing them to gain a better understanding of the context around trends in the data. Livestock population data is important to researchers for the calculation of animal disease (Sibhat et al., 2017), economic health burden (Muraguri et al., 1998), climate change (Fordyce et al., 2023), and antimicrobial resistance calculations (Mulchandani et al., 2023). Researchers need a repository of data and there are only a few providers of country-wide livestock population data such as FAOSTAT, WOAH, and EUROSTAT. Researchers may not have a great understanding of the data they are choosing due to the low availability of certain countries’ population data. This paper and the methods used in it are meant to help researchers select their provider and population data with more certainty as they can know what to look for, and help them understand how to do some background research to understand the trends in the data. As part of this paper, fifteen countries’ data was labelled and made available to researchers. Going forward, researchers who use this methodology can expect a better understanding of their data and the trends in data to make more informed decisions based on this data.
2 Methodology
2.1 Country and Livestock Selection
The first step in this process was choosing a set of countries and livestock species to be studied. It was decided to pick multiple countries so that every continent (except Antarctica) would be captured. These countries were also chosen to be inclusive of as many economic levels, climates, and cultures as possible to gain a more rounded understanding of how data quality affects countries around the world. The countries chosen were Canada, the United States of America, Chile, Brazil, Ireland, Czechia, Slovakia, Ethiopia, Morocco, South Africa, Iran, India, China (Hong Kong and Macau inclusive), Indonesia, and Australia.
The livestock categories selected had to follow similar principles as those used to select the countries. They had to be large enough groups so that there would be historical documentation on them, and they needed to be diverse enough so that the countries picked would have reasonably sized populations of at least one of them. For example, livestock such as pigeons and guinea pigs would not be included as not every country farms them and there is not a lot of documentation on them. The livestock species chosen for this study are cattle, pigs, sheep, goats, and chickens. These groups are grown fairly universally around the world as they are usually the main food-producing livestock; they are also the most economically important species as they are the most consumed animals in the world (FAO, 2025).
2.2 The Automation Process
A software tool was created to allow users to select a method of outlier detection and automate the identification and recording of outliers in data given user input on the parameters defining an outlier. The methods to detect and record outliers were interquartile range, normal distribution of growth rates, and trailing five-year analysis as used in (McKechnie, Raymond and Stacey, 2024). The user first selects a country and a species, then a method of outlier detection, and the software tool saves the outliers to a comma-separated file on the local machine. Each method of detection found slightly different outliers. For polynomial regression, the third-degree polynomial was used based on one of the specific sources (WOAH, FAOSTAT, UN census data, or national data), and any point from any source that was more than ten percent larger or smaller than that point was recorded. For the five-year population average, internal and external data inconsistencies can be identified, however, it was chosen to only identify external data sources. This is because for smaller countries, doubling a small livestock population in five or ten years is not unreasonable. For example, if a country only has a few hundred cows, chickens, or any other livestock, it can be easy to double that population because you will not need a lot of resources to support the population growth. In contrast, for a large country like the USA, this would be extremely unlikely. An example of this is the cattle population in the Bahamas dropping by almost half between 1967 and 1972 (The Global Burden of Animal Diseases, 2025), which is reasonable given the population in 1967 was only 3400 cattle. For the USA to lose half of its cattle, more than 40 million cattle would need to die without replacement, which is much less likely. For external inconsistency identification, when two sources had data in the same five-year stretch the software tool checked if they were within ten percent of each other, if they were not, both were noted. For growth rates, the software tool already found outliers (McKechnie, Raymond and Stacey, 2024) and visually displayed them in a table.
The three software tools: the normal distribution of growth rates, the interquartile range, and the trailing five-year analysis, can be used to identify internal and external data inconsistencies (McKechnie, Raymond and Stacey, 2024). The normal distribution of growth rates plots the yearly growth rate on a normal curve so the reader can see which year’s growth rates fall outside three standard deviations of the mean, which is considered to be an outlier (Oracle, 2025). Knowing what years are outliers allows the user to then search for external influences on country and livestock populations during and around that year, to try to explain the change in population. This plot allows the user to identify external inconsistencies in the data by comparing plots from different sources for the same livestock population, and to identify internal inconsistencies by comparing the yearly changes on the normal curve. The interquartile range is used to calculate the variance in magnitude for each quartile of the data and show it in a visual. Using this visual, there are upper and lower fences for which any data outside these bounds is considered an outlier that should be investigated further. Using this method, the user can identify internal data inconsistencies by identifying internal inconsistencies outside the fences, and external data inconsistencies by comparing the plot data distributions from multiple sources against each other. The final method is the trailing five-year population average analysis. This method takes the trailing-five year population average for each half decade and plots them in a histogram for all available data sources. The advantage of this method is that it minimizes the effects of short term data fluctuations, which allows users to more easily visualize long term data trends. This is because if data has a sudden yearly spike, then drops down to regular levels, the five-year average will dampen the affect of this trend. The user can use this method for internal and external data inconsistency analysis as well. These three methods can be used in combination to find inconsistencies in various data sources since the methods show inconsistency in different ways, allowing the user to have a higher chance of identifying all data inconsistencies for future analysis.
For the interquartile range, the upper and lower fences already categorise data as outliers, so the data categorised as outliers were saved to a file. The recorded outliers were useful as they were a launching point for investigating the data. The areas of rapid change in the data, whether it was an external event or inconsistency in the data collection or distribution could be investigated to see if there was any historical documentation, articles, or research papers that indicated a cause. This allowed research to be sped up as there were specific years and time frames that could be searched for. One such example is Australian cattle in 2011, shown in Figure 1. The trailing five-year average recorded outliers in 2011 for both FAOSTAT and WOAH. When looking at the trailing five-year average, we see a huge drop during this period for the census, and flat for FAOSTAT and WOAH. When investigating this period further, it was found to be during the Australian “Big Dry”, a period of drought that affected Australia from 1996 to 2012. This gave more context to the decrease or stalemate of the cattle population during this time. While FAOSTAT data appears to be more consistent for Australian cattle data, it is up to the user of the data to decide which of the two sources they believe to be more accurate for their use case.
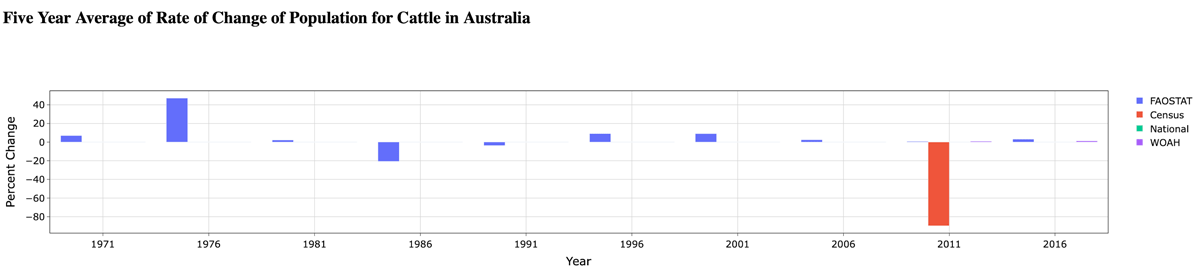
Figure 1
Five-Year Trailing Average for the rate of change in the Australian cattle population.
The GBADs FAOSTAT Data Visualizer (The Global Burden of Animal Diseases, 2025) was also used in the automation and research of data. It includes a page where the user can define a percentage change in population, and the software tool will display all of the years in which the change was higher than that percentage, given a specified country and species. The user can then download this table. This was used to study countries and species where the yearly change was greater than twenty percent. What made this tool unique when compared to the previous tool was that the flag data from FAOSTAT was preserved and recorded when downloaded. This data was useful because the flags indicated where FAOSTAT got the data from. More information on this is in Section 5. These were useful because the data could be labeled based on this information. For example, if data fell sharply during a period, and the flags indicate missing, such as India in 1995 and 1996, this indicates the source changed for the FAOSTAT data, and this can help explain the sudden change in the data.
2.3 Selecting influences on livestock populations to investigate
Once a list of potential inconsistencies was found, documentation on historical influences were needed to provide evidence for these inconsistencies. A list of potential influences was created to investigate for each country; this list needed to cover as many of the largest influences on livestock as possible. It was determined that floods, droughts, wildfires, tornadoes, hurricanes/typhoons, wars, major economic policies (such as alliances and free trade agreements), sanctions, and recessions would be investigated. These influences were selected because they cover market forces and weather-related forces that can have large impacts on livestock as they affect both the survival rate of the animals, and if they will produce more offspring. One element not selected was disease outbreak, and this is because it has been investigated by McKechnie, Raymond and Stacey (2024). These external pressures cover a large majority of the data inconsistencies as many of the sudden changes in livestock population trends were from these sources.
2.4 Finding documentation on historical influences
To find documentation on the historical influences mentioned, multiple methods needed to be used. The first method involved reading peer-reviewed publications to find extreme weather events, documentation on market events, and other sources of population data. This was important as such publications often contain lots of information on the events, and even their impacts. Semantic Scholar was the primary resource used for finding publications for this research. Examples found included Progress in the Brazilian cattle industry: An analysis of the Agricultural Censuses database (Marques and Mazza Rodrigues, 2014), which contained specific cattle population data that was used to compare against FAOSTAT and WOAH. Another example is the Demographics of the Canadian dairy industry from 1991 to 2011, (Jelinski et al., 2015), which contains information on the demographics of Canadian cattle farmers and how this impacts the number of cattle ranches and how many cattle there are. After looking at research papers, investigation was done into articles that detailed events and pressures that could have affected the livestock population living in the affected areas. Examples included articles outlining economic partnerships (OECD, 2025), and changing consumer demand for certain products (Pig Progress, 2025), among others. Results from news sites or reputable blogs (non-profits or eyewitness accounts) were then viewed and compared against each other to ensure the facts lined up and verified each other. Final sources used during this search used can be found in the dataset provided in section 8.1, with the accompanying data point, year, species, and explanation. This is where the software tool written for this project was used because the user could search for these years directly and see if there was a specific natural disaster that occurred during this time that would have affected the livestock population. Systematically looking through research papers, then articles, for all livestock species, years, and countries is time-consuming but can reveal information on many inconsistencies in the data provided by FAOSTAT and WOAH. This can help with labeling specific data trends or with choosing a source with fewer inconsistencies. The results from this research can be found in Section 8.
Depending on the country, period, and species being searched for, there are varying degrees of difficulty when it comes to discovering reliable historical documents. Lack of relevant information, inconsistent measurement types, and non-searchable data among many other issues all posed a challenge for finding data that could be compared to the sources being investigated. Some countries that are more developed and where agriculture is a larger part of their GDP, such as Brazil, Canada, and the USA, put more resources into measuring and recording livestock populations, which makes it easier to compare to WOAH and FAOSTAT. Other countries that had fewer resources to record livestock populations a greater challenge for corroborating the FAOSTAT and WOAH data. Some countries, such as India, had censuses for their livestock populations but only scanned the paper originals so users cannot search for specific words in them, which makes it much more time-consuming to find specific population numbers. Inconsistent measurement types included measuring livestock populations by weight instead of by head, making it impossible to compare it to FAOSTAT and WOAH, which count by head.
3 Results
It was discovered that the largest influences on livestock population were market powers or weather. Every country is impacted by these influences. Market powers can be positive or negative depending on the cause and the livestock species. Negative impacts include sanctions, recession, changes in consumers’ tastes, and government policy. Positive impacts include free trade agreements, changes in consumers’ tastes, and government policy. Sanctions and consumer taste changes are similar in that there is a reduction in the purchase of a certain type of meat because consumers seek to buy a substitute meat or protein. Sanctions can cause this by limiting the supply of a certain meat, which causes increased prices, which forces consumers to switch to a lower-priced alternative. Changing consumer preference can cause this by consumers wanting to purchase a substitute product instead. This can cause reduced demand and as a result, farmers reduce supply to keep prices stable (Richardson, 1994). One example of consumers reducing meat consumption during a recession is seen in Ireland during and after the 2008 global financial crisis. Ireland was hit particularly hard: between 2008 and 2010, its economy shrank by 15 percent (Krings, 2010). As a result, the country’s beef population shrank and its chicken population increased in the following two years, which could be attributed to changing consumer preferences to lower-priced proteins. Searching for articles published during this time helped find information on the recession in Ireland and how severe it was for its citizens. However, it was also found that around the world because consumers eat more chicken instead of beef because it is lower in price (Melvin, 2023). This is not a trend that occurs only during a recession: there is a long-term trend of consumers preferring to eat chicken instead of beef (Melvin, 2023). As a result of this, beef populations were shrinking or increasing more slowly while chicken populations were growing at a faster rate to compensate (Hess, 2025). Government policy can also negatively impact livestock populations. Although this is rare, since usually governments incentivize farmers to produce more, there are examples of government policies that aimed at reducing livestock populations. One such example is Czechia and Slovakia, which, when they joined the EU, needed to comply with EU environmental policy and reduce greenhouse gas emissions in agriculture. As a result, they cut livestock populations to increase crop production since crop production has a lower carbon impact (Věžník et al., 2017).
Factors that were found to positively impact livestock populations include free trade agreements and government policies. Free trade agreements often lead to growth in livestock populations. A result of a free trade agreement can be that the inputs for livestock drop in price because supplies can be traded across countries more easily and/or free of tariffs. Free trade agreements can be found through using the Google Search Engine to find government websites where current and historical free trade agreements would be outlined. Populations can also increase because farmers can export their animal meat more easily since tariffs and taxes are lower which increases customer demand due to lower prices. One such example is Canada, which joined the North American Free Trade Agreement (NAFTA) in 1991. In the following years, Canadian cattle, chicken, sheep, and pig populations all increased in part due to the ability to more easily sell meat to the USA and Mexico (U.S. Customs and Border Protection, 2025). It was also discovered that many positive fluctuations in livestock populations are the result of government policies to support farming and livestock population growth. India had many examples of the government successfully implementing policies that increased the livestock population and production. In one example, in 1970 the Indian government launched Operation Flood, which had the goal of increasing milk production and reducing costs so consumers would drink more milk and reduce malnutrition in children (National Dairy Development Board, 2025). Immediately following this initiative, the cattle population in India started increasing rapidly and had added almost 25 million cattle by 1992 according to FAOSTAT. The results were a success: cattle populations increased and malnutrition decreased across India. This was found by using the method of searching for government policies during this time period and until a relevant article by the Indian National Dairy Development Board was found (National Dairy Development Board, 2025). Similarly, in 2013, the Indian government approved the National Livestock Plan which had the goal of bolstering the livestock populations in the country by improving the infrastructure used by farmers and the livestock industry and through providing support to farmers by offering tools to improve breeding and productivity in animals (Ministry of Agriculture, India, 2025). Shortly after this, the cattle and sheep populations started to increase. Sanctions were hypothesized to reduce livestock populations due to limiting the country’s ability to export livestock and meat. However, in some situations, sanctions were found to increase the livestock populations in the studied countries. Iran was sanctioned by most of the Western world after the Iranian Revolution in 1978 and 1979. Following these sanctions, all livestock except pork saw an increase in their population. This could have been because Iran now needed to produce more food to feed its own people as it was harder to trade for animal proteins from the outside world. This was found by finding the date of the Iranian Revolution and the subsequent Western tariffs, then investigating the WOAH and FAOSTAT livestock populations following these dates.
A successful method for justifying livestock population trends is looking at historical events that could have impacted the populations at that time. By looking at historical events and seeing if they occurred during sudden increases or decreases in livestock population, we can use these as evidence for the population change. The external influences researched for this paper were floods, droughts, wildfires, tornadoes, hurricanes/typhoons, wars, sanctions, recessions, and major economic policies such as government policies or free trade agreements. Studying these events when looking into a country’s past gives context to many of the trends in animal populations. An example of this is FAOSTAT’s Ethiopia data that showed sudden livestock population drops in 2000, 2002–2003, and 2011. It was initially unclear what caused these drops which appear as inconsistencies given surrounding data points. It was not until research was performed into droughts in Ethiopia that it was uncovered that severe droughts occurred during this time. This research was found by searching databases of research publications such as www.semanticscholar.org and www.elicit.com. Given this new information, it was clear that the droughts were hurting the livestock populations. Another example is India’s Operation Flood. As mentioned earlier, during this period, both phases of cattle population growth and stagnation were observed, this pattern is explained by Operation Flood (National Dairy Development Board, 2025).
It was discovered that you can derive a population size given secondary and tertiary data, however, this derived data is only an estimate and must be taken as such. This is done because some governments, agencies, or NGOs might not track the entire population of a species in a country, but they may track births or some other attribute of the population. Given this, it is possible to backtrack to get an estimate of population size. For example from 2003 through 2006, there was 2.2 million cattle births annually in Ireland (Maher, Good and More, 2008). Knowing the average annual birth rate for this period, it is possible to find how often cattle give birth in a year, what percent are miscarriages, and what percent are twins, and an estimate can be made of the population of cows (female) in Ireland. This method can be useful if there is not a lot of other available information on a population. When using this to compare against FAOSTAT or WOAH, the resulting figure cannot be taken as fact because it will not be exact. It is useful for getting a rough idea of a population. If the found population size is magnitudes larger than what FAOSTAT and WOAH might have specified it might be concerning but if it is within a margin that is acceptable to the researcher given population assumptions, then the researcher can be satisfied with the population estimate from the source data set. Many smaller factors can affect deriving data that cannot change; for example, different subspecies of an animal might exist in different amounts around the country and they are all grouped in censuses. This is important to note because different subspecies of the same livestock might have very different characteristics that affect reproduction, lifespan, or other factors that could affect the population and that are not taken into account when deriving data. This is therefore one method that can be used if there are few other options for finding the population of livestock in non-FOSTAT or non-WOAH sources.
4 Issues in finding data
There are often issues with finding data. These issues include finding data sources that use measurement systems different to those used by FAOSTAT and WOAH. One such discovery was a mismatch of measurement types for how slaughtered livestock was counted. Livestock is viewed as a commodity and as a result when it is processed it is measured by weight, not by head. This makes it hard to compare live livestock, which is counted by head, against slaughtered livestock, which is counted by weight. There is no consistent conversion either because the average weight of livestock has changed since the 1960s when the population started getting tracked by FAOSTAT (https://www.fao.org/faostat/en/#data/QCL). With advances in medicine, feed, and selective breeding, livestock sizes have increased in more recent years (Zuidhof et al., 2014). There are also differences in the weights of animals depending on what latitude they live in. Animals that live in northern or southern climates, compared to central climates, often have more fat to stay warmer, which increases the average weight of the animal. This makes it impossible to estimate the number of animals killed per year given total carcass weight because the weight of the animals is different depending on the latitude in which they were raised (Scasta and Hauptman, 2019). The average cattle weight is also different depending on the country. The average cow in the US is 1350 pounds (Scasta and Hauptman, 2019) whereas the average cow in Brazil is 550 pounds (Meat and Livestock Australia, 2025). These differences could be attributed to many things such as different breeds, weather, nutrition, and access to medicine. Trying to gauge the population size based on weight is therefore not a good metric for measuring population because cattle size has been increasing over time and because cattle size is also location-dependent.
There are also issues based on the popularity of species being consumed and studied. Poultry, pig meat, and bovine meat are the most consumed meats in the world making up for 93.6% of net carcass weight consumed (FAOSTAT, 2025b). Ovine comprises less than five percent of the net carcass weight consumed. So sheep is a less popular meat source despite being the fourth-largest consumed meat type in the world (FAO, 2025). As a consequence of the reduced demand, more research is spent studying the three larger groups and it is therefore harder to find research on sheep populations. This makes it much more time-consuming to find information on populations of sheep, especially for smaller countries with limited resources or small populations of sheep.
Another issue with finding data for less popular livestock species, such as ovine, is the contents of the papers. Most papers regarding livestock are concerned with outbreaks of diseases and disease tracking. With papers under these topics, the methods used for surveying involve taking sample sizes of tens to hundreds of farms and tracking the animals in these groups (Yang et al., 2014). Papers might not provide information on the farms being selected, such as their locations or the criteria used to pick the farms. This hinders the extrapolation of their recorded sheep populations for an entire population. If studies only collect data from one state or province in a country, this cannot be used to generalize the size of farms across the whole country. It can be very time-consuming to find research papers on sheep for many of the countries. Instead, it was found to be more effective to look at government documents to see if they contained information about the total sheep population over time. An example of this was sheep in Brazil. Brazil is known for its cattle sector as it has the second most amount of cattle, behind India, and is the second-largest exporter of beef in the world (Meat and Livestock Australia, 2025). When trying to find research on the sheep population there are a few if any papers that contained information on the total sheep population that was not already citing FAOSTAT or WOAH as their source for their sheep data. Most research efforts were directed toward the much larger cattle population. Instead, it was found to be more effective to find sheep population data from the Brazilian government, which had it on the Brazilian Institute of Geography and Statistics (IBGE, 2025) website. This data was used to compare against FAOSTAT and WOAH data, which showed very similar populations resulting in a high degree of certainty for WOAH and FAOSTAT.
There are also issues in investigating data from countries where livestock is not a big contributor to Gross Domestic Product (GDP). Countries such as India and China where livestock production and exports are significant for the country’s GDP (Our World in Data, 2025) are typically tracked more than other Asian countries. This is because livestock production creates a lot of money for their economies and changes to livestock populations can have massive implications for people working in these areas and impact the tax revenue they produce. Countries where the livestock is consumed primarily by the family who grows it—known as subsistence agriculture—do not track this metric as well because it can be harder to gather data for multiple reasons. These reasons include people lying about their herd size, living in remote areas, being nomadic thereby making it hard to count their livestock, or lack of resources due to being an underdeveloped economy. People may be reluctant to provide accurate herd size because it is where they store their wealth and they may not want to divulge their worth, such as pastoralist communities in Ethiopia (Catley et al., 2014). Another reason people may lie about their herd size under the fear that they might get taxed more, such as with cattle ranchers in Australia (Fordyce et al., 2023). Nomadic people may migrate between provinces or countries chasing grazing land for their animals, which may make it hard to count their livestock populations (Faye, 2020). Finally, countries may not prioritize conducting surveys on all the various types of livestock due to resource constraints. These are some of the many reasons why countries may have issues collecting accurate livestock data.
Another issue identified when trying to corroborate data between FAOSTAT and WOAH and external sources is that there are some countries whose internet cannot be accessed from abroad. When trying to research Iranian livestock data collected from the government from Iran, it was found that they have banned users outside Iran from accessing government websites. This can make it challenging to check FAOSTAT and WOAH data against government data as users cannot access it from abroad. There is not a way to circumnavigate this and instead, other sources must be used to find livestock population data inside the country. One such method is looking at research performed by the universities residing in Iran. An example of this is a paper on Holstein cows in Iran by Hadi Atashi from Shiraz University in Iran (Atashi and Hostens, 2021), which contains population data on cattle from 2009 and 2010. FAOSTAT and WOAH data can be compared against this to see how similar the three sources are to each other. Using papers like this can help to compare WOAH and FAOSTAT to local sources. The only drawback to this is it is a very time-consuming and manual process to find research papers that contain any reference to population size for a specific year.
5 FAOSTAT Flags
FAOSTAT data differs from WOAH’s data in that each data point is given a flag that indicates more information. The flags can be viewed using GBADs FAOSTAT Data Visualizer (The Global Burden of Animal Diseases, 2025) and the flag information is provided by FAOSTAT (FAOSTAT, 2025c). There are many different flags that FAOSTAT label the data with. Examples include Official, Estimated, Imputed, Non-FAOSTAT, and Missing among many more. These can give us insight into unusual data trends. An example of this is the FAOSTAT Chinese cattle data. In 1996 and 1997 there is a massive drop in the population of almost 20 million cattle. These data points are labeled as non-FAOSTAT data. This means the data came from a non-traditional source, such as a non-government organisation (NGO) or a private company. Given that this data is just denoted as missing and not given any more context, this can increase the uncertainty of data since there is no way to tell what the other organization used to find the data and how they collected their data. This understanding of the flags can also help researchers when picking their data. Since researchers can easily see the flags and gain more insight into their data using this tool, they can help them make a more educated decision on which data to use by understanding how the data was collected.
6 Labelling Data
Fifteen countries and four livestock species were chosen to be labelled as part of this research. This was done to test and optimise the methods presented in this paper as well as to make pre-researched and labelled data available to researchers. Each label was for a specific country, species, year, and source and contained reasoning, research source link, and score. The reasoning was a short section of text written to summarise what element was being observed or what external influence was occurring at the time. It explained the consequence of the influence or observation in relation to the data and what the expected outcome would be. An example of this would be the Canadian chicken population between 2007 and 2011. The reasoning given to this subset of data was that the FAOSTAT chicken population had zero change between these years. It would be expected that there was some slight population variance given that the population was so large. Since broiler chickens have a short lifespan of around 35 days (Food Business, 2025) it is unlikely that the population remained exactly the same across this entire time. For the source, the GBADs population dashboard is cited as the user can view the data directly and see the flat population over the given time range. For the score, it was given a one out of five due to how unlikely this population trend is. The scoring is naturally subjective and biased, given that there is no easy way to make a standardised scoring system to compare influences on data. There is no clear way to make a standardised scoring system when comparing so many different impacts on livestock data and their severity. The intent was to make a rough one-size-fits-all approach to grading that would help researchers using the data identify the points with a high degree of unlikeliness more easily. The intent was not for them to take this as fact but to view the low scores as a highlighted point that they should investigate on their own to make their own informed decisions.
7 Conclusion
When looking into the quality of the FAOSTAT and WOAH datasets, there was no single best method to validate the population data. First, multiple elements needed to be researched to identify if the magnitude of the data could be corroborated with another source. Historical external influences needed to be investigated to understand if the population changes could be justified by an external influence. Finding sources to cross-reference against FAOSTAT and WOAH was challenging as many resources just cite FAOSTAT and WOAH instead of collecting data themselves, which highlights the importance of this research. To find sources whose data also contain livestock population magnitudes, census data from government websites and research papers were investigated. Research papers can contain population numbers for a point in time or a time period. If the data is exactly the same as either the FAOSTAT or WOAH data across the whole time period, then it should be discarded as a valid comparison because the paper or article is most likely reporting FAOSTAT or WOAH data, which can be confirmed by checking the sources used by the paper.
When investigating the trends in the data, some factors can and do affect every country, such as consumer preferences, droughts, recessions, and economic policies. There are also local influences that require a good understanding of a country and the events that occur there. An example of this is the United States, which is tornado-prone so tornadoes can have a big impact on concentrated livestock populations, such as hogs, which sit primarily in a few states (World Population Review, 2025) that overlap with tornado-prone states (Deventer, 2023). Another example is wars, which can heavily impact countries due to reduced population tending to farms and potential widespread destruction. However, many countries do not engage in international wars such as Switzerland, which is a neutral country so wars do not affect it. Researchers therefore need to have a good understanding of a country to do a thorough investigation of the influences on it.
Given all these investigation methods, a researcher cannot be 100% certain that a trend in data is incorrect unless proven to be. An unexplained trend cannot be ruled as wrong because there is a possibility that there is a factor influencing the population that the research has not yet found, or was not recorded. So all a researcher can do is prove and validate trends and magnitudes in the FAOSTAT and WOAH data. To assist researchers with these, the labeled data produced during this research, and the software tool used are all open source on the GBADs GitHub repository.
8 Data and Code
8.1 Software Links
GBADs Informatics homepage https://www.gbadske.org The labelled data https://doi.org/10.5281/zenodo.14662697 The software tool https://doi.org/10.5281/zenodo.14662536 The software tool for finding FAOSTAT flags https://gbadske.org/dashboards/visualizer/
Competing Interests
All authors work for the Global Burden of Animal Diseases which funded this research.