
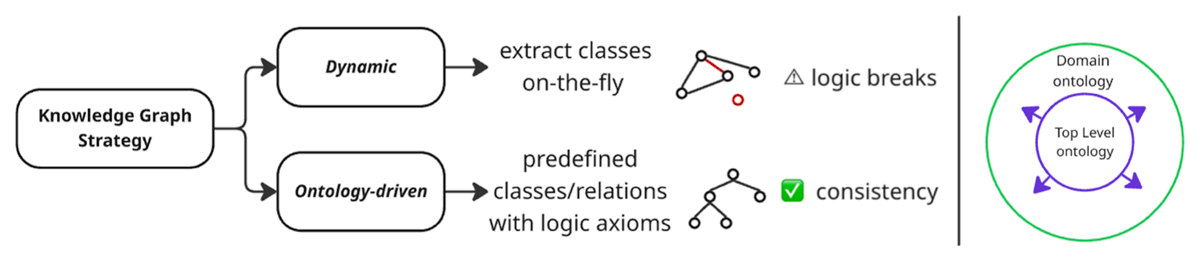
Figure 1
Two approaches to building knowledge graphs and TLO ontology expand to specific domain.
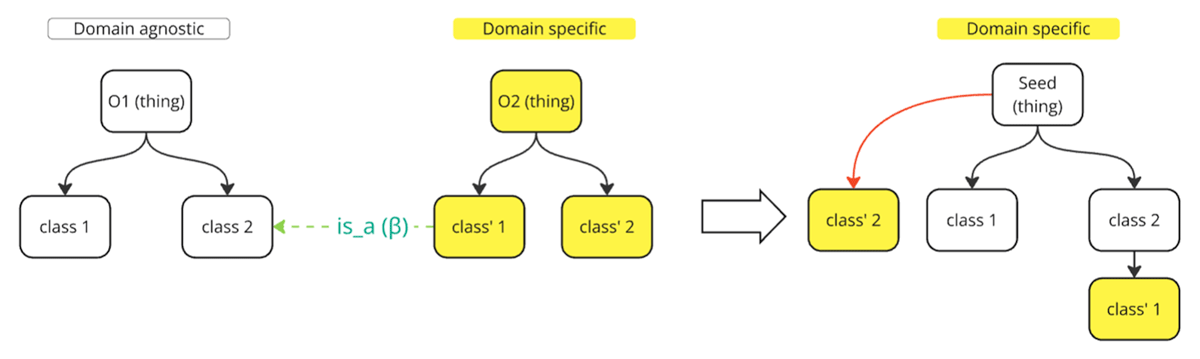
Figure 2
Identifying the most similar classes between two ontologies and linking them with an is_a relationship. ITSMO classes are always mapped as descendants of DOLCE classes; if an ITSMO class’s parent has no DOLCE counterpart, the parent defaults to Thing. A pair of classes (c,d) becomes a candidate link when:
Where e(∙) is the class embedding and β is tunable threshold (hyperparameter). A similar mapping strategy discussed in Li et al. (2023) and Jiménez-Ruiz et al. (2022).
Table 1
Key metrics of DOLCE-lite and ITSMO ontologies.
| DOLCE-LITE | ITSMO | |
|---|---|---|
| Axiom count | 534 | 584 |
| Logical axiom count | 349 | 228 |
| Declaration axioms | 107 | 109 |
| Class count | 37 | 43 |
| Object property count | 70 | 41 |
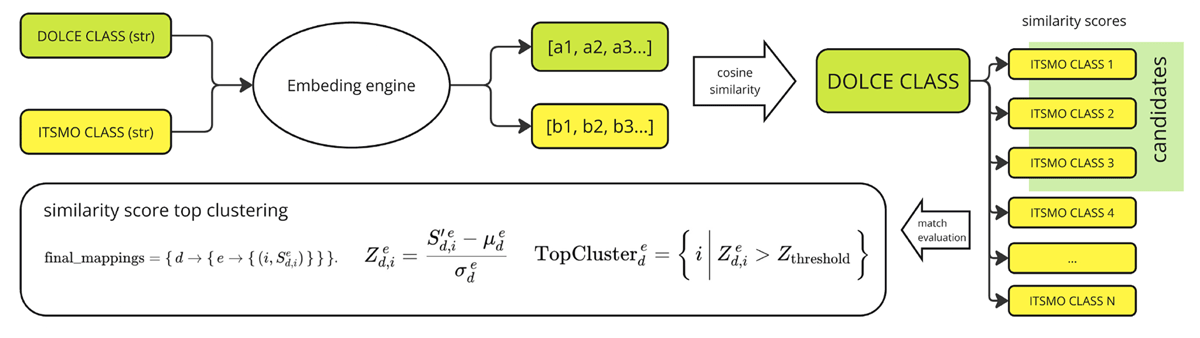
Figure 3
Textual descriptions of classes are transformed into embeddings. Cosine similarities between a DOLCE class embedding and all ITSMO class embeddings are computed. The top three candidates with highest cosine similarity for that DOLCE class form the initial match cluster. We then apply a statistical filter (Z-score) to decide which of these top candidates are significantly above the others in similarity. If fewer than three candidates survive filtering, the remaining slots are marked as ‘No match’ (indicating the DOLCE class may not have a clear corresponding ITSMO subclass).
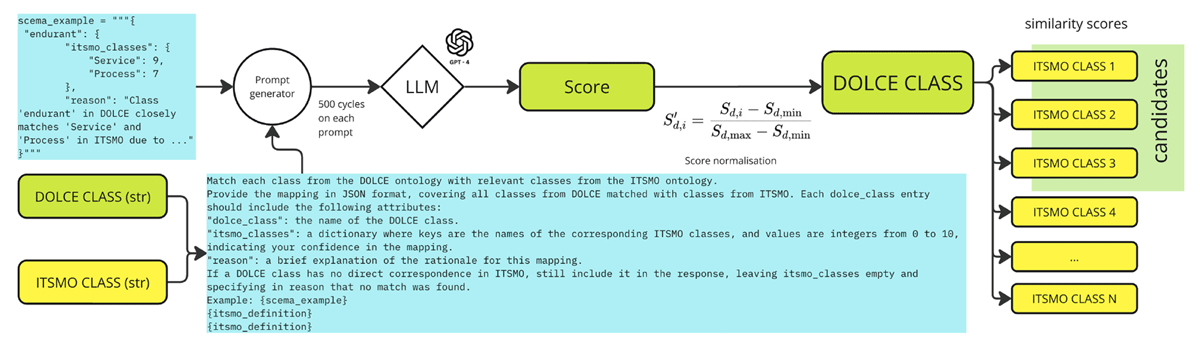
Figure 4
All class descriptions (or a subset) are provided to an LLM in a prompt, and the LLM scores the compatibility of classes. We repeated the process many times (500 trials for each DOLCE class with different sampling noise) to get stable estimates. The three ITSMO classes with the highest average scores for a given DOLCE class are taken as the top cluster, and then similarly a z-score filter is applied to those scores.
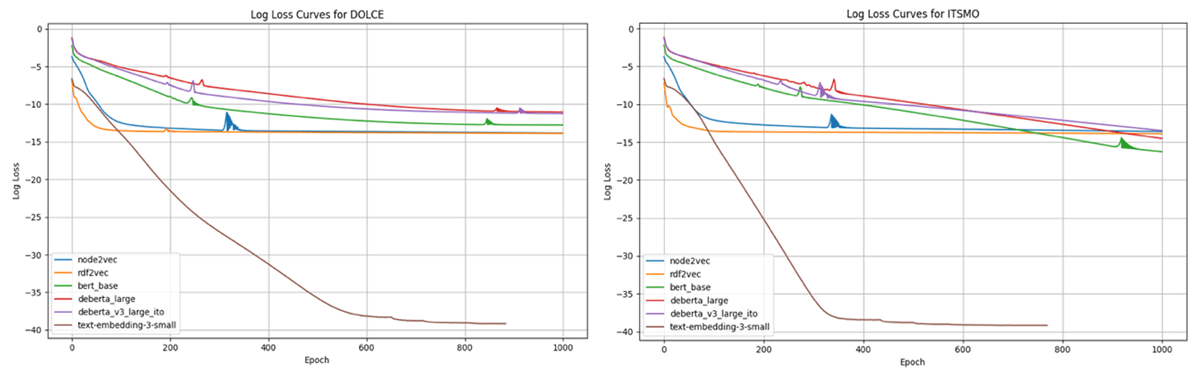
Figure 5
Loss function graphs for a graph neural network initialized with different embeddings.
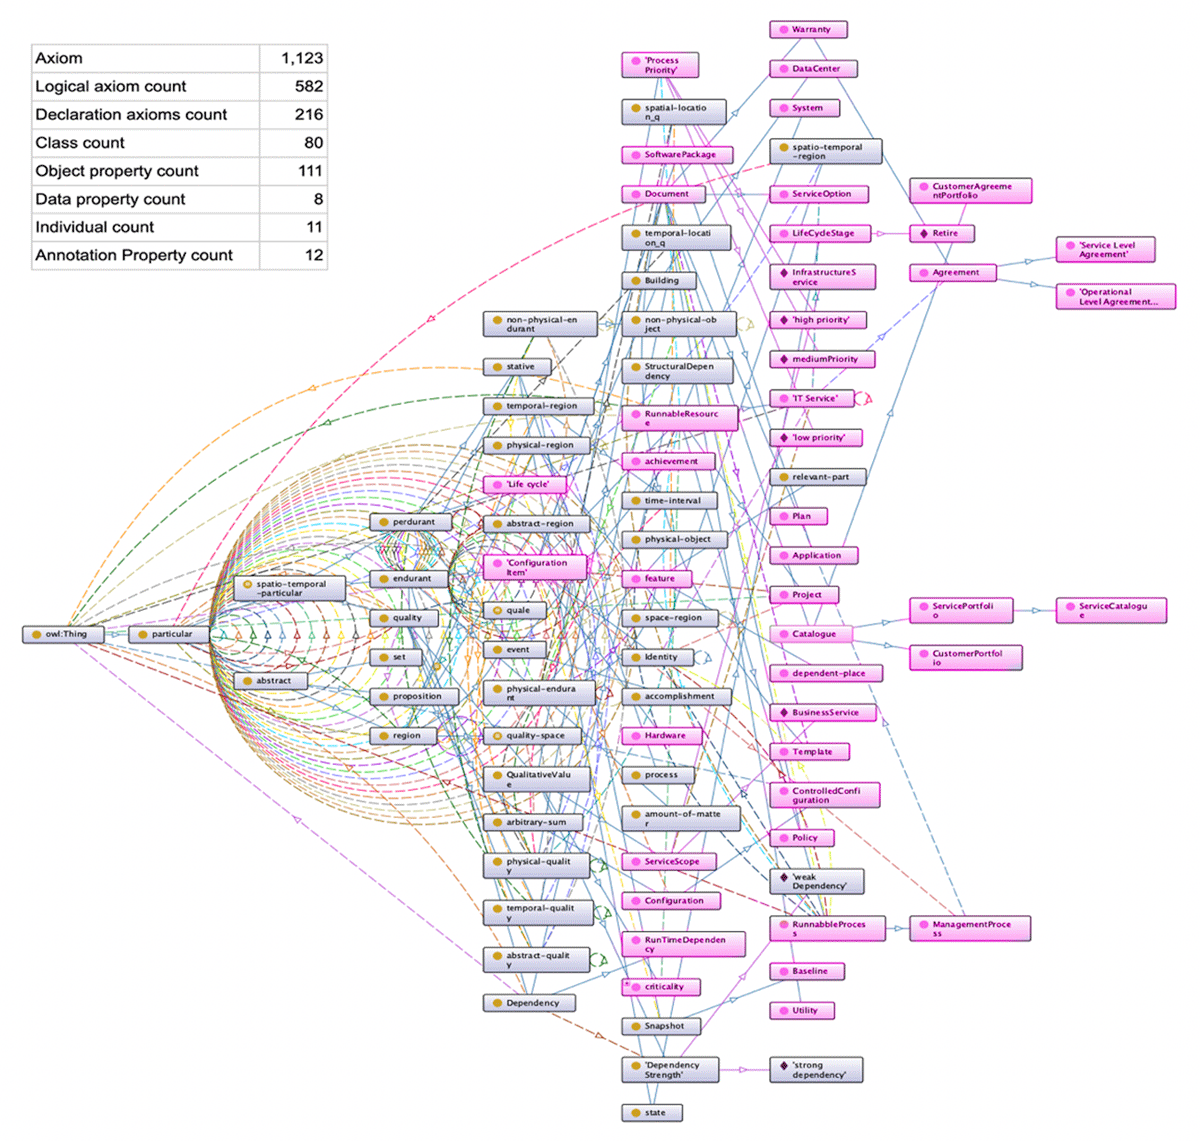
Figure 6
Resulting ontology after merging. Screenshot from Protégé OntoGraph. Extended classes marked in purple.
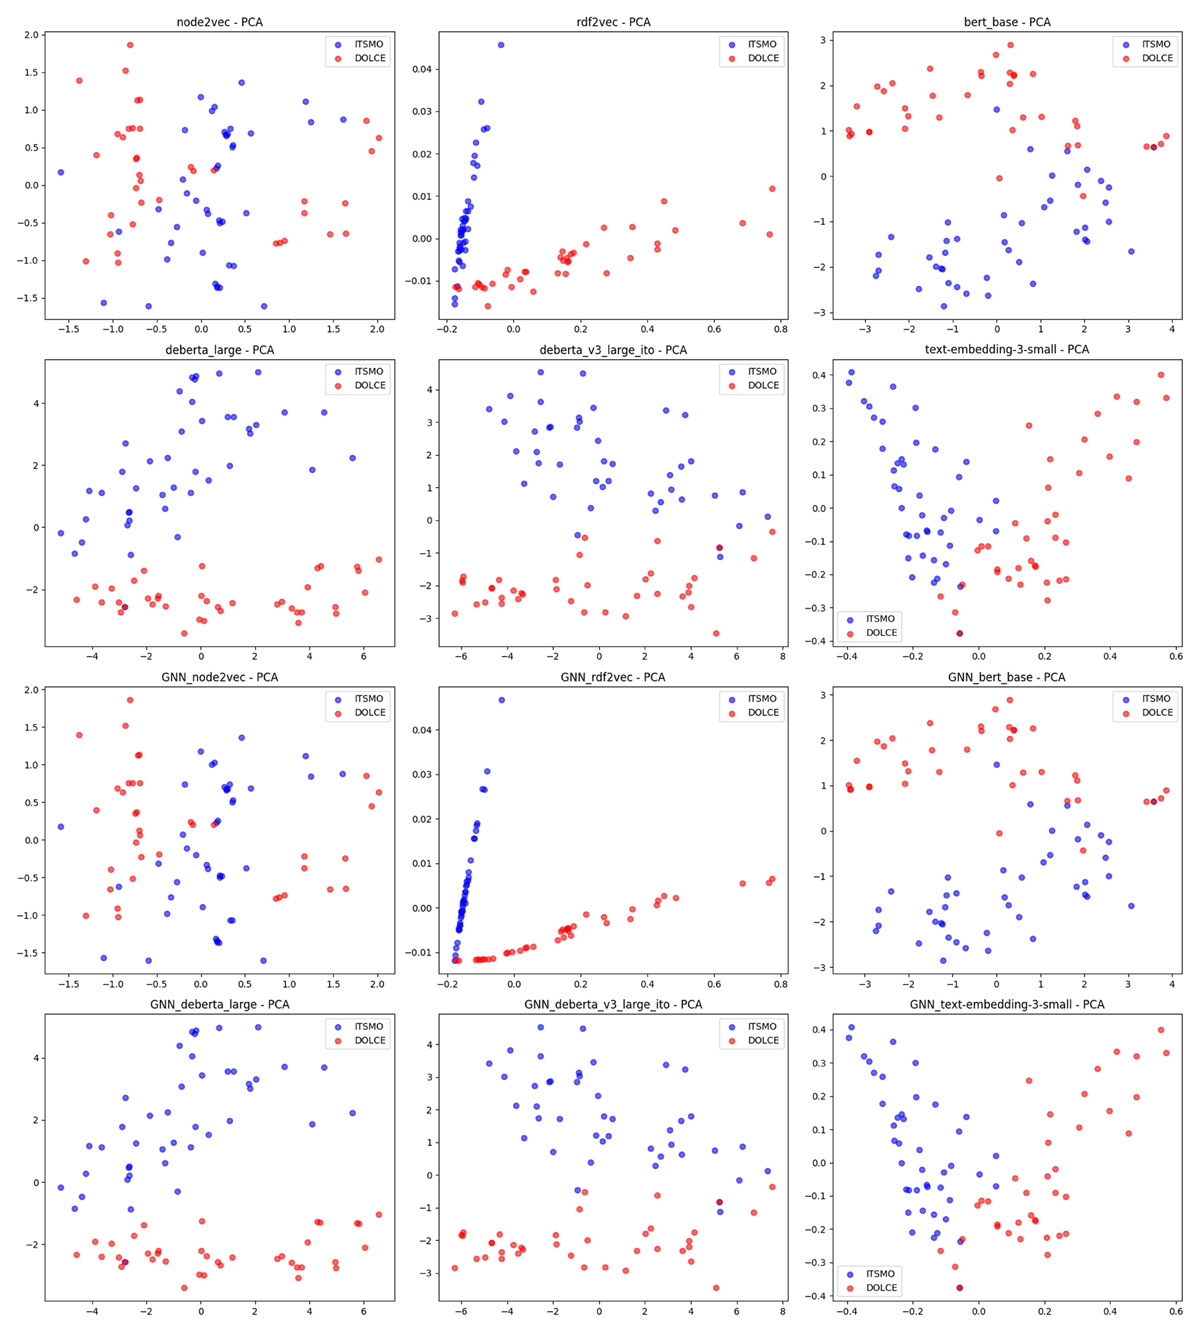
Figure 7
Visualization of embedding distribution in two-dimensional space using the PCA method.
Table 2
The GNN induced a pronounced smoothing for RDF2Vec and minimal change for transformer-based embeddings (DeBERTa/BERT/text-embedding-3-small) and Node2Vec.
| rdf2vec | deberta_large | text-embedding-3-small | bert_base | deberta_v3 _large_ito | node2vec | |
|---|---|---|---|---|---|---|
| mean_var_before | 0,04977 | 0,00156 | 0,004112 | 0,002142 | 0,002241 | 0,01593 |
| mean_var_after | 0,037378 | 0,00156 | 0,004112 | 0,002142 | 0,002242 | 0,01593 |
| delta_mean_var | –1,24E-02 | –2,90E-08 | 9,48E-10 | 6,80E-08 | 3,50E-07 | 4,40E-07 |
| median_IQR_before | 0,31139 | 0,041323 | 0,084101 | 0,058961 | 0,068114 | 0,146014 |
| median_IQR_after | 0,112369 | 0,041257 | 0,084101 | 0,058981 | 0,068094 | 0,146956 |
| delta_median_IQR | –1,99E-01 | –6,69E-05 | 4,63E-08 | 2,01E-05 | –2,03E-05 | 9,43E-04 |
| mean_Hnorm_before | 0,963367 | 0,97806 | 0,955335 | 0,964831 | 0,969643 | 0,965019 |
| mean_Hnorm_after | 0,977953 | 0,978057 | 0,955335 | 0,964851 | 0,969646 | 0,965041 |
| delta_mean_Hnorm | 1,46E-02 | –2,74E-06 | –9,35E-09 | 1,92E-05 | 2,18E-06 | 2,22E-05 |
| ks_D | 0,567669 | 0,003759 | 0,000627 | 0,003759 | 0,002506 | 0,005639 |
| ks_p | 1,40E-237 | 1,00E+00 | 1,00E+00 | 1,00E+00 | 1,00E+00 | 1,00E+00 |
| mean_max_before | 0,890243 | 0,90308 | 0,394644 | 0,867358 | 0,886934 | 0,71366 |
| mean_max_after | 0,918296 | 0,903112 | 0,394644 | 0,867395 | 0,886976 | 0,713109 |
| delta_mean_max | 2,81E-02 | 3,18E-05 | 5,10E-08 | 3,67E-05 | 4,17E-05 | –5,51E-04 |
Table 3
Summary of class alignment accuracy results.
| EMBEDDING/METHOD | TOP-1 ACCURACY (%) | TOP-3 INCLUSION (%) | MATCHED CLASSES |
|---|---|---|---|
| Random (baseline) | 27.6 | 31.0 | 63 |
| node2vec | 10.5 | 21.1 | 103 |
| GNN_node2vec | 7.9 | 18.4 | 102 |
| rdf2vec | 0.0 | 0.0 | 2 |
| GNN_rdf2vec | 0.0 | 0.0 | 0 |
| bert_base | 26.3 | 50.0 | 105 |
| GNN_bert_base | 28.9 | 57.9 | 105 |
| deberta_v3_large | 39.3 | 64.3 | 60 |
| GNN_deberta_v3_large | 35.7 | 60.7 | 60 |
| deberta_v3_large_ito (FT) | 34.2 | 63.2 | 92 |
| GNN_deberta_v3_large_ito | 28.9 | 57.9 | 92 |
| text-embedding-3-small | 28.9 | 63.2 | 113 |
| GNN_text-embed-3-small | 21.1 | 71.1 | 113 |
| GPT-4o (LLM labels) | 73.5 | 82.4 | 55 |