
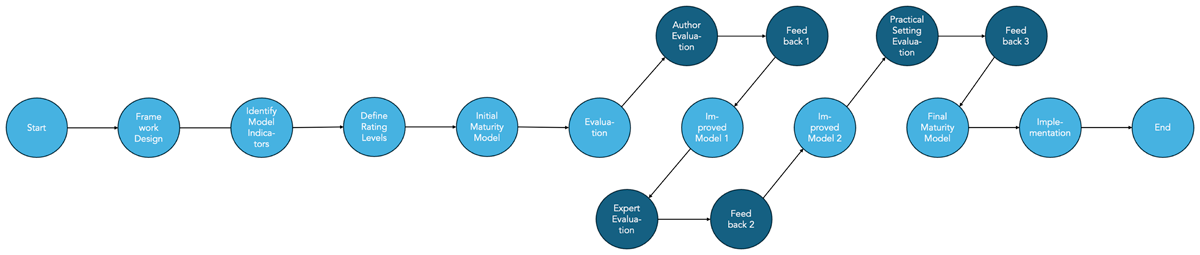
Figure 1
Methodology flowchart for establishing a common framework for measuring the maturity of organizational RDM services.
Table 1
Common dimensions in representative RDM service maturity models.
| DIMENSIONS | RELATED DIVISIONS | ANDS | DCC | COX & VERBAAN | ARL |
|---|---|---|---|---|---|
| Awareness | — | Awareness | Cross-unit collaboration | ||
| (part of) Culture of data sharing and re-use | |||||
| Data policy | Research Promotion Division/Research Administration Division | Institutional policies and procedures | RDM Policy and Strategy Development | Leadership | Leadership (vision, strategy, culture) |
| Governance of data access and reuse | Governance | Governance | |||
| Budget | Executive | Funding | Cost and budgeting | ||
| Business planning and sustainability | |||||
| Services | Library | Support services | Data Management and Sharing Plans | Support and advice/Data management planning | |
| Managing change and RDM service design | Services/Research life cycle support | ||||
| Data cataloguing and publishing | |||||
| RDM skills training and consultancy | Training | Human capital | |||
| User needs | — | Evaluation | Users and stakeholders | ||
| Information | |||||
| IT infrastructure | IT center | Infrastructure | Access & Storage Management | Technological infrastructure | |
| Digital preservation and continuity |
Table 2
Common RDM service maturity models in academic institutions.
| DIMENSIONS | EVALUATION CRITERIA | INITIAL | REPEATABLE | DEFINED | MANAGED | OPTIMIZED |
|---|---|---|---|---|---|---|
| Awareness | Cooperation status with other departments | None/ad hoc | Concepts shared | Collaborated between related departments | Departments related to RDM implementation are visualized institution-wide. | Cross-departmental committees are held regularly to share issues. |
| Data policy | Policy establishment level and implementation status | None/Partial (*Data preservation policy, etc.) | Data policy has been formulated. (Operational procedure not yet implemented/currently being implemented in some departments) | Data policy has been formulated and clearly stated operational procedures for each department | Achievement goals and implementation status for each department are visualized | Discussions are being held for improvements based on the implementation status of each department |
| Budget | Budget allocation disposition | None | Yes (for implementation) | Yes (for operation and time-limited/discretionary) | Yes (for regular operation; already distributed to each department) | Yes (for regular operation; allocated based on budget plan) |
| Services | Status of managing services | Ad hoc | Each department has started providing services that can be realized | Created and maintained a list of services by the institution | Stated the relationships between the services and effectively coordinated | The service lifecycle is managed based on feedback from users, cost, and risk assessments. |
| User needs | Status of understanding user needs | None/Limited | Only some services/specific fields only | Survey targeting institution-wide users | Conducting ongoing/regular surveys | Survey results/items are regularly reviewed based on surveys by other institutions |
| IT infrastructure | IT infrastructure construction status | Ad hoc | Covers only part of some departments | Providing institution-wide RDM infrastructure | Service connected between RDM infrastructures | Conducted regular reviews of RDM infrastructures |
Table 3
List of key performance areas in the Services and IT infrastructure dimensions.
| DIMENSIONS | KEY PERFORMANCE AREAS |
|---|---|
| Services | Creating data management plan |
| Training in data literacy | |
| Managing Intellectual Property Rights | |
| Storing data | |
| Publishing data | |
| Curating data | |
| Obtaining and citing data | |
| IT infrastructure | Data storage |
| Data repository | |
| Data analysis platform | |
| Research information system |
Table 4
Example of the question-and-answer options.
| QUESTION | ANSWER OPTIONS |
|---|---|
| Has any budget been set aside for IT system costs, personnel costs, etc., related to RDM? | 1) No |
| 2) Accounted within the operational costs of the responsible department | |
| 3) Accounted by the institution’s overall operating costs | |
| 4) Accounted by external funds | |
| 5) I do not know |
Table 5
Overview of the questionnaire survey.
| SURVEY TITLE | SURVEY OF RDM INITIATIVES IN JAPANESE INSTITUTIONS, 2020 | SURVEY OF RDM INITIATIVES IN JAPANESE INSTITUTIONS, 2022 |
|---|---|---|
| Summary | Recently, Japanese universities and research institutions are required to formulate data policies and establish a RDM system to appropriately store research data and share them to third parties as necessary. In light of this situation, the Japan Consortium for Open Access Repository (JPCOAR) and the Academic eXchange for Information Environment and Strategy (AXIES) conducted an online questionnaire survey to ascertain the status of RDM initiatives at universities and research institutions in Japan in 2020. | Recently, Japanese universities and research institutions are required to formulate data policies and establish a RDM system to appropriately store research data and share them to third parties as necessary. In light of this situation, the Japan Consortium for Open Access Repository (JPCOAR) and the Academic eXchange for Information Environment and Strategy (AXIES) conducted an online questionnaire survey to ascertain the status of RDM initiatives at universities and research institutions in Japan in 2022. |
| Universe | Japanese universities and research institutions | Japanese universities and research institutions |
| Sample Size | 352 valid responses | 309 valid responses |
| Date of Collection | November 27, 2020, to December 28, 2020 | November 28, 2022, to December 28, 2022 |
| Sampling Procedure | Non-probability (53.4% limited within the JPCOAR) | Non-probability (42.7% limited within the JPCOAR) |
| Major Survey Items | Basic information/Understanding user needs/Status of developing data policies/procedures/Status of research data management services/Status of IT infrastructure | Basic information/Understanding user needs/Status of developing data policies/procedures/Status of research data management services/Status of IT infrastructure |
| URL | https://doi.org/10.34500/SSJDA.1587 | https://doi.org/10.34500/SSJDA.1588 |
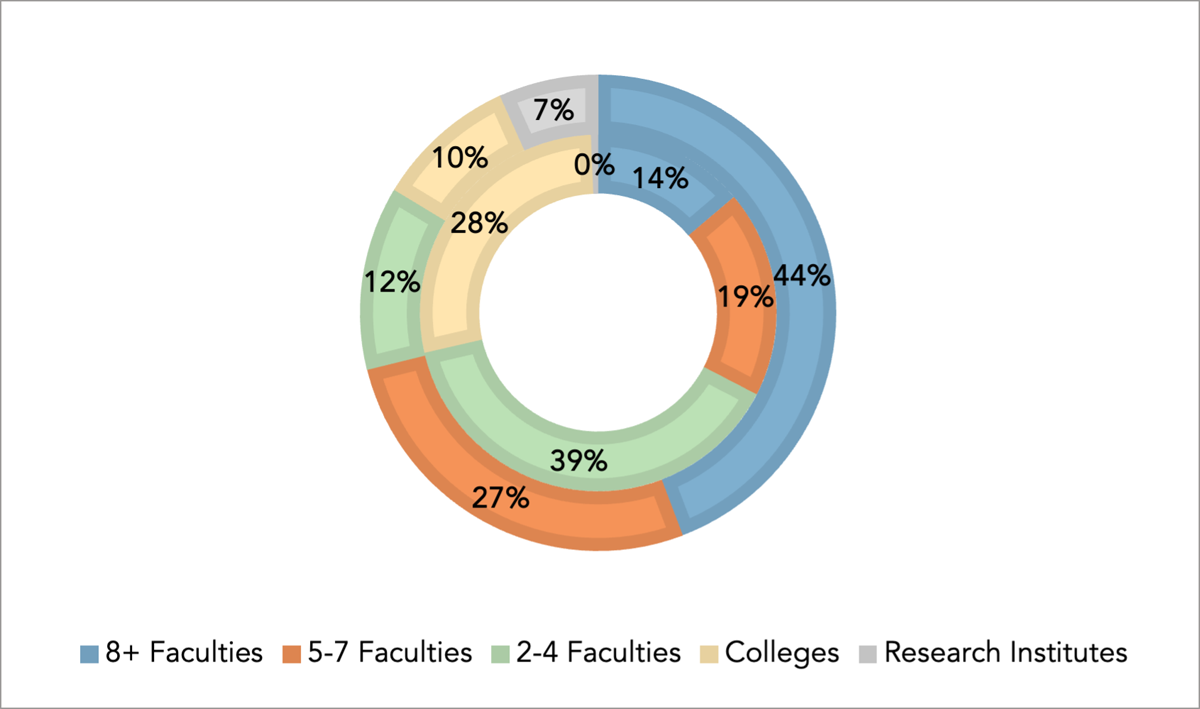
Figure 2
Institution sizes distribution (2020 vs 2022).
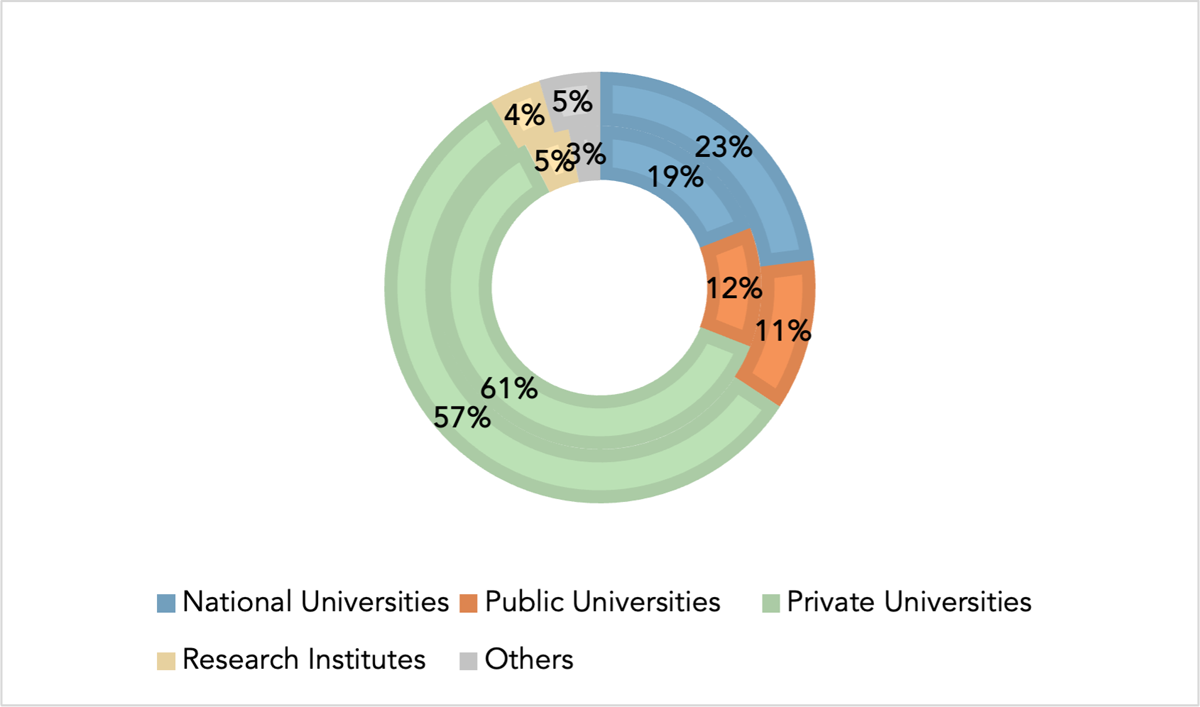
Figure 3
Institution types distribution (2020 vs 2022).
Table 6
Response rates of the ‘I don’t know’ options selected among the corresponding variables calculating each maturity level.
| DIMENSIONS | CORRESPONDING VARIABLE NAMES | 2020 RESPONSE RATES (QUESTION NO.) | 2022 RESPONSE RATES (QUESTION NO.) |
|---|---|---|---|
| Awareness | RDM initiative | 18.5% (Q10) | 11.0% (Q11) |
| Stakeholders | 26.1% (Q13) | 16.2% (Q16) | |
| Data policy | RDM policy existence | 16.5% (Q11) | 11.0% (Q12) |
| RDM procedure existence | 10.8% (Q12) | 4.5% (Q13) | |
| Budget | RDM budget | N/A | 14.9% (Q15) |
| User Needs | Survey existence | 15.3% (Q5) | 11.3% (Q6) |
| Survey scale | 0.9% (Q6) | 0.0% (Q7) | |
| Future survey plan | 1.4% (Q9) | 15.0% (Q10) | |
| Services | RDM services department | 26.1% (Q16) | 3.1% (Q19) |
| IT infrastructure | IT infrastructure status | 17.8% (Q27) | 11.7% (Q28) |
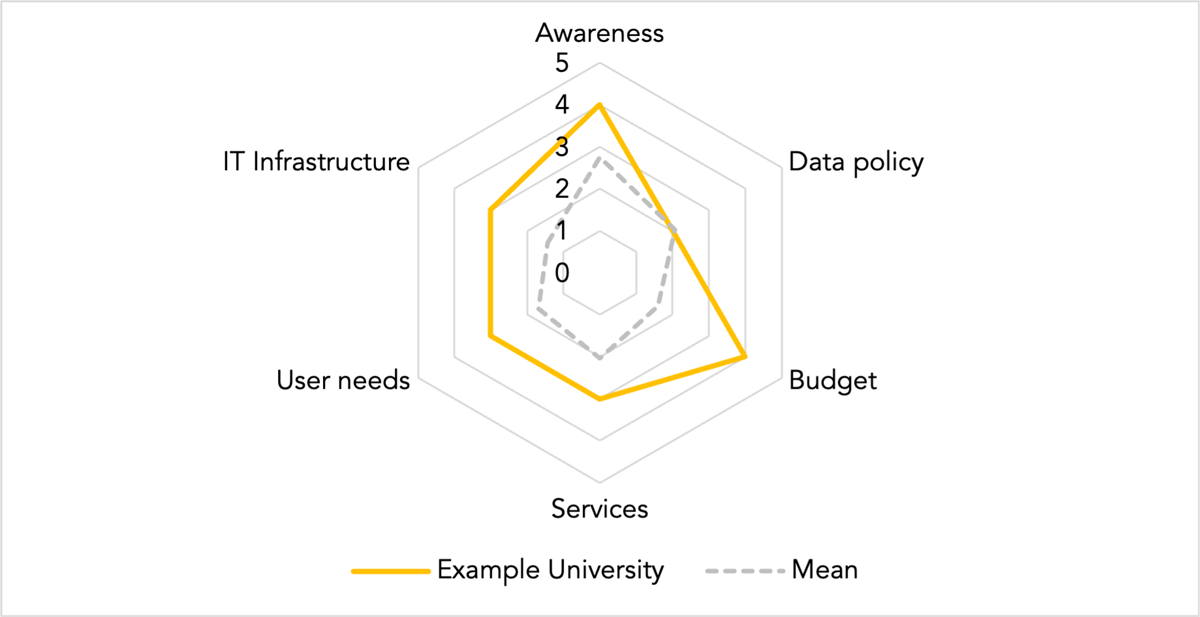
Figure 4
Example radar chart visualizing an organizational RDM service maturity in six dimensions.
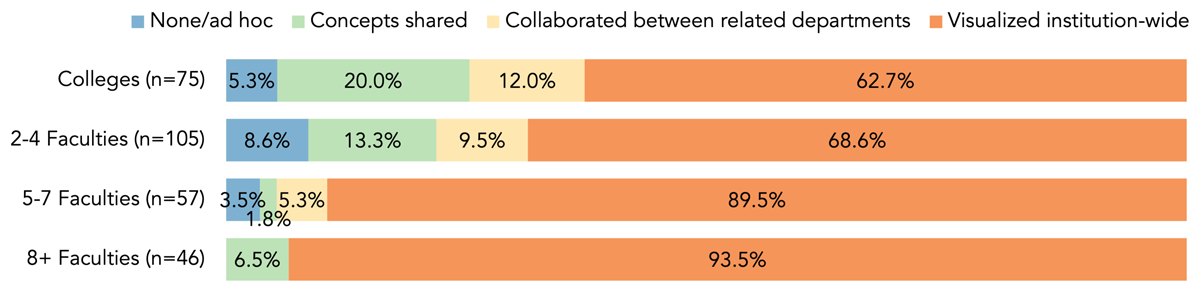
Figure 5
Development status of Awareness by institution sizes.
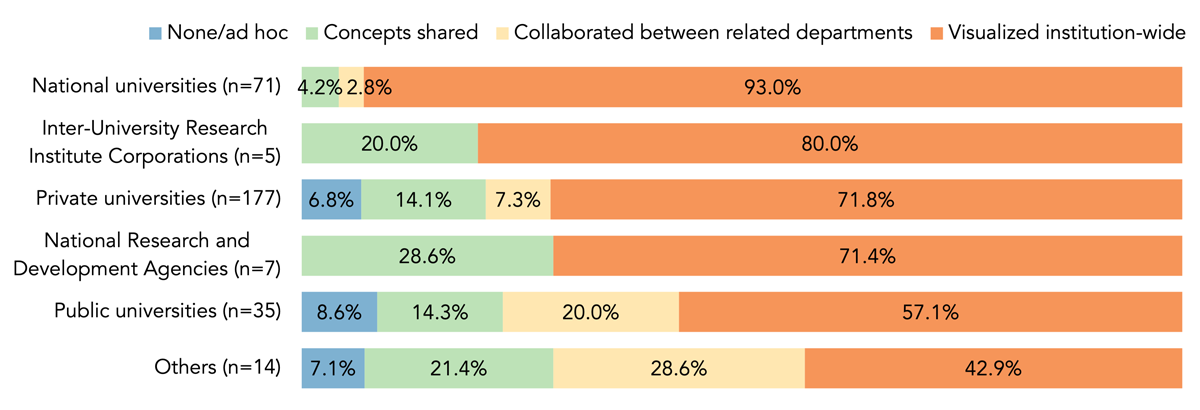
Figure 6
Development status of Awareness by institution types.
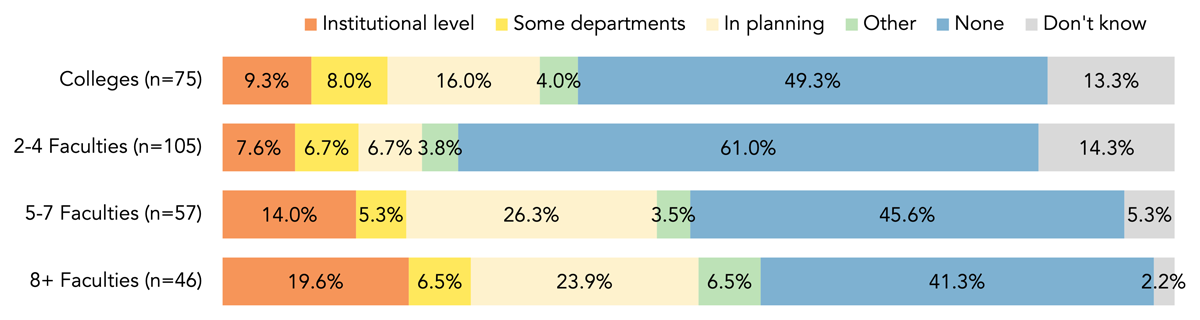
Figure 7
Development status of Data Policy by institution sizes.
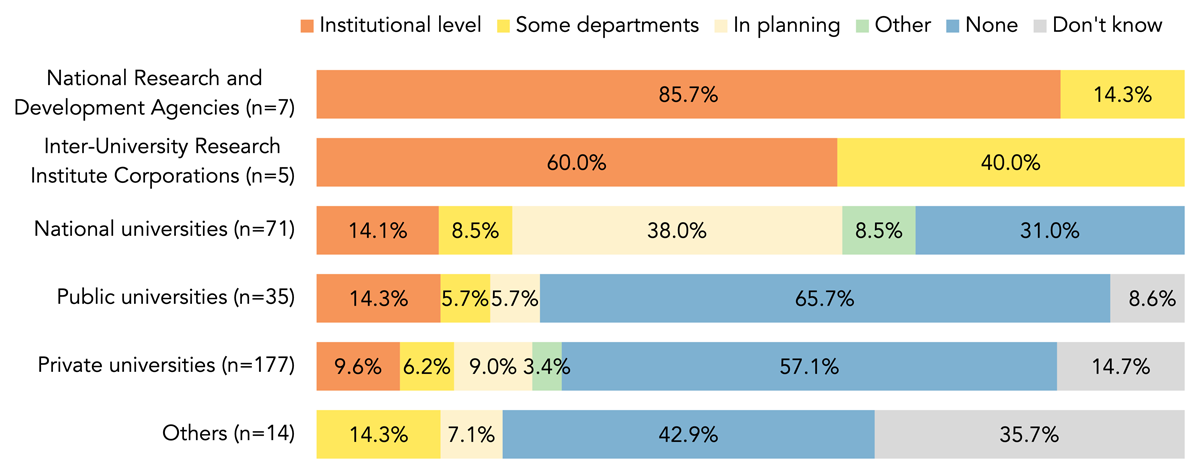
Figure 8
Development status of Data Policy by institution types.
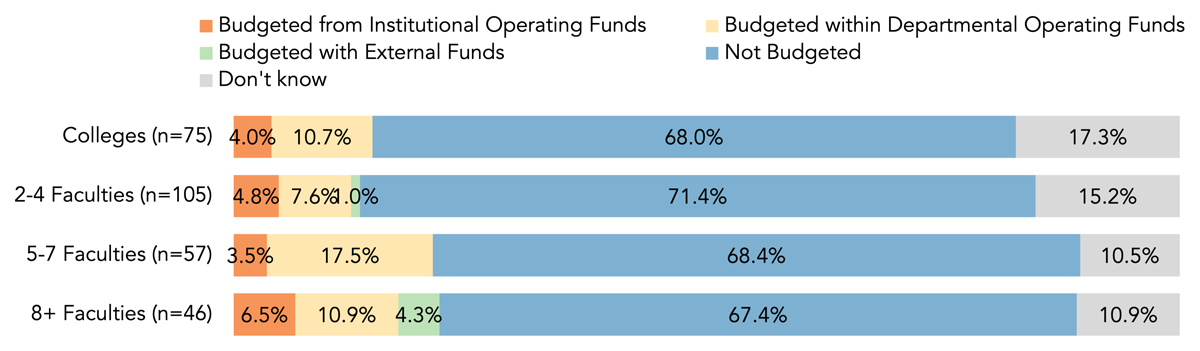
Figure 9
Development status of Budget by institution sizes.
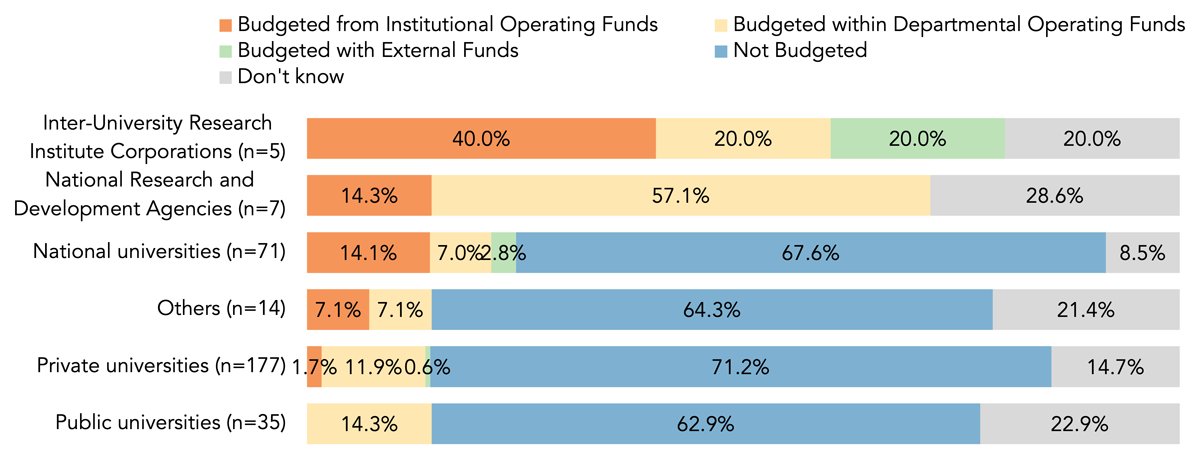
Figure 10
Development status of Budget by institution types.
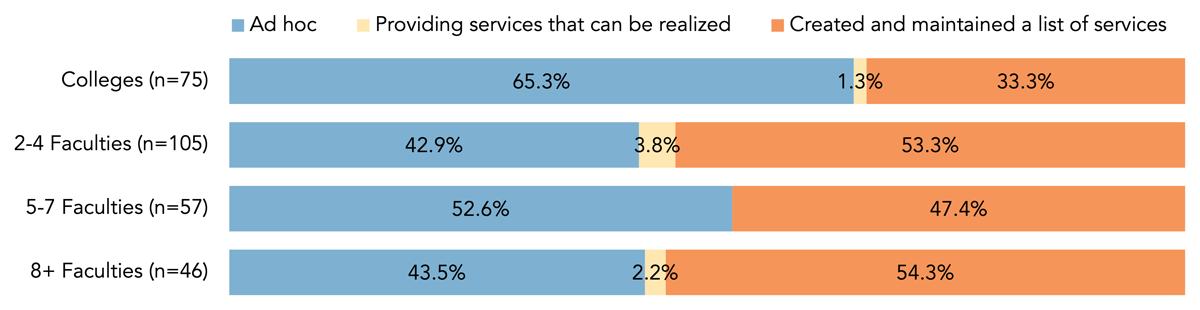
Figure 11
Development status of Services by institution sizes.
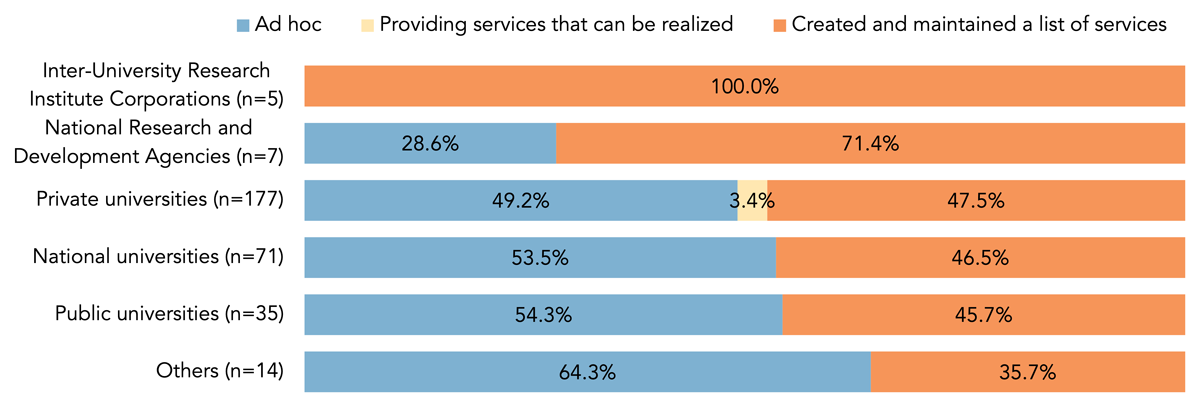
Figure 12
Development status of Services by institution types.
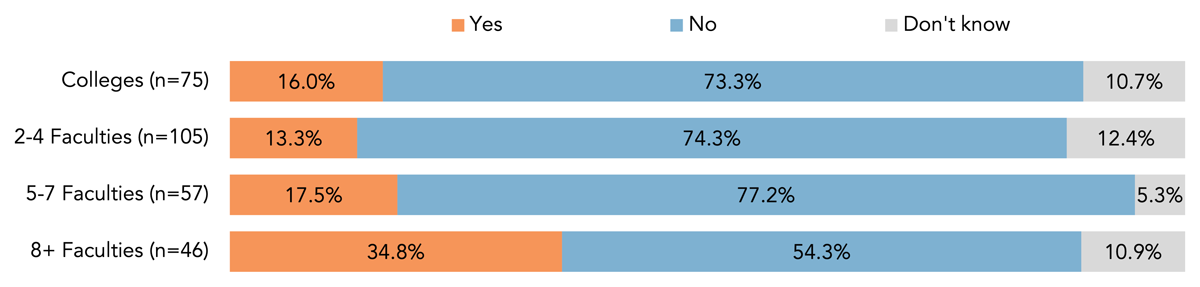
Figure 13
Development status of User Needs by institution sizes.
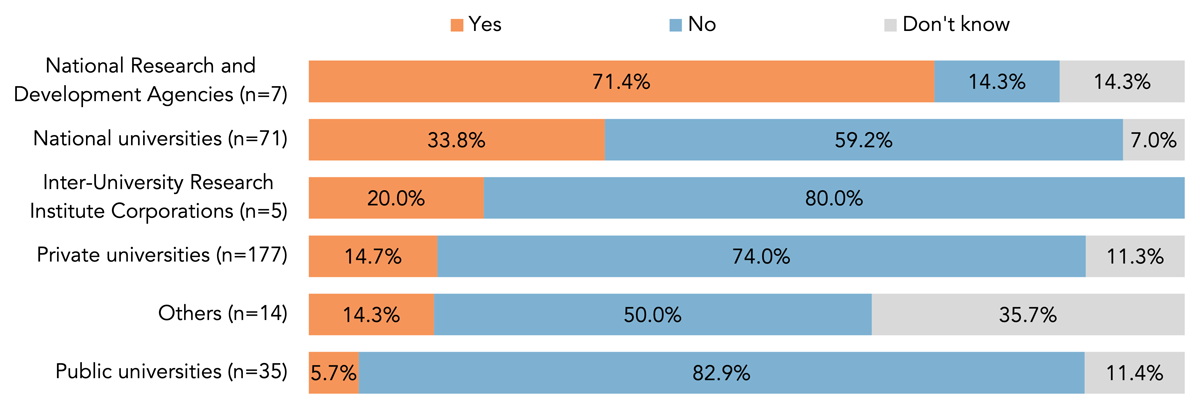
Figure 14
Development status of User Needs by institution types.
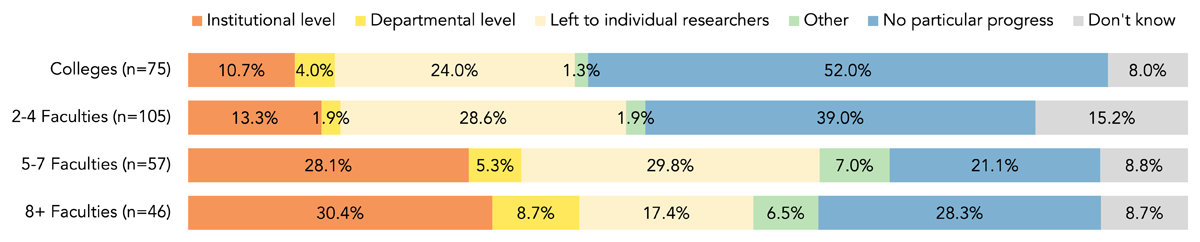
Figure 15
Development status of IT infrastructure by institution sizes.
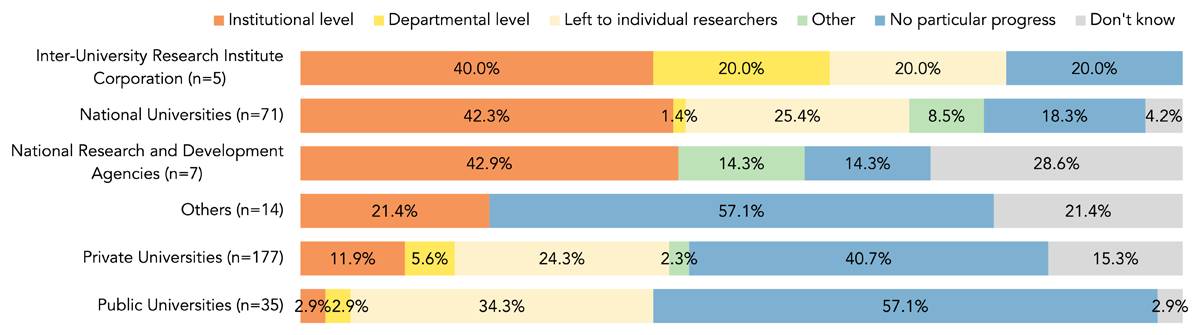
Figure 16
Development status of IT infrastructure by institution types.
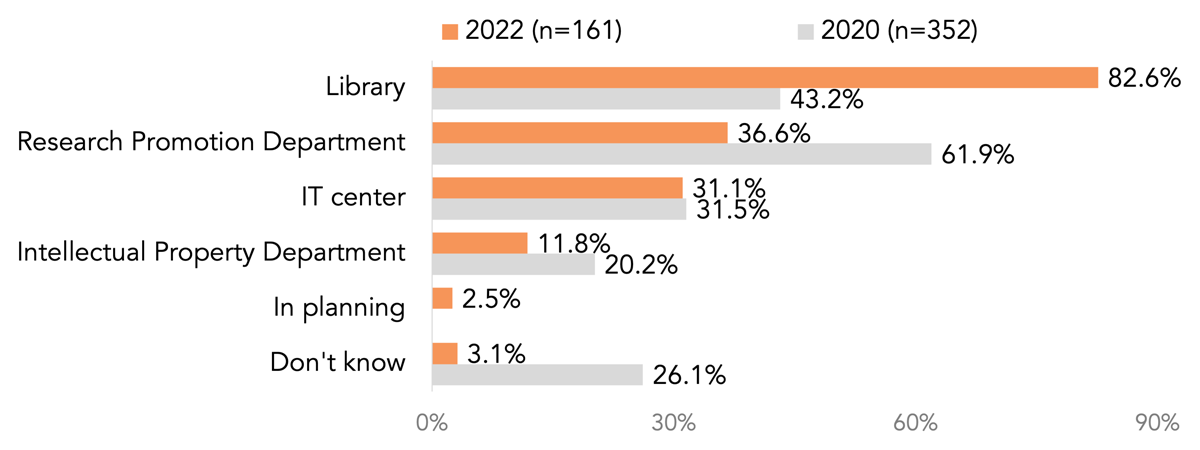
Figure 17
Secular change in Awareness in 2020 and 2022.
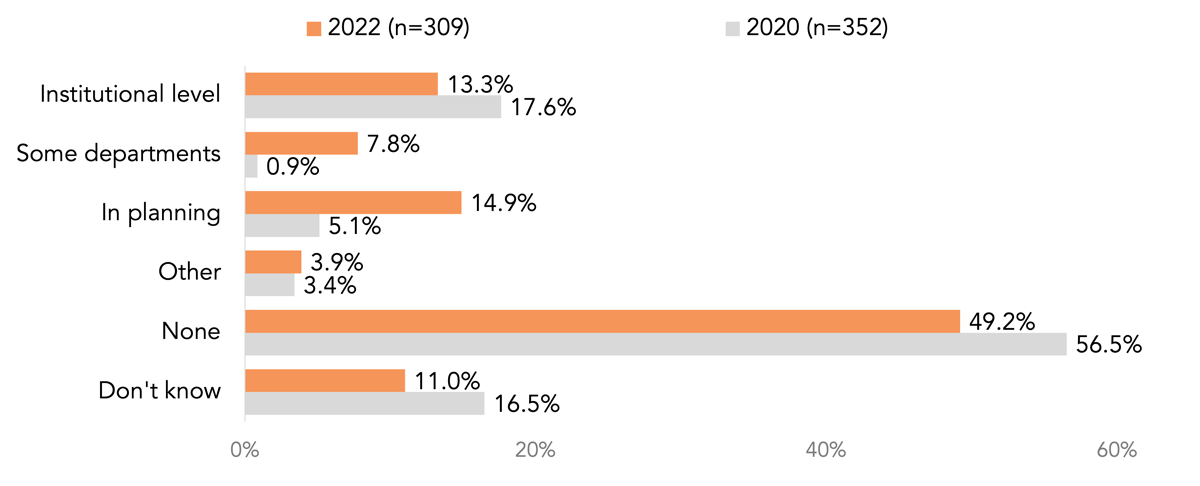
Figure 18
Secular change in Data Policy in 2020 and 2022.
Figure 19
Secular change in Services in 2020 and 2022.
Figure 20
Secular change in User Needs in 2020 and 2022.
Figure 21
Secular change in IT infrastructure in 2020 and 2022.