
1. Introduction
Research data management (RDM) encompasses a set of actions that define and implement methods for storing, processing, and accessing data obtained from research activities (CODATA RDM Terminology Working Group, 2024). Efficient RDM is crucial for researchers, and discipline-specific RDM services are being developed in fields such as the life sciences (Venkatesan et al., 2019), high-energy physics (Chen and Cheng, 2019), and the social sciences (Johnson, 2008). Recently, the development of RDM services has become an international trend in response to the movement promoting open science (UNESCO, 2021).
RDM services include research community practices and organizational practices by universities and research institutions. There are growing expectations for organizational practices that support researchers and strengthen governance (UNESCO, 2021). In Japan, RDM is recognized as a critical issue for supporting academic research in the future, as highlighted in the Sixth Science, Technology, and Innovation Basic Plan (Cabinet Office, 2021). Consequently, university and research institution executive boards are compelled to establish organizational RDM services to fulfill their responsibilities in line with these policy demands.
To establish organizational RDM services, it is necessary to align the requirements of various departments with institutional policies and strategies from their respective perspectives. However, institutional policies and strategies often use general language, and some departments, such as libraries and IT centers, have established practical guidelines based on business-specific standards without considering consistency with institutional policies. Additionally, the needs for RDM services vary according to the size and nature of the institution (Reichmann et al., 2021), making it challenging to reach a consensus among stakeholders on which guidelines to follow and how to prioritize development.
To ensure consistency between stakeholder requirements and institutional policies and strategies, it is essential to establish a common framework to measure the degree of achievement in developing organizational RDM services comprehensively and consistently. The maturity model development approach (CMMI Product Development Team, 2010), derived from the field of software engineering, is widely used as a methodology for developing frameworks to assess the state of RDM service construction. The maturity model is a structured framework that assesses the maturity of services, capabilities, and processes within an organization. It provides step-by-step progression through predefined stages of control and measurement. This approach can enable organizations to identify the current level of RDM maturity and compare it with best practices. Moreover, the stakeholders will recognize gaps in policy implementation, stakeholder engagement, infrastructure, and service delivery, which is essential for realizing organizational RDM services and achieving efficient RDM service development.
This study designs a common framework for constructing organizational RDM services. We analyze existing RDM service maturity models and extract common dimensions to understand organizational RDM services. Thereafter, we evaluate the model through a step-by-step approach to assess its practical applicability. This study advances knowledge in the field of RDM by facilitating strategic alignment with the best international practices.
2. Literature review
This section provides an in-depth discussion of maturity models relevant to RDM services. It contextualizes the development of the proposed framework by reviewing existing maturity models, highlighting their scope, strengths, limitations, and the rationale for selecting specific models for this study.
2.1 Maturity models
The maturity model is a concept for assessing the maturity of targeted domains, such as services, capabilities, and processes. It provides a step-by-step framework by formalizing the target area and mapping the steps of control and measurement (CMMI Product Development Team, 2010). By aligning their initiatives with appropriately defined stages, users can determine the level of service maturity required to achieve their business goals and identify a roadmap for reaching the desired maturity state. Originally developed for the domain of software development, maturity models have evolved and are now applied across a broader range of domains, including support, project management, process management, and engineering.
2.2 Maturity models related to RDM
Maturity models developed for RDM are generally divided into two categories: those designed for practice by researchers and those developed for services and infrastructure. Examples of the former include the ‘Capability Maturity Model for Research Data Management’ (Qin et al., 2014), the ‘Stewardship Maturity Matrix’ (Peng et al., 2015) based on environmental study practices, and the ‘RDM Rubric’ (Borghi et al., 2018) designed by the California Digital Library. These models help assess a project’s or field’s maturity in achieving better data management and reuse (Cox et al., 2019). Examples of the latter category include ‘The Collaborative Assessment of Research Data Infrastructure and Objectives (CARDIO)’ (Digital Curation Centre, 2014) developed by the University of Glasgow, UK; the ‘Research Data Services Maturity Model’ (Kouper et al., 2018) created by analyzing the services of participating libraries of the Association of Research Libraries (ARL), North America; the ‘Data Management Framework’ (Australian National Data Service, 2018) by the Australian Research Data Commons, Australia; and the ‘Maturity Model for Evaluation of RDS’ (Cox and Verbaan, 2018) developed from an empirical model of organizational research data services. These models are based on organizational practices and closely align with practical guidelines. Other models, such as the Research Infrastructure Self-Evaluation Framework (RISE) framework, include perspectives for researchers and services (Rans and Whyte, 2017), while the Technology, Organization, People, and Environment (TOPE) framework is dedicated to the preparatory phase of RDM services (Marlina et al., 2022).
2.3 Gaps in existing models
While these models provide valuable insights into RDM practices, they exhibit the following limitations. The models differ in their focus areas, ranging from project-level data management to library-centric support services, without offering a comprehensive organizational perspective. Also, most models do not adequately address strategic alignment with institutional governance and cross-departmental collaboration. To develop a common framework applicable to various institution types, the divisions in several models must be reformalized, and the common criteria to achieve each level must be clarified based on practical implementation.
3. Methodology
Given the limitations of existing maturity models, there is a critical need to develop a comprehensive organizational maturity model for RDM services. To achieve this objective, this study aims to establish a common framework for comprehensively and consistently measuring the maturity of RDM services in developing organizational RDM services. We have conducted the study in three steps: framework design, evaluation, and implementation. First, we design a common framework for constructing organizational RDM services. Next, we evaluate the model using a step-by-step approach. Finally, we discuss the potential value and utilization of the framework. Figure 1 shows a flowchart outlining each of the steps covered in Section 3.
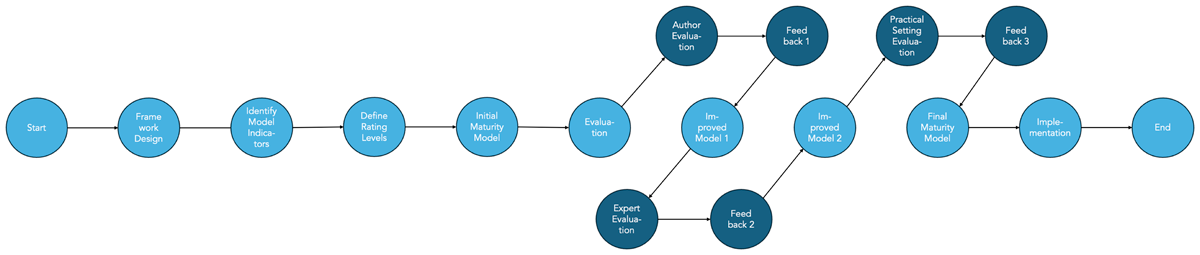
Figure 1
Methodology flowchart for establishing a common framework for measuring the maturity of organizational RDM services.
3.1 Framework design
This section outlines the design of a common framework for constructing organizational RDM services. Although previous models shown in Section 2 cover the necessary perspectives for developing an RDM service maturity model, their scope and motivation differ slightly. The focus of this study is to design an organizational common framework consistent with the existing models; from this perspective, four models belonging to the service and infrastructure category (CARDIO, DCC, ANDS, and Cox and Verbaan) can be considered. To reformalize the model based on the practices of each department, we compared these representative RDM service maturity models and extracted common dimensions. Table 1 presents the comparison of these existing models.
Table 1
Common dimensions in representative RDM service maturity models.
| DIMENSIONS | RELATED DIVISIONS | ANDS | DCC | COX & VERBAAN | ARL |
|---|---|---|---|---|---|
| Awareness | — | Awareness | Cross-unit collaboration | ||
| (part of) Culture of data sharing and re-use | |||||
| Data policy | Research Promotion Division/Research Administration Division | Institutional policies and procedures | RDM Policy and Strategy Development | Leadership | Leadership (vision, strategy, culture) |
| Governance of data access and reuse | Governance | Governance | |||
| Budget | Executive | Funding | Cost and budgeting | ||
| Business planning and sustainability | |||||
| Services | Library | Support services | Data Management and Sharing Plans | Support and advice/Data management planning | |
| Managing change and RDM service design | Services/Research life cycle support | ||||
| Data cataloguing and publishing | |||||
| RDM skills training and consultancy | Training | Human capital | |||
| User needs | — | Evaluation | Users and stakeholders | ||
| Information | |||||
| IT infrastructure | IT center | Infrastructure | Access & Storage Management | Technological infrastructure | |
| Digital preservation and continuity |
We selected four existing maturity models for comparison: the ‘RDM Framework,’ ‘The Collaborative Assessment of Research Data Infrastructure and Objectives (CARDIO),’ the ‘Research Data Services Maturity Model,’ and the ‘Maturity Model for Evaluation of RDS.’ It is important to note that the ‘Data Management Framework’ developed by ANDS covers both RDM and metadata management, which are not included in Table 1 as we focused only on services and infrastructure divisions. The criteria for dimension selection were based on the list of relevant departments; in previous studies, libraries as well as IT centers and research promotion/research administration divisions have been shown to be important stakeholders (Cox and Pinfield, 2014; Pinfield et al., 2014), and the similar perception applies in the Japanese context (Academic eXchange for Information Environment and Strategy, 2019). Also, as the budget falls under the purview of the executive board branch, we arranged the dimensions according to these divisions of labor generally as prescribed. Consequently, we identified six common dimensions: awareness, data policy, budget, services, user needs, and IT infrastructure. Using these dimensions, we established evaluation criteria and corresponding levels. Table 2 exhibits the evaluation criteria, detailing the specific range of each dimension and describing the five-level rating system.
Table 2
Common RDM service maturity models in academic institutions.
| DIMENSIONS | EVALUATION CRITERIA | INITIAL | REPEATABLE | DEFINED | MANAGED | OPTIMIZED |
|---|---|---|---|---|---|---|
| Awareness | Cooperation status with other departments | None/ad hoc | Concepts shared | Collaborated between related departments | Departments related to RDM implementation are visualized institution-wide. | Cross-departmental committees are held regularly to share issues. |
| Data policy | Policy establishment level and implementation status | None/Partial (*Data preservation policy, etc.) | Data policy has been formulated. (Operational procedure not yet implemented/currently being implemented in some departments) | Data policy has been formulated and clearly stated operational procedures for each department | Achievement goals and implementation status for each department are visualized | Discussions are being held for improvements based on the implementation status of each department |
| Budget | Budget allocation disposition | None | Yes (for implementation) | Yes (for operation and time-limited/discretionary) | Yes (for regular operation; already distributed to each department) | Yes (for regular operation; allocated based on budget plan) |
| Services | Status of managing services | Ad hoc | Each department has started providing services that can be realized | Created and maintained a list of services by the institution | Stated the relationships between the services and effectively coordinated | The service lifecycle is managed based on feedback from users, cost, and risk assessments. |
| User needs | Status of understanding user needs | None/Limited | Only some services/specific fields only | Survey targeting institution-wide users | Conducting ongoing/regular surveys | Survey results/items are regularly reviewed based on surveys by other institutions |
| IT infrastructure | IT infrastructure construction status | Ad hoc | Covers only part of some departments | Providing institution-wide RDM infrastructure | Service connected between RDM infrastructures | Conducted regular reviews of RDM infrastructures |
We referred to the existing four maturity models to establish formal evaluation criteria across relevant divisions. Subsequently, we developed a five-level rating description based on these criteria. ‘Initial’ signifies a state where no formal evaluation criteria are defined, and actions are ad hoc, relying on the efforts of individual divisions. ‘Repeatable’ indicates that primary directions and procedures have been defined and can be managed at the division level. ‘Defined’ denotes a state where evaluation criteria for each dimension are documented and agreed upon by the organization. ‘Managed’ represents a stage where achievement targets for each dimension are actively monitored, allowing quantitative progress tracking by the organization’s executive board. ‘Optimized’ signifies a phase where evaluation procedures are optimized. The executive board can proactively consider improvement measures, anticipate challenges, and implement strategic adjustments based on departmental progress.
3.2 Evaluation
This section explains the evaluation procedure for our model. Based on previous studies, three types of maturity model evaluation are proposed: author evaluation, domain expert evaluation, and practical setting evaluation (Helgesson et al., 2011; Salah et al., 2014). Author evaluation involves assessing the model by its creators, either based on their expertise in representing the maturity model or by comparing it with similar frameworks. Domain expert evaluation is conducted by practitioners who are experts in the relevant business domain but were not involved in developing the model. Practical setting evaluation occurs when the maturity model is applied in real-world scenarios. These evaluation methods are independent but can also be used in combination. It is recommended to follow a stepwise order of author evaluation, expert evaluation, and practical setting evaluation. This sequential approach facilitates iterative updates and refinements of the model based on feedback from earlier evaluations. Therefore, this study adopts this step-by-step evaluation approach.
3.2.1 Author evaluation
The author evaluation was conducted to validate the initial design of the maturity model by its creators themselves. This evaluation aimed to ensure that the model accurately represents the maturity of organizational RDM services, the six common dimensions are relevant and comprehensive for assessing RDM maturity, and the five-level rating system is logically consistent and applicable across the identified dimensions.
First, we performed a comprehensive internal review to ensure the logical consistency and completeness of the model. This review was conducted by two authors who were primarily responsible for the model’s conceptualization and framework design. The review process involved the following three perspectives: comparing the model’s dimensions with those in existing RDM maturity models to ensure comprehensiveness, cross-checking the relevance of the evaluation criteria for each dimension, and validating the consistency and scalability of the five-level rating system.
Next, we validated the conceptual soundness of the model through brainstorming sessions among the two authors. Discussions focused on the applicability of the dimensions to various institutional contexts, the consistency of the rating descriptions, and their applicability to real-world RDM practices. We adjusted the model based on these discussions to enhance its logical consistency. This work was done as part of the development of the five-level rating system, and the results of the discussions are reflected in Table 2.
3.2.2 Expert evaluation
The expert evaluation aimed to obtain an independent assessment of the model’s validity, practicality, and relevance. It involved domain experts who were not involved in the model’s development to provide an unbiased evaluation of the model’s dimensions and rating system. Two domain experts were selected, representing the following organizational roles: RDM service manager from a large university and IT infrastructure specialists involved in RDM system implementation. Since the RDM service manager has experience in data policy development and the IT infrastructure specialist has experience as a librarian, we determined that two people could cover the six dimensions. Experts were trained in the evaluation procedures and criteria to ensure a consistent understanding of the model.
The evaluation focused on the relevance and clarity of the six dimensions, the applicability and practicality of the five-level rating system, and the consistency and comprehensiveness of the evaluation criteria for each dimension. The evaluation highlighted several practical considerations within the Services and IT infrastructure dimensions. Particularly important feedback indicated the need to present the implemented service areas as subsets of each dimension to understand the model in a manner that preserves consistency and relevance. To address these findings, we identified key performance areas for practical evaluation within each dimension. Table 3 outlines the list of key performance areas identified for each dimension.
Table 3
List of key performance areas in the Services and IT infrastructure dimensions.
| DIMENSIONS | KEY PERFORMANCE AREAS |
|---|---|
| Services | Creating data management plan |
| Training in data literacy | |
| Managing Intellectual Property Rights | |
| Storing data | |
| Publishing data | |
| Curating data | |
| Obtaining and citing data | |
| IT infrastructure | Data storage |
| Data repository | |
| Data analysis platform | |
| Research information system |
We identified seven key performance areas for the Services dimension and four key performance areas for the IT infrastructure dimension. These areas were selected based on examples found in existing maturity models discussed in the previous section.
3.2.3 Practical setting evaluation
This section applies our maturity model to universities and research institutions to evaluate its procedures and suitability. First, we outlined the procedures for applying the model and converted it into a questionnaire for self-assessment by relevant departments. Subsequently, we conducted a comprehensive questionnaire survey to assess how well the model applies across institutions of varying sizes and types.
Model transformation
This section discusses the practical steps involved in applying our model to universities and research institutions. To effectively apply the model, the evaluator must accurately understand the initiatives of the relevant departments. However, because the model covers initiatives across the entire institution, it can be challenging for a single evaluator to address all dimensions comprehensively. To address this challenge, we developed a questionnaire based on the model to enable self-assessment by the relevant departments. Table 4 provides an example of the questions we developed. It is important to note that the actual questions and answer choices are prepared in Japanese.
Table 4
Example of the question-and-answer options.
| QUESTION | ANSWER OPTIONS |
|---|---|
| Has any budget been set aside for IT system costs, personnel costs, etc., related to RDM? | 1) No |
| 2) Accounted within the operational costs of the responsible department | |
| 3) Accounted by the institution’s overall operating costs | |
| 4) Accounted by external funds | |
| 5) I do not know |
The questions are broadly divided into two categories: those that inquire about the maturity levels defined in the model and those that ask for the basis of the responses. The latter questions are included where the criteria may vary between respondents, providing support for the evaluator’s final decision. By asking the relevant departments about the status of their efforts in line with these questions, the evaluator can quantitatively assess the current state of constructing organizational RDM services based on the model.
Questionnaire survey
We conducted a ‘Survey of RDM Initiatives in Japanese Institutions’ to test the validity of the questionnaire. The online survey targeted universities and research institutions across Japan. Table 5 provides an overview of the survey.
Table 5
Overview of the questionnaire survey.
| SURVEY TITLE | SURVEY OF RDM INITIATIVES IN JAPANESE INSTITUTIONS, 2020 | SURVEY OF RDM INITIATIVES IN JAPANESE INSTITUTIONS, 2022 |
|---|---|---|
| Summary | Recently, Japanese universities and research institutions are required to formulate data policies and establish a RDM system to appropriately store research data and share them to third parties as necessary. In light of this situation, the Japan Consortium for Open Access Repository (JPCOAR) and the Academic eXchange for Information Environment and Strategy (AXIES) conducted an online questionnaire survey to ascertain the status of RDM initiatives at universities and research institutions in Japan in 2020. | Recently, Japanese universities and research institutions are required to formulate data policies and establish a RDM system to appropriately store research data and share them to third parties as necessary. In light of this situation, the Japan Consortium for Open Access Repository (JPCOAR) and the Academic eXchange for Information Environment and Strategy (AXIES) conducted an online questionnaire survey to ascertain the status of RDM initiatives at universities and research institutions in Japan in 2022. |
| Universe | Japanese universities and research institutions | Japanese universities and research institutions |
| Sample Size | 352 valid responses | 309 valid responses |
| Date of Collection | November 27, 2020, to December 28, 2020 | November 28, 2022, to December 28, 2022 |
| Sampling Procedure | Non-probability (53.4% limited within the JPCOAR) | Non-probability (42.7% limited within the JPCOAR) |
| Major Survey Items | Basic information/Understanding user needs/Status of developing data policies/procedures/Status of research data management services/Status of IT infrastructure | Basic information/Understanding user needs/Status of developing data policies/procedures/Status of research data management services/Status of IT infrastructure |
| URL | https://doi.org/10.34500/SSJDA.1587 | https://doi.org/10.34500/SSJDA.1588 |
The questionnaire was designed to reflect the model and was then sent out to universities and research institutions. The questions related to the maturity levels required mandatory responses, while those asking for the basis of the answers were optional. The survey was previously conducted twice before, in 2020 and 2022, under the auspices of the Japan Consortium for Open Access Repository (JPCOAR) and AXIES. Sampling was non-probabilistic; limited to within the JPCOAR, the response rate was 53.4% in 2020 and 42.7% in 2022. The original questions and answers for the 2020 and 2022 surveys are available from the SSJ Data Archive (Japan Consortium for Open Access Repository, 2020; Japan Consortium for Open Access Repository, 2022). The questionnaire translated into English is available in Appendix 1.
Formality
To assess whether the framework is commonly applicable to institutions of different sizes and types, we first analyzed the relevant information of the respondent institutions. In 2020, 352 valid responses were received: 325 (92.3%) were from universities, 16 (4.6%) were from research institutes and others, and 11 (3.1%) were from others. Of the universities surveyed, 67 (19.0%) were national universities, 42 (11.9%) were public universities, and 216 (61.4%) were private universities. Additionally, 45 (13.8%) were large universities with eight or more faculties. Eight (2.3%) research institutions were research and development corporations and inter-university institutions. Others included technical colleges and independent administrative institutions. In 2022, 309 valid responses were received: 283 (91.6%) were from universities, 12 (3.9%) were from research institutes, and 14 (4.5%) were from others. Of the universities surveyed, 71 (23.0%) were national universities, 35 (11.3%) were public universities, and 177 (57.3%) were private universities. Moreover, 46 (14.9%) were large universities with eight or more faculties, 7 (2.3%) were research and development corporations, and 5 (1.6%) were inter-university institutions. Others included technical colleges and independent administrative institutions. Figures 2 and 3 show a comparison between 2020 and 2022.
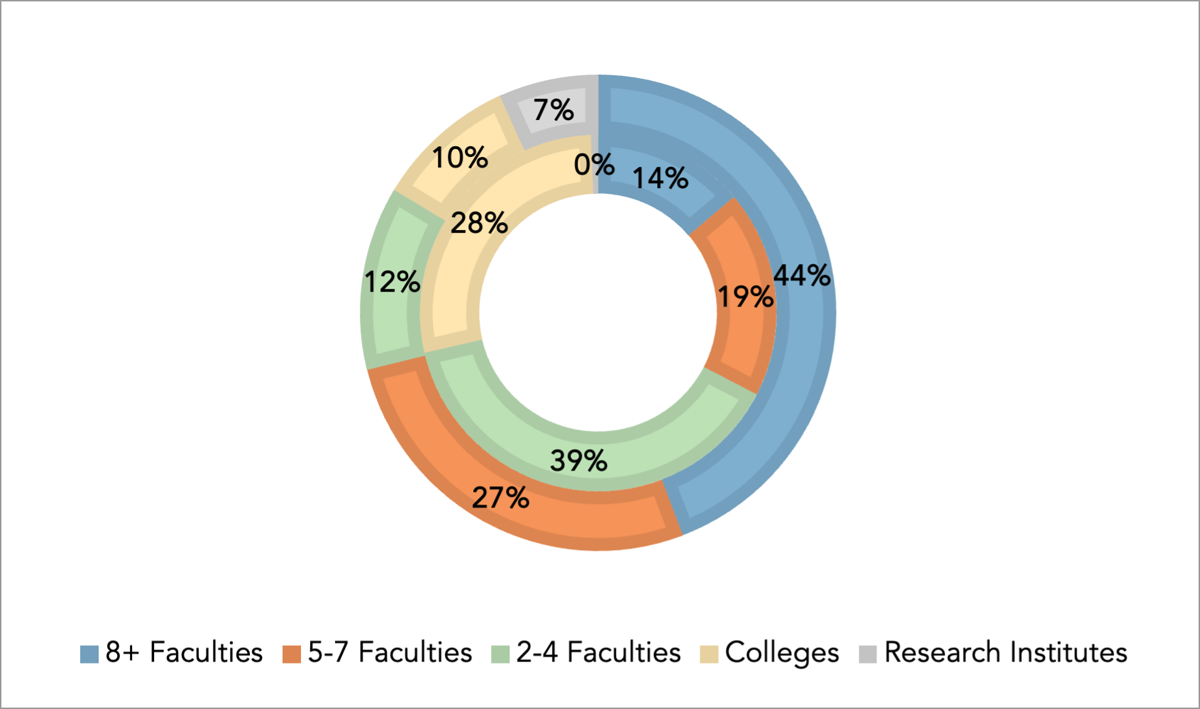
Figure 2
Institution sizes distribution (2020 vs 2022).
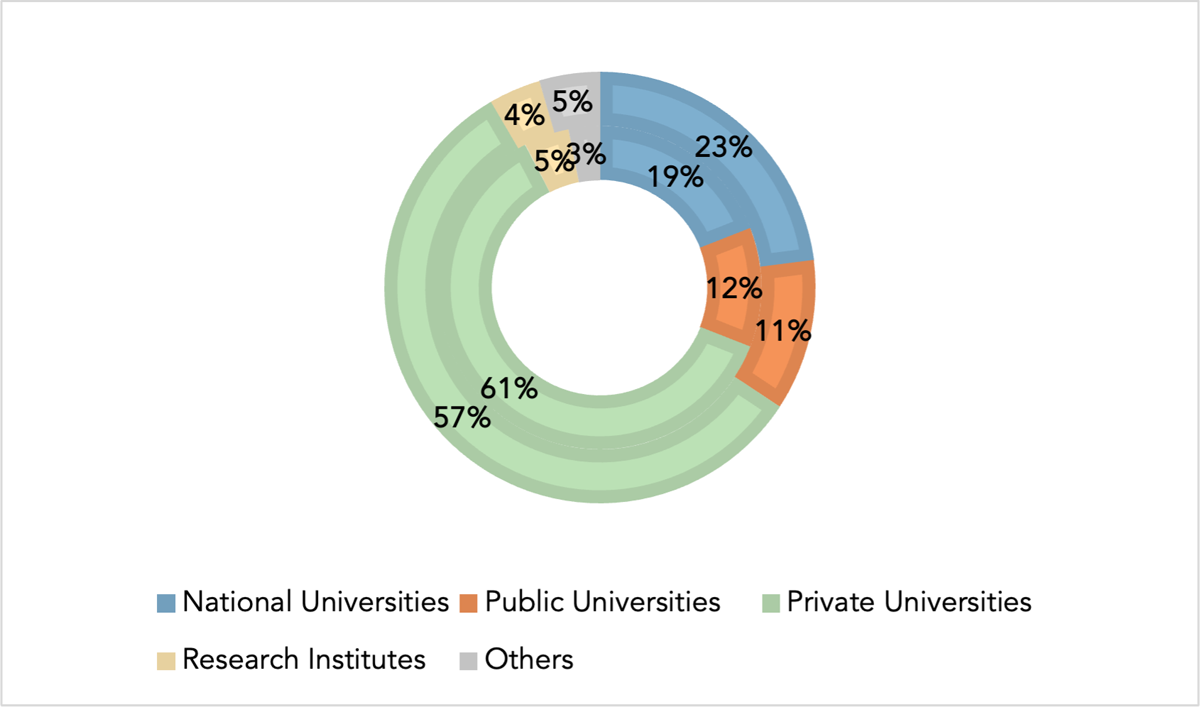
Figure 3
Institution types distribution (2020 vs 2022).
Both surveys indicate a slightly higher proportion of small- to medium-sized institutions, but no extreme bias exists. Therefore, we consider the survey data applicable to institutions of various sizes and types.
Validity
Secondly, we analyzed the survey data validity to assess whether the formalized questions and options were appropriate for the participating institutions. As a measure of the survey data validity, we tabulated the selection ratios corresponding to ‘I don’t know’ options. Table 6 shows the response rates of the corresponding variables, calculating each maturity level.
Table 6
Response rates of the ‘I don’t know’ options selected among the corresponding variables calculating each maturity level.
| DIMENSIONS | CORRESPONDING VARIABLE NAMES | 2020 RESPONSE RATES (QUESTION NO.) | 2022 RESPONSE RATES (QUESTION NO.) |
|---|---|---|---|
| Awareness | RDM initiative | 18.5% (Q10) | 11.0% (Q11) |
| Stakeholders | 26.1% (Q13) | 16.2% (Q16) | |
| Data policy | RDM policy existence | 16.5% (Q11) | 11.0% (Q12) |
| RDM procedure existence | 10.8% (Q12) | 4.5% (Q13) | |
| Budget | RDM budget | N/A | 14.9% (Q15) |
| User Needs | Survey existence | 15.3% (Q5) | 11.3% (Q6) |
| Survey scale | 0.9% (Q6) | 0.0% (Q7) | |
| Future survey plan | 1.4% (Q9) | 15.0% (Q10) | |
| Services | RDM services department | 26.1% (Q16) | 3.1% (Q19) |
| IT infrastructure | IT infrastructure status | 17.8% (Q27) | 11.7% (Q28) |
There are two main possibilities for the ‘I don’t know’ option being chosen: 1) there is no contact point between the department in charge of the survey and the department that can answer the question, or it is difficult to answer the question due to lack of cooperation, or 2) the question itself is not clear enough. The former issue is synonymous with the Awareness level being ‘Initial’; the solution is to develop a strategy to move to the next level through actions such as assessing the current state of cooperation with other departments, aligning perceptions towards building services, and agreeing on the practical division of roles. A comparison of data for FY2020 and FY2022 shows that the ‘I don’t know’ rate for all options except for ‘future survey plan’ is decreasing, suggesting that the situation where there is no department to handle the issue is being resolved as organizational efforts are progressing. Regarding the latter issue, several of the questions received during the survey included questions such as not knowing the definitions of ‘research data’ and ‘data policy,’ suggesting that terminology issues may impact data quality. This issue could be solved by creating a glossary of terms and clarifying definitions that can be shared among RDM stakeholders.
3.2.4 Section summary
In this section, we evaluated our maturity model developed in Section 3. We adopted the existing three-step evaluation procedure, consisting of an author evaluation, a domain expert evaluation, and a practical setting evaluation. The evaluation results confirmed the validity of the model at each step. Moreover, during the evaluation process, we identified challenges and solutions for practical application of the model by evaluators at each institution.
4. Results
This section describes what can be accomplished with the framework developed. We represent an organizational RDM service maturity in 4.1, and we represent the expression of maturity on a national scale in 4.2.
4.1 Representation of an organizational RDM service maturity
This section introduces how to represent the practice of universities and research institutions using the model. Figure 4 visualizes the results of the evaluation example based on the 2022 survey data. In preparing Figure 4, maturity level determinations were made on survey data registered in the SSJ data archive for six dimensions, and the average values were calculated. The questions and formulas used to calculate an organizational RDM service maturity in six dimensions can be found in appendix 2.
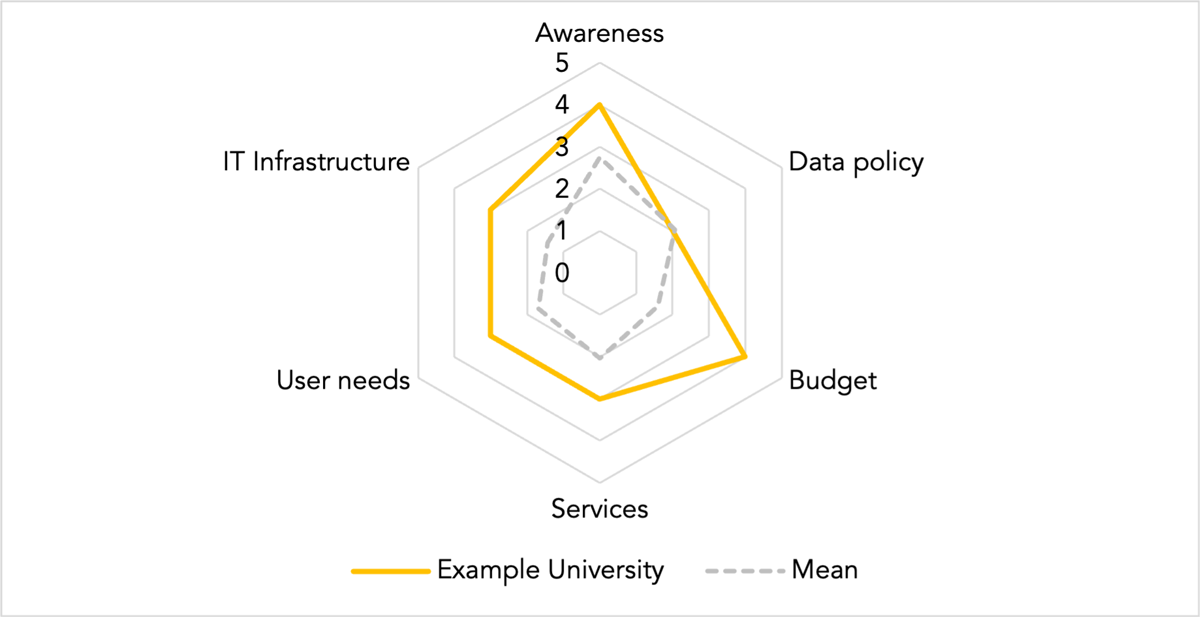
Figure 4
Example radar chart visualizing an organizational RDM service maturity in six dimensions.
Figure 4 plots the initiatives of Example University against the national average on six dimensions. All initiatives at Example University are above the national average, particularly the ‘Budget’ dimension, which is significantly higher. Meanwhile, the ‘Data policy’ dimension aligns with the national average and is at the ‘Repeatable’ stage of maturity. RDM officers should focus on these factors when considering future efforts. It is important to note that the Example University is based on the case of one large university that is leading the way in building RDM services.
Of the dimensions defined in the maturity model, ‘Awareness’ and ‘User needs’ are assumed to be answered by the RDM Manager and require multiple departments’ comprehensive assessment of efforts. Accordingly, the calculations incorporated multiple questions in a cross-sectional analysis.
4.2 Representation of the RDM service maturity on a national scale
An essential feature of the framework is that it can be commonly applied to institutions of various sizes and types. This feature makes it possible to compare achievement by size and by type. Figures 5, 6, 7, 8, 9, 10, 11, 12, 13, 14, 15, 16 exhibit achievement by size and type in the six dimensions using data from the 2022 survey.
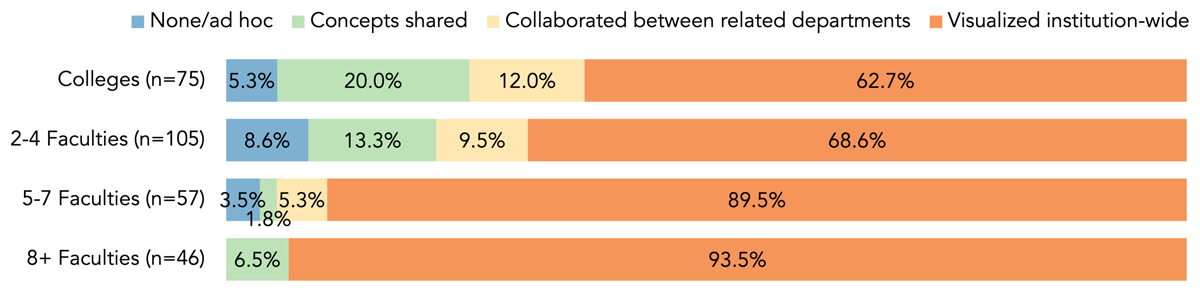
Figure 5
Development status of Awareness by institution sizes.
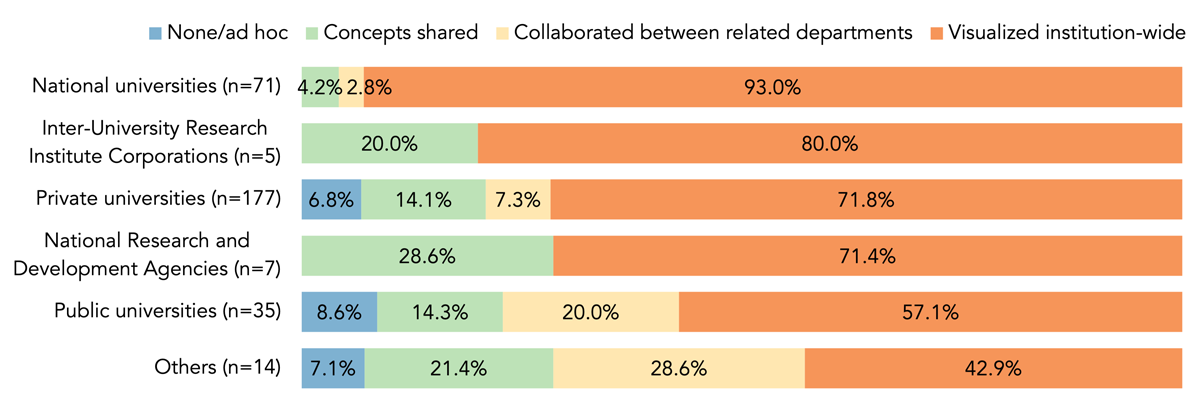
Figure 6
Development status of Awareness by institution types.
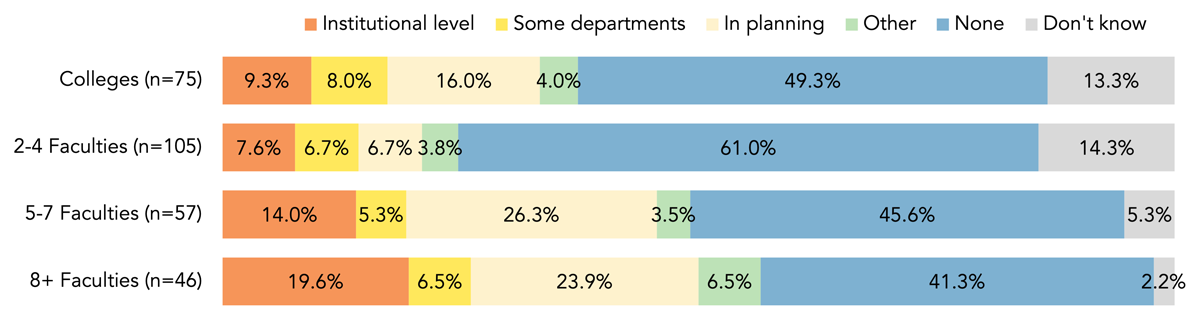
Figure 7
Development status of Data Policy by institution sizes.
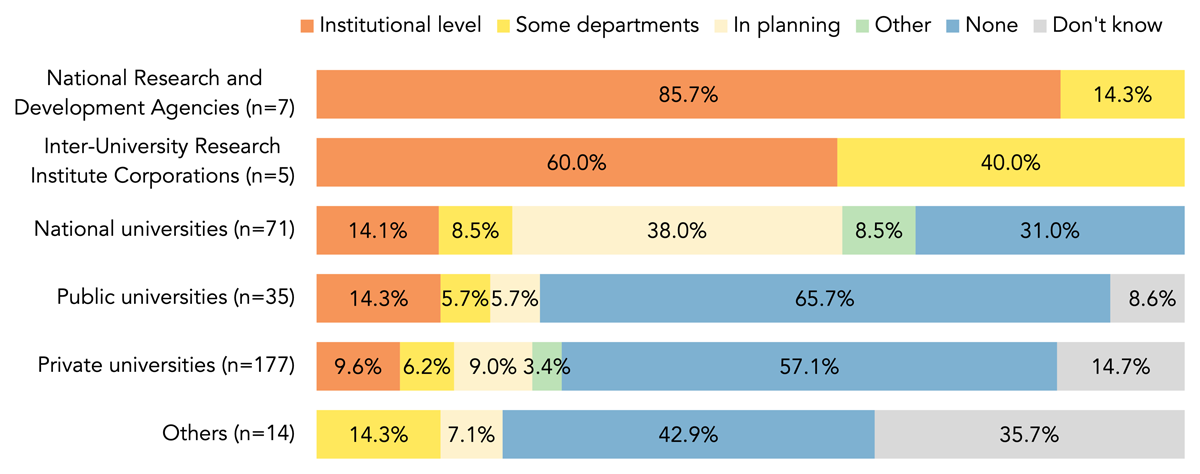
Figure 8
Development status of Data Policy by institution types.
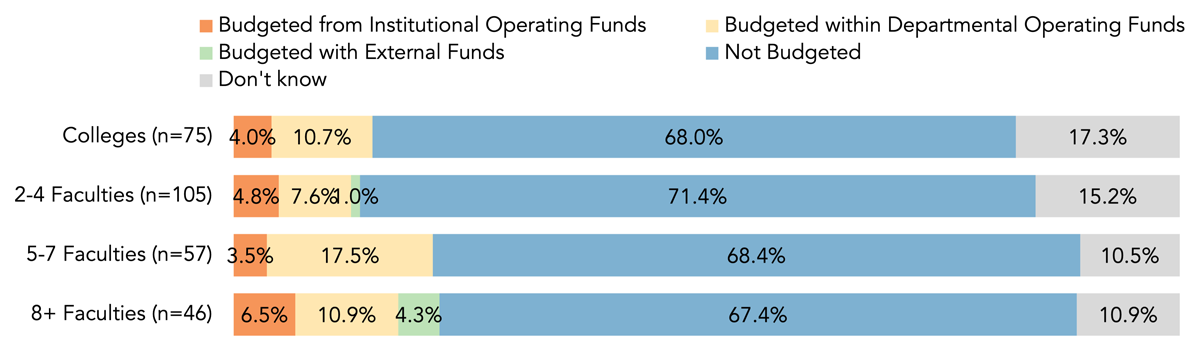
Figure 9
Development status of Budget by institution sizes.
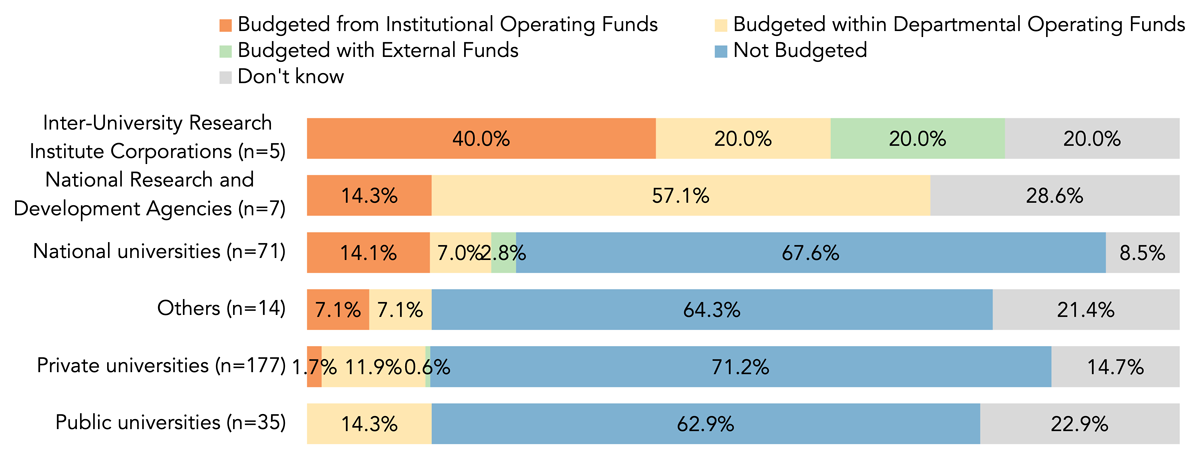
Figure 10
Development status of Budget by institution types.
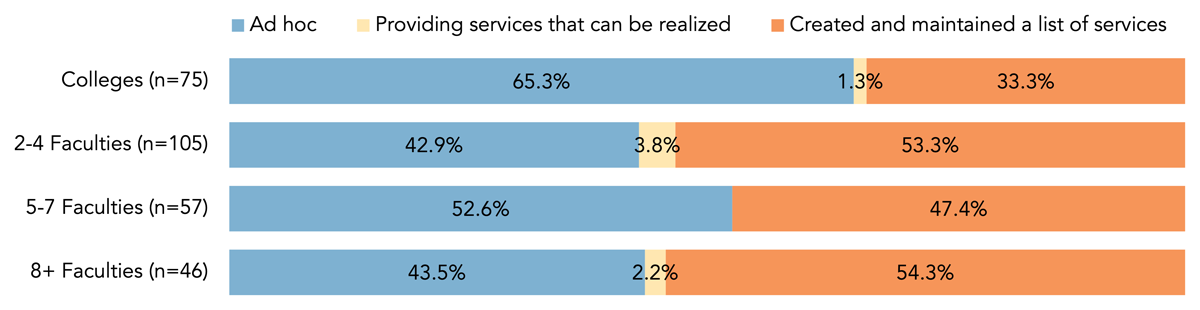
Figure 11
Development status of Services by institution sizes.
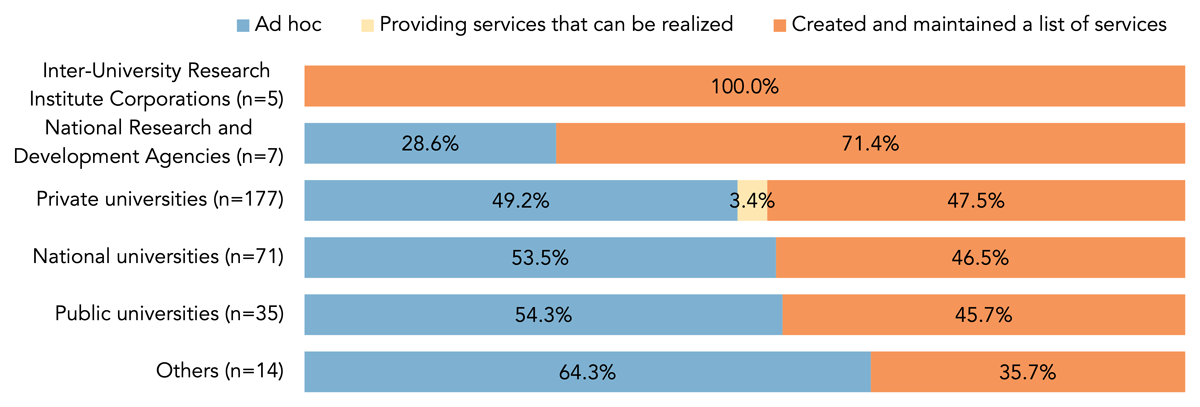
Figure 12
Development status of Services by institution types.
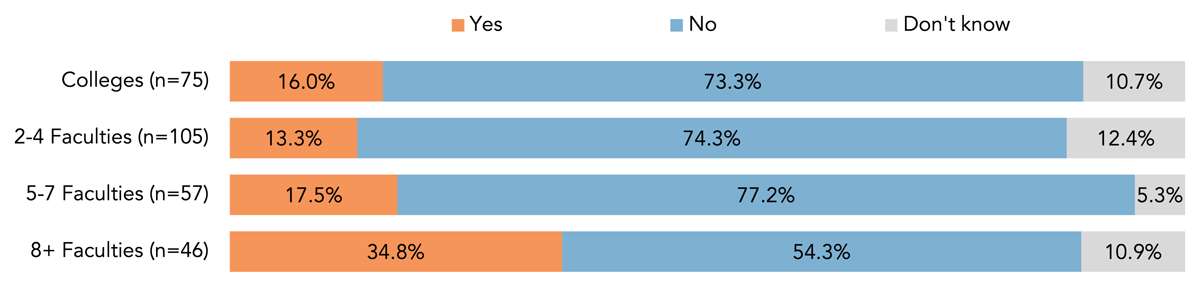
Figure 13
Development status of User Needs by institution sizes.
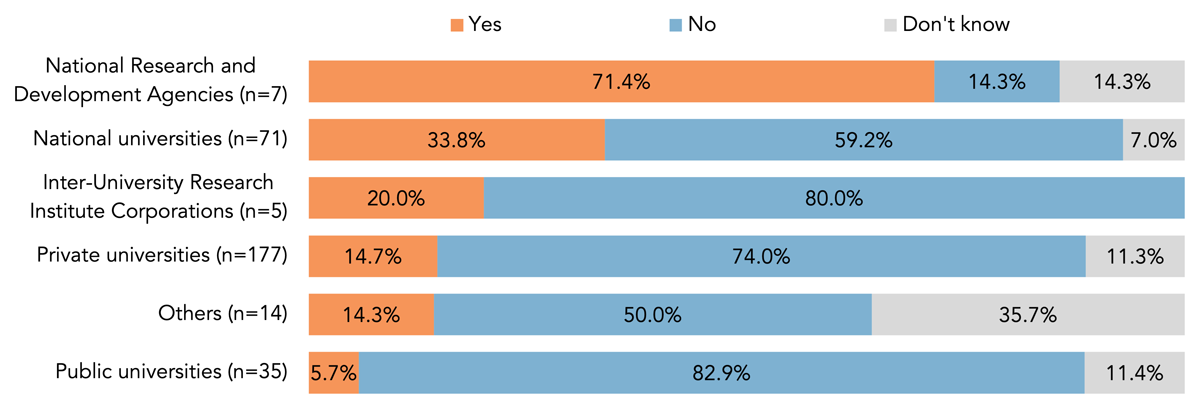
Figure 14
Development status of User Needs by institution types.
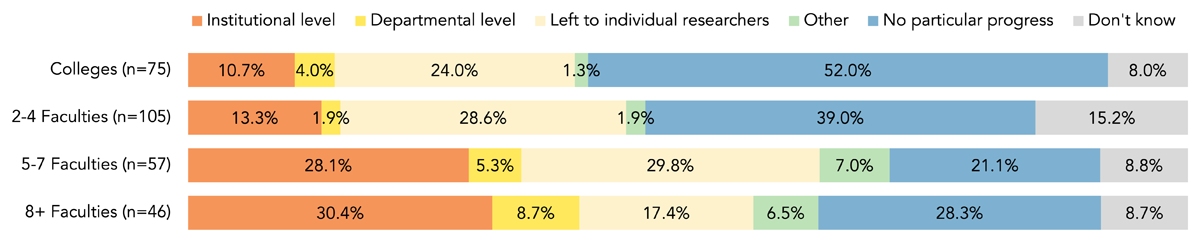
Figure 15
Development status of IT infrastructure by institution sizes.
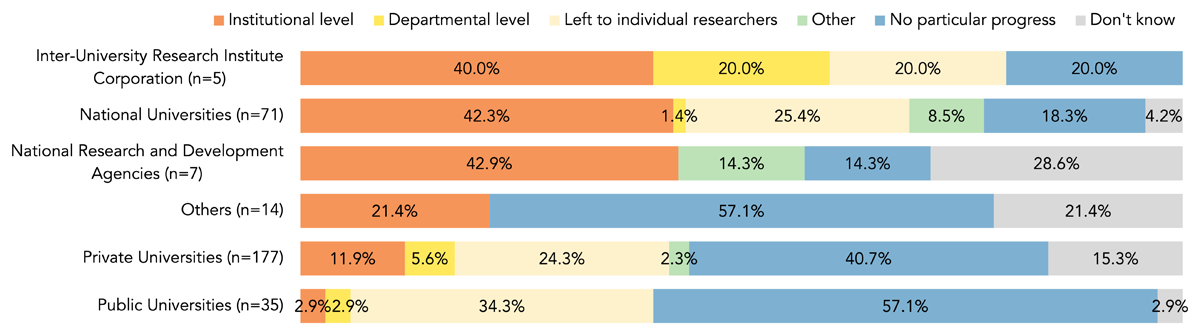
Figure 16
Development status of IT infrastructure by institution types.
In the following, the IT infrastructure diagram is used as an example to illustrate how to read it. In Figure 15, more than 40% of Inter-University Research Institute Corporation, National Universities, and National Research and Development Agencies are being developed at the institutional level. In comparison, private and public universities are lower at 11.9% and 2.9%, respectively. The reason why the IT infrastructure dimension has a higher value is as follows: in the Japanese context, National Research and Development Agencies are required to have a data policy in place by the end of FY2020 (Cabinet Office, 2018) and national universities by the end of FY2025 (Cabinet Office, 2021). The data policy must clearly state the initiatives related to the storage and management of research data in this requirement.
In Figure 16, 30.4% of large universities with eight or more faculties are in the development stage at the institutional level, compared with 28.1% for universities with five to seven faculties, 13.3% for those with two to four faculties, and 10.7% for colleges. In general, the larger the university, the more budgetary and staffing resources it has; therefore, the more likely it is to act in establishing an organizational RDM system.
5. Discussion
This section discusses the potential value and utilization of the framework. From a policymaker’s perspective, aggregating data from multiple institutions based on the model enables monitoring of progress across dimensions. Figures 17, 18, 19, 20, 21 exhibit a secular change using data from the 2020 and 2022 surveys. We note that the dimension of Budget was not included here because it was not covered in the 2020 survey.
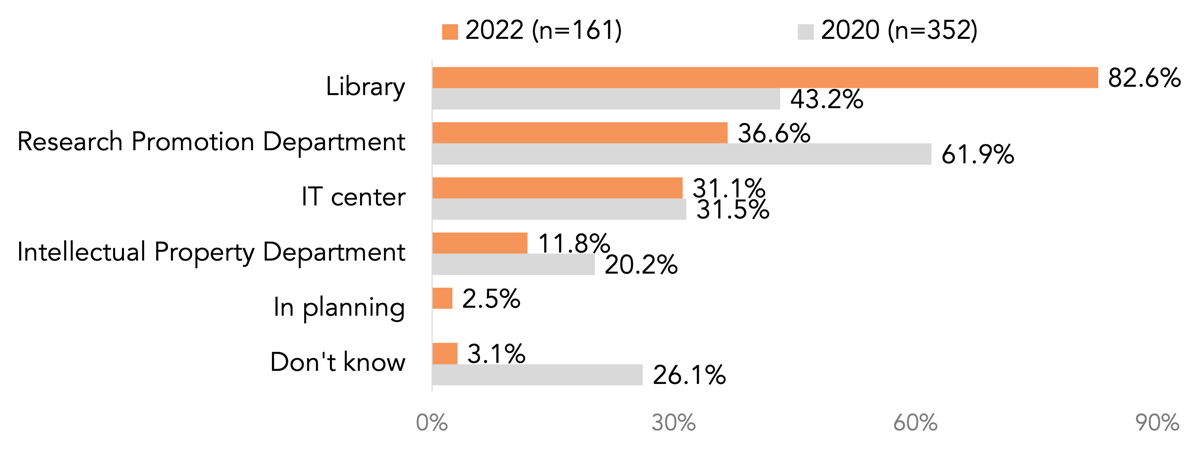
Figure 17
Secular change in Awareness in 2020 and 2022.
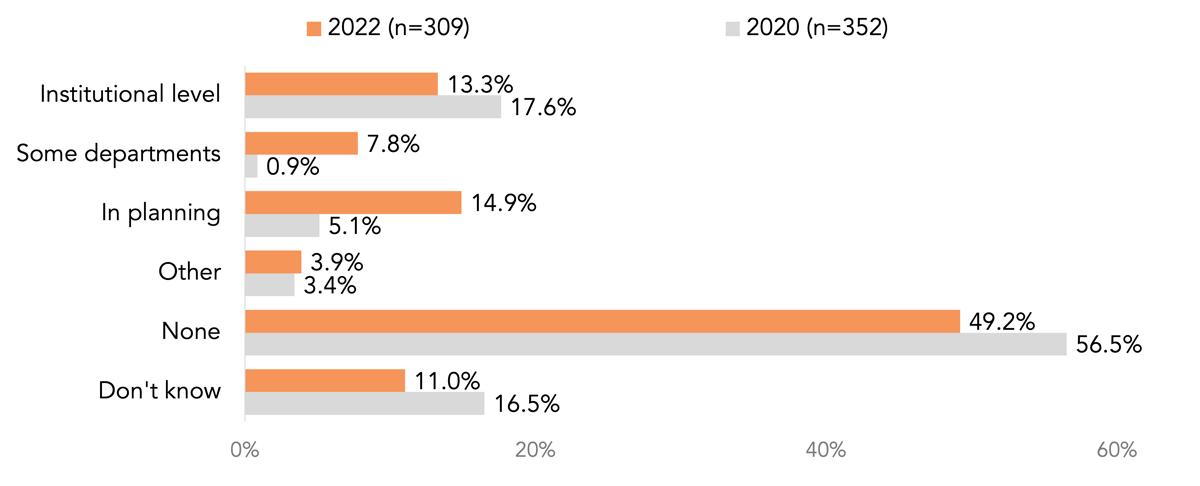
Figure 18
Secular change in Data Policy in 2020 and 2022.
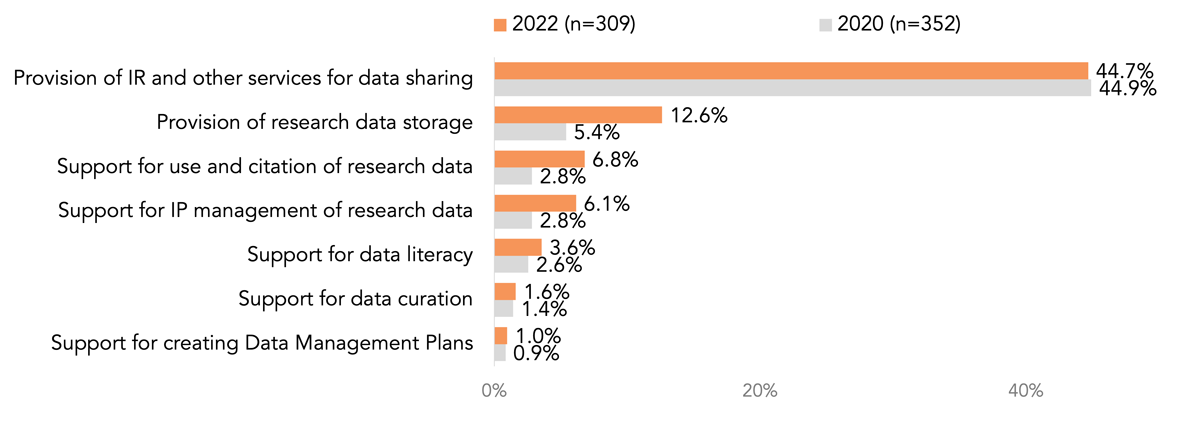
Figure 19
Secular change in Services in 2020 and 2022.
Figure 20
Secular change in User Needs in 2020 and 2022.
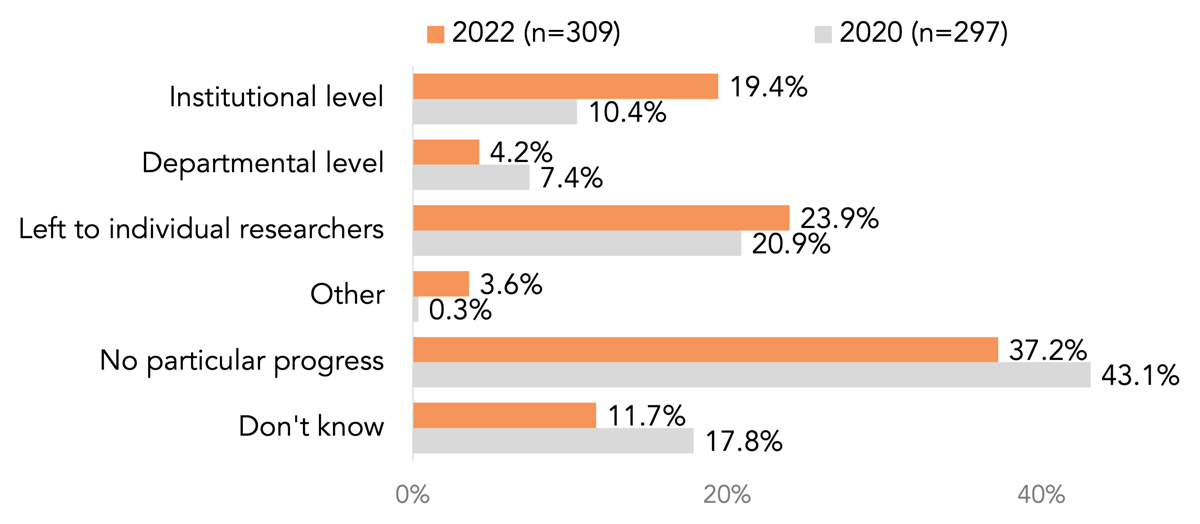
Figure 21
Secular change in IT infrastructure in 2020 and 2022.
Take Services, for example; there has been little increase in the proportion of ‘provision of IR (Institutional Repository) and other services for data sharing,’ which remains the most common service. However, ‘provision of research data storage,’ ‘support for use and citation of research data,’ and ‘support for IP management of research data’ have more than doubled. This trend suggests that institutions are increasingly focusing on developing these services individually. Such insights enable policymakers to monitor policy progress and strategically allocate investments.
6. Conclusion
This study designed a common framework for comprehensively and consistently measuring the maturity of organizational RDM services. We have conducted the study in three steps: framework design, evaluation, and implementation. First, we compared these representative RDM service maturity models and extracted common dimensions: awareness, data policy, budget, services, user needs, and IT infrastructure. Based on this result, we set the evaluation criteria and the description of the five-level rating. The executive board can proactively consider improvement measures, anticipate challenges, and implement strategic adjustments based on departmental progress. Subsequently, we evaluated the framework through a step-by-step approach. We adopted the existing three-step evaluation procedure, which involved an author evaluation, a domain expert evaluation, and a practical setting evaluation. The author evaluation was conducted to validate the initial design of the maturity model by its creators themselves. We adjusted the model based on these discussions to enhance its logical consistency. The expert evaluation aimed to obtain an independent assessment of the model’s validity, practicality, and relevance. The evaluation highlighted several practical considerations within the Services and IT infrastructure dimensions. Particularly important feedback indicated the need to present the implemented service areas as subsets of each dimension to understand the model in a manner that preserves consistency and relevance. To address these findings, we identified key performance areas for practical evaluation within each dimension. The practical setting evaluation applied our maturity model to universities and research institutions to evaluate its procedures and suitability. We outlined the procedures for applying the model and converted it into a questionnaire for self-assessment by relevant departments. Subsequently, we conducted a comprehensive questionnaire survey to assess how well the model applies across institutions of varying sizes and types. The evaluation results confirmed the model’s formality and validity. During the evaluation process, we identified challenges and solutions for applying the model at a practical level by the evaluators of each institution. Moreover, we also represented the practice of universities and research institutions at both the organizational and national levels. For the organizational levels, we represented the practice as a radar chart. This radar chart enabled RDM managers to compare their practices with national averages from six dimensions. For national levels, we exhibit their development status by size and type in the six dimensions. This representation makes it possible to compare achievement by size and by type. Furthermore, we discussed the potential value and utilization of the framework. To clarify the framework’s applicability to a wide variety of institutions, we showed a secular change visualization for organizational RDM services based on the survey data.
This study provides an organizational benchmark of RDM services applicable to institutions of diverse sizes and types. For RDM managers, they will be able to quantitatively assess their institution’s achievement level based on its efforts in the previous year and national averages. An advanced use could be to detail the dimensions that their institution wants to focus on and evaluate to gain deeper insight into the efforts of the relevant departments. For instance, RDM managers can set detailed categories (e.g., evidence data for articles and digital data for classical books) in the Services dimension and monitor progress by category. For policymakers, they can measure the effectiveness of implemented policies by monitoring secular changes in each dimension. Furthermore, a closer examination of the focused dimensions may offer valuable insights for discussing policy-related issues. Thus, it also helps in identifying issues in the future implementation of organizational RDM services and the priority areas for investment. As we have seen in the previous section, the model was developed consistent with international maturity models; hence, international comparisons would be possible if corresponding data were available. We will continue to work on activities to support the elaboration and utilization of this model.
Data Accessibility Statement
The data that support the findings of this study, ‘Survey of Research Data Management Initiatives in Japanese Institutions 2020 and 2022, Japan Consortium for Open Access Repository (JPCOAR),’ was provided by the Social Science Japan Data Archive, Center for Social Research and Data Archives, Institute of Social Science, The University of Tokyo.
Additional Files
The additional files for this article can be found as follows:
Appendix 1
‘Survey on the Status of Research Data Management Initiatives at Domestic Institutions (2022)’ Questionnaire. DOI: https://doi.org/10.5334/dsj-2025-018.s1
Appendix 2
The questions and formulas used to calculate an organizational RDM service maturity in six dimensions. DOI: https://doi.org/10.5334/dsj-2025-018.s2
Acknowledgements
We would like to thank Shigeki Matsubara (Nagoya University) for giving us helpful advice on how to apply the model. We also thank Michiyo Yasuhara (Kyoto University) and Masashi Iwai (Shinshu University) for their cooperation in the model transformation.
Competing Interests
The authors have no competing interests to declare.
Author Contributions
Yasuyuki Minamiyama: Conceptualization – Methodology – Investigation – Formal analysis – Writing – original draft.
Ui Ikeuchi: Data curation – Formal analysis – Visualization – Writing – review and editing.
Kosuke Tanabe: Investigation – Validation.
Kenji Yuki: Investigation – Validation.
Kazuhiro Hayashi: Supervision – Validation.
Takaaki Aoki: Conceptualization – Funding acquisition – Project administration – Supervision.