
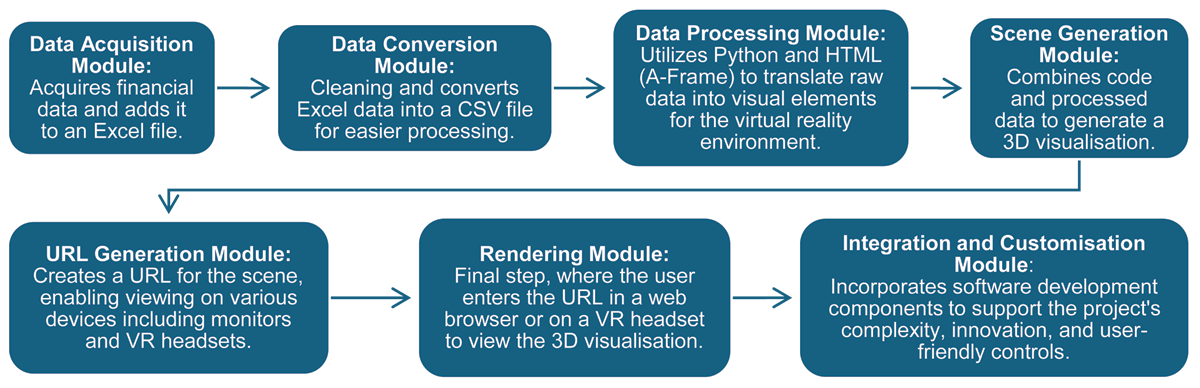
Figure 1
Chart showing the process of functional design for 3D stock heatmap.
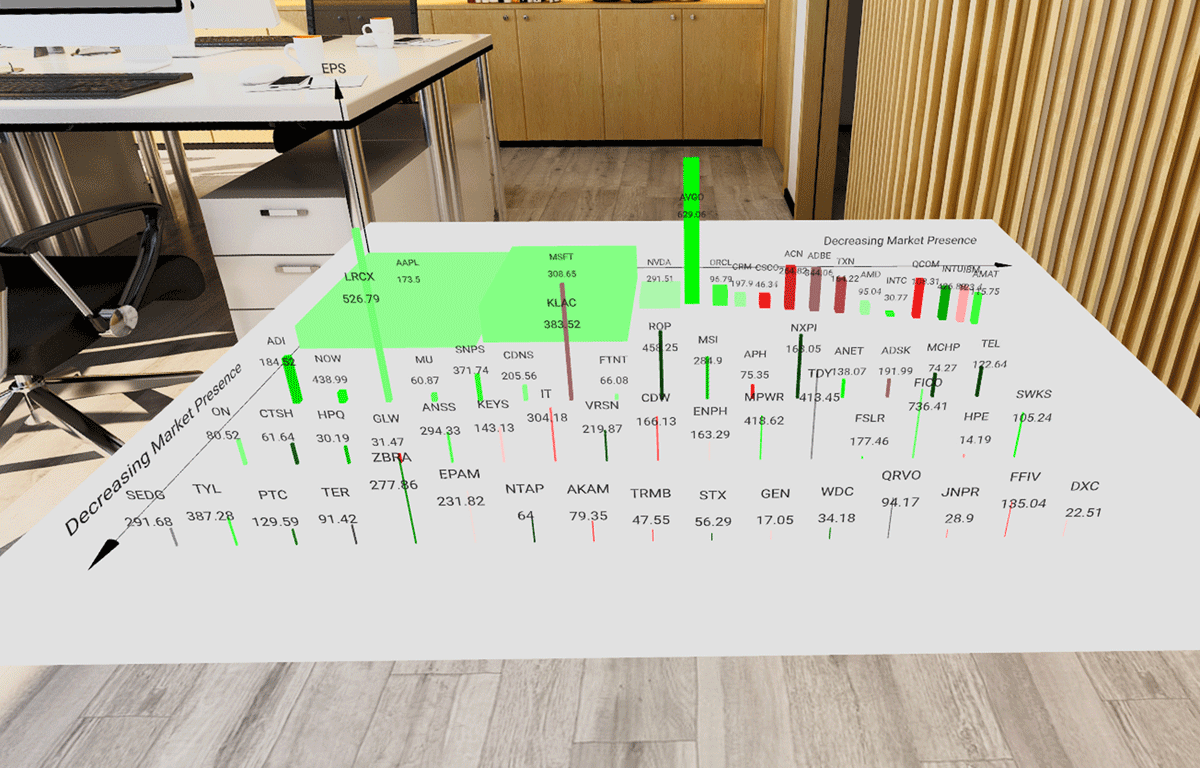
Figure 2
3D stock heatmap.
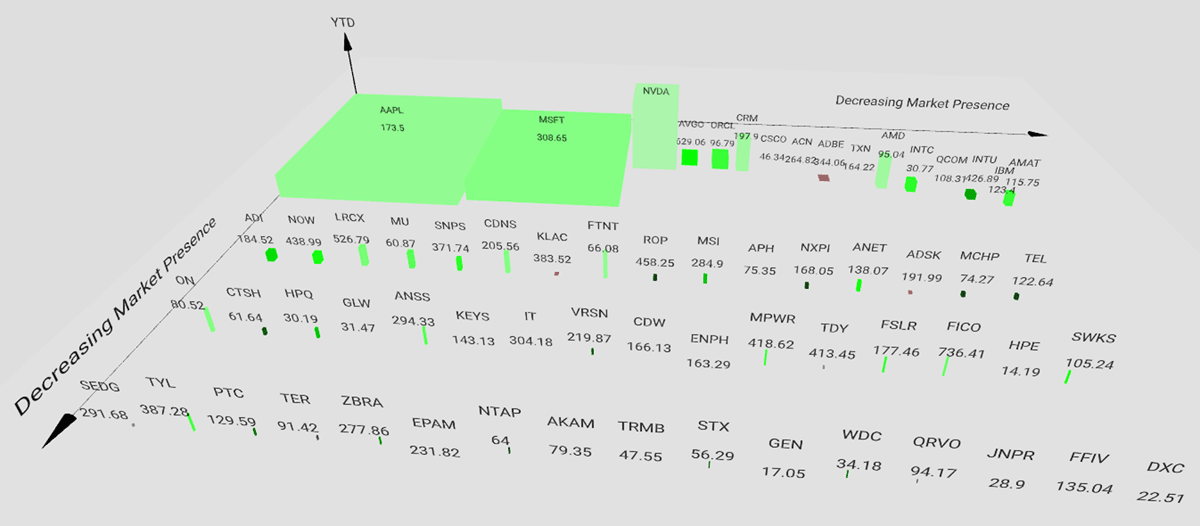
Figure 3
Close-up screenshot of the 3D stock heatmap using YTD as height.
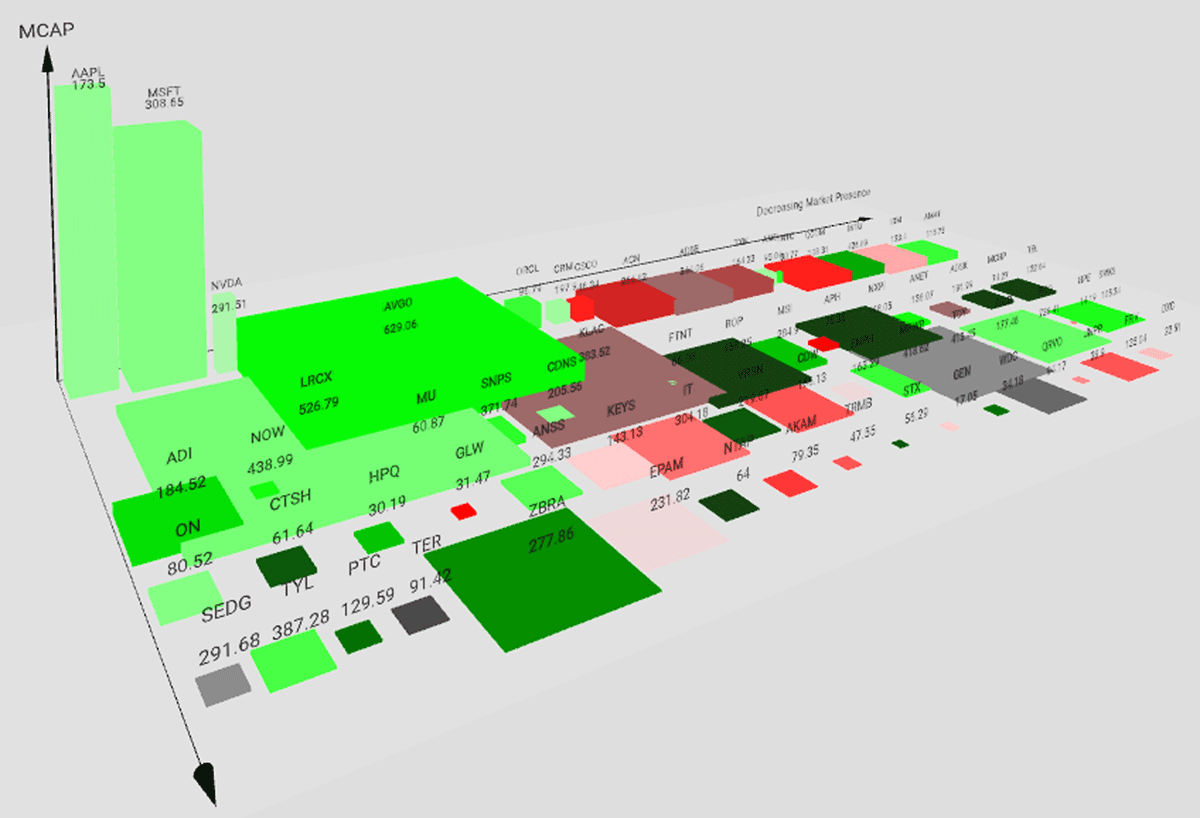
Figure 4
Close-up screenshot of the 3D stock heatmap using MCAP as height.
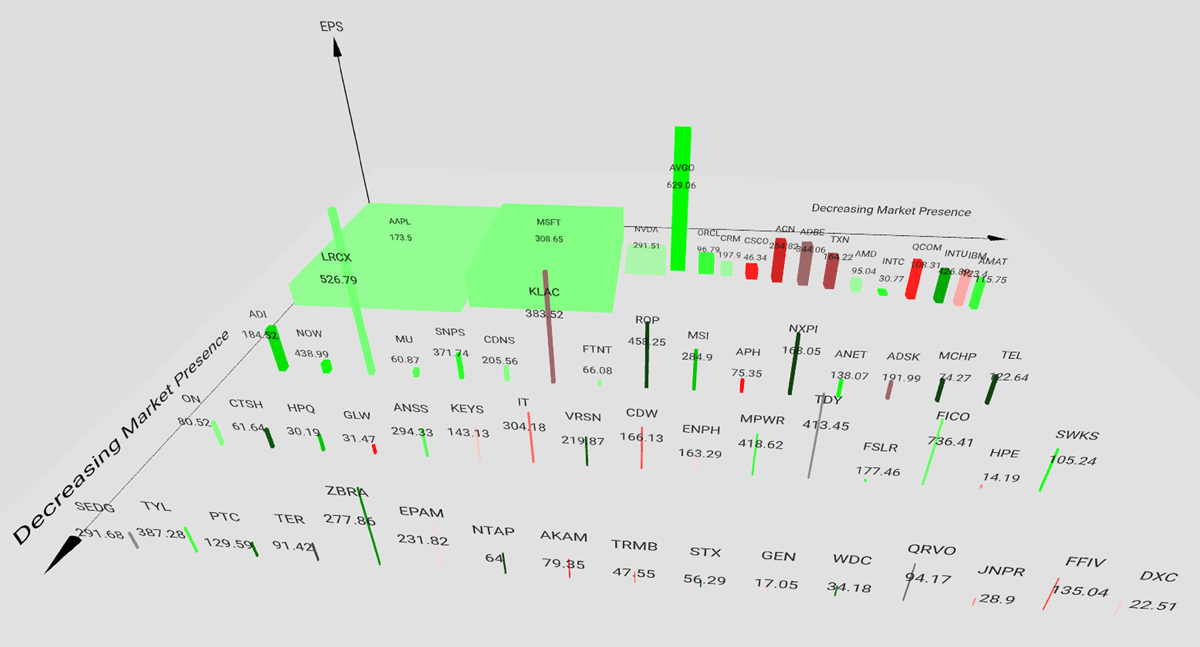
Figure 5
Close-up screenshot of the 3D stock heatmap using EPS as height.

Figure 6
2D Stock market heatmap (source: finviz.com).
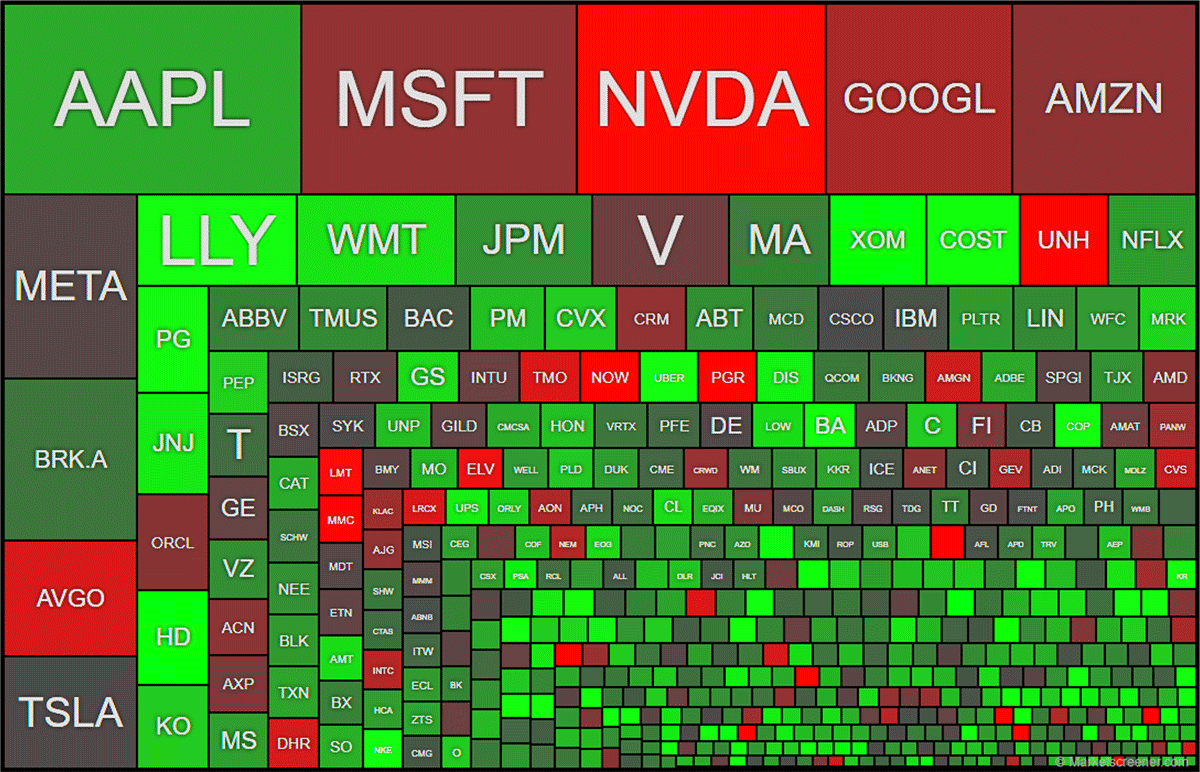
Figure 7
S&P 500 index stock heatmap (source: MarketScreener.com).