
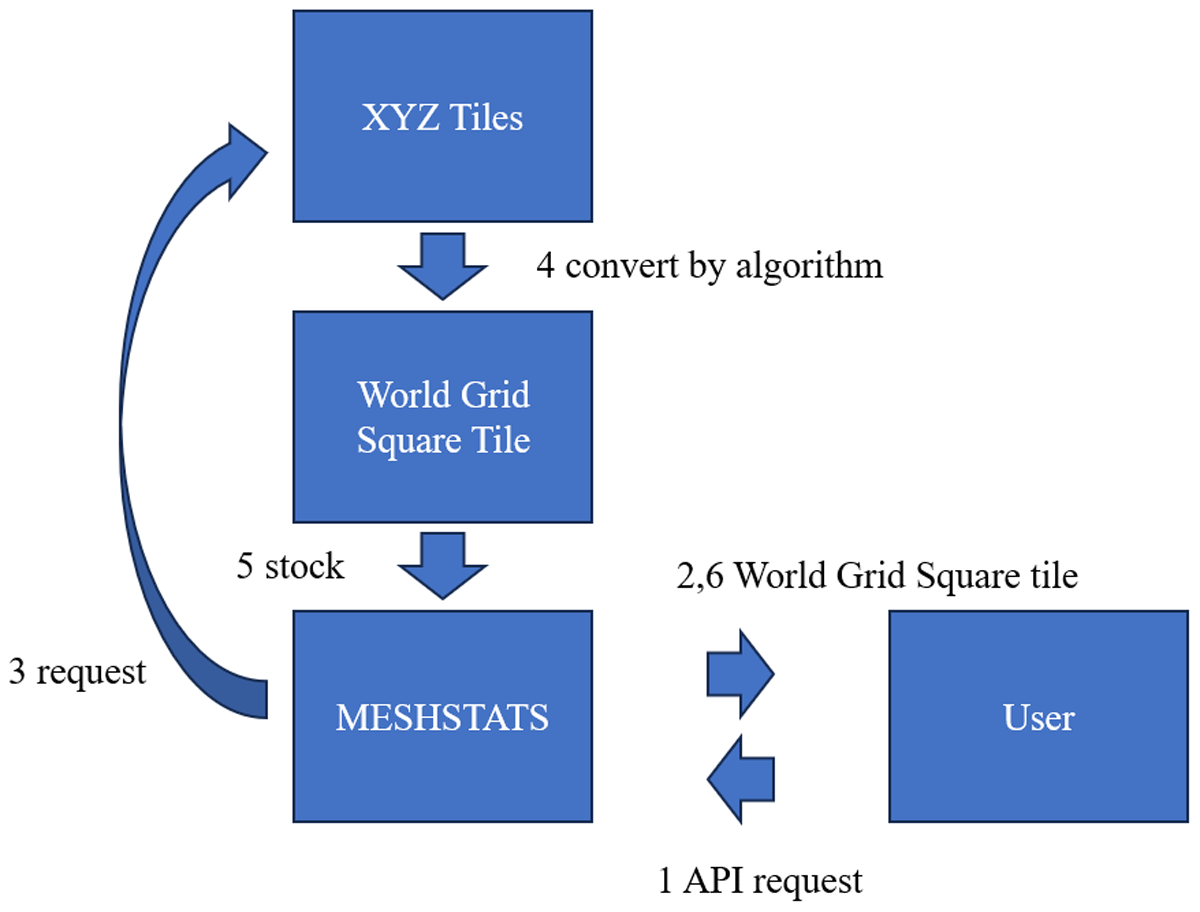
Figure 1
Schematic illustration of the proposed Web API.
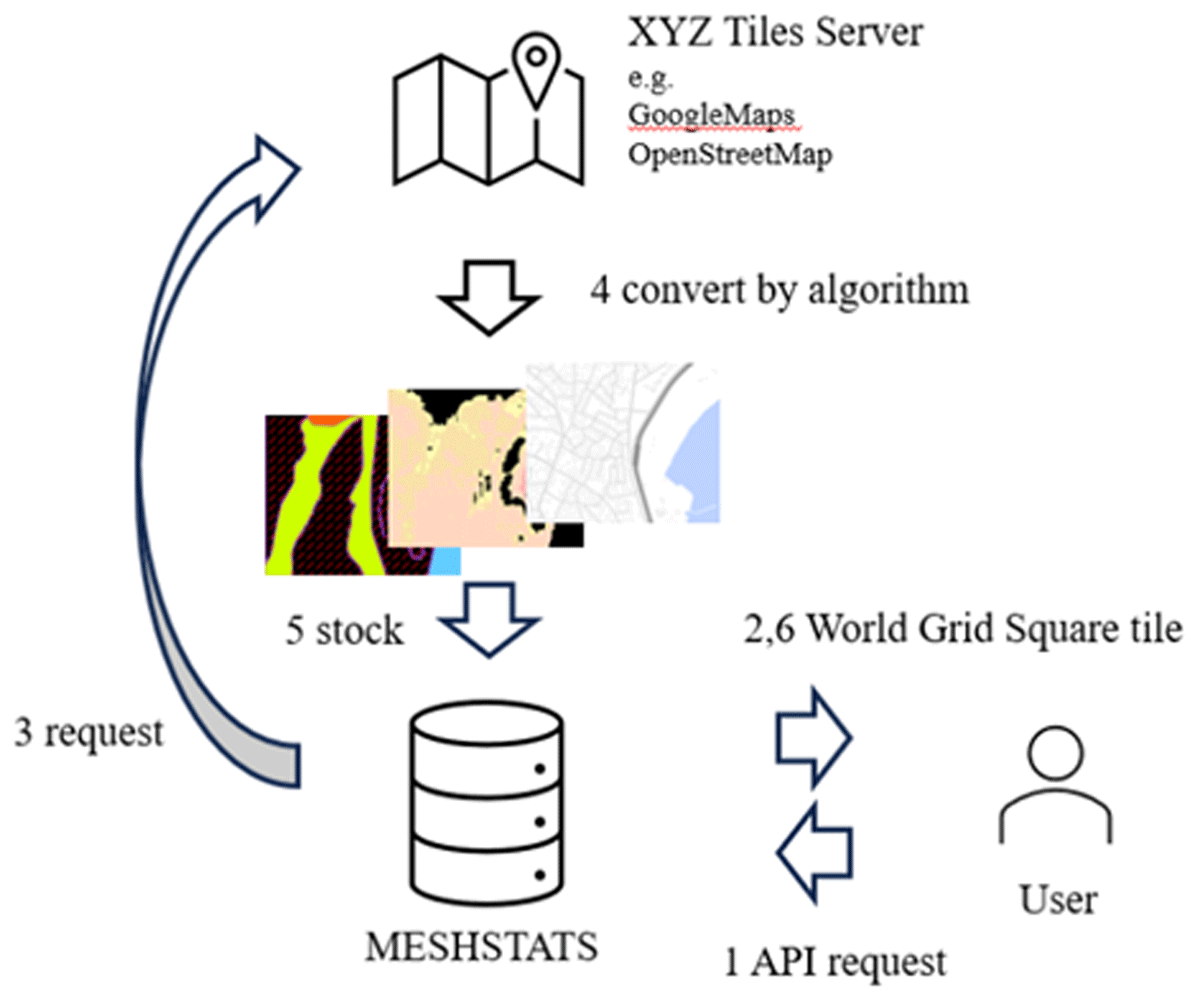
Figure 2
Relations between XYZ-based tiles and a World Grid Square tile.
Table 1
Maximum conversion error with the original Grid Square level according to the zoom level value of z.
| Z | 1 | 2 | 3 | 1/2 | 1/4 | 1/8 |
|---|---|---|---|---|---|---|
| GRID SQUARE LEVEL | ||||||
| 12 | 0.14% | 1.15% | 11.8% | 24.1% | 50.5% | 110% |
| 13 | 0.07% | 0.57% | 5.80% | 11.8% | 24.1% | 50.5% |
| 14 | 0.04% | 0.29% | 2.88% | 5.80% | 11.8% | 24.1% |
| 15 | 0.02% | 0.07% | 0.72% | 1.44% | 2.88% | 5.80% |
| 16 | 0.01% | 0.04% | 0.36% | 0.72% | 1.44% | 2.88% |
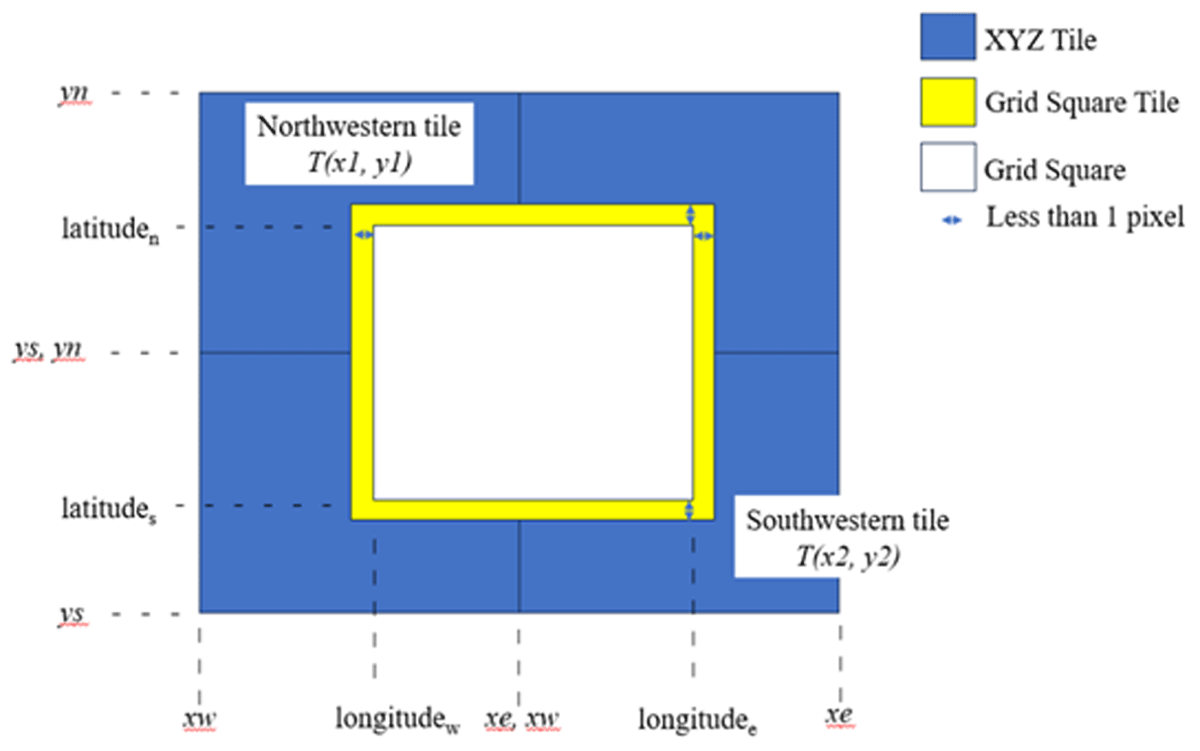
Figure 3
(a) Tsunami hazard map, (b) land condition map, and (c) graphical map at Kanazawa-Ku, Yokohama, Kanagawa Prefecture, Japan.
Table 2
Relations between levels of tsunami inundation depth, colors, and RGB color code.
| TSUNAMI INUNDATION DEPTH | COLOR | RGB |
|---|---|---|
| 0,0,0 | ||
| ~0.3 m | 255,255,179 | |
| 0.3~ 0.5 m | 247,245,169 | |
| 0.5 ~ 1.0 m | 248,225,166 | |
| 1.0 ~ 3.0 m | 255,216,192 | |
| 3.0 ~ 5.0 m | 255,183,183 | |
| 5.0 ~ 10.0 m | 255,145,145 | |
| 10.0 ~ 20.0 m | 242,133,201 | |
| 20.0 m~ | 220,122,188 |
Table 3
RGB color code for waterfront in the land condition map.
| LAND USAGE | COLOR | RGB |
|---|---|---|
| Waterfront | 101,202,253 |
Table 4
Land ratio and affected population in the region identified World Grid Square code 2053390500.
| TSUNAMI INUNDATION DEPTH | LAND RATIO | AFFECTED POPULATION |
|---|---|---|
| 0 m | 0.136946 | 1374.527 |
| ~0.3 m | 0.038192 | 383.3331 |
| 0.3 ~ 0.5 m | 0.034309 | 344.3594 |
| 0.5 ~ 1.0 m | 0.257085 | 2580.362 |
| 1.0 ~ 3.0 m | 0.361055 | 3623.909 |
| 3.0 ~ 5.0 m | 0.040394 | 405.4346 |
| 5.0 ~ 10.0 m | 0 | 0 |
| 10.0 ~ 20.0 m | 0 | 0 |
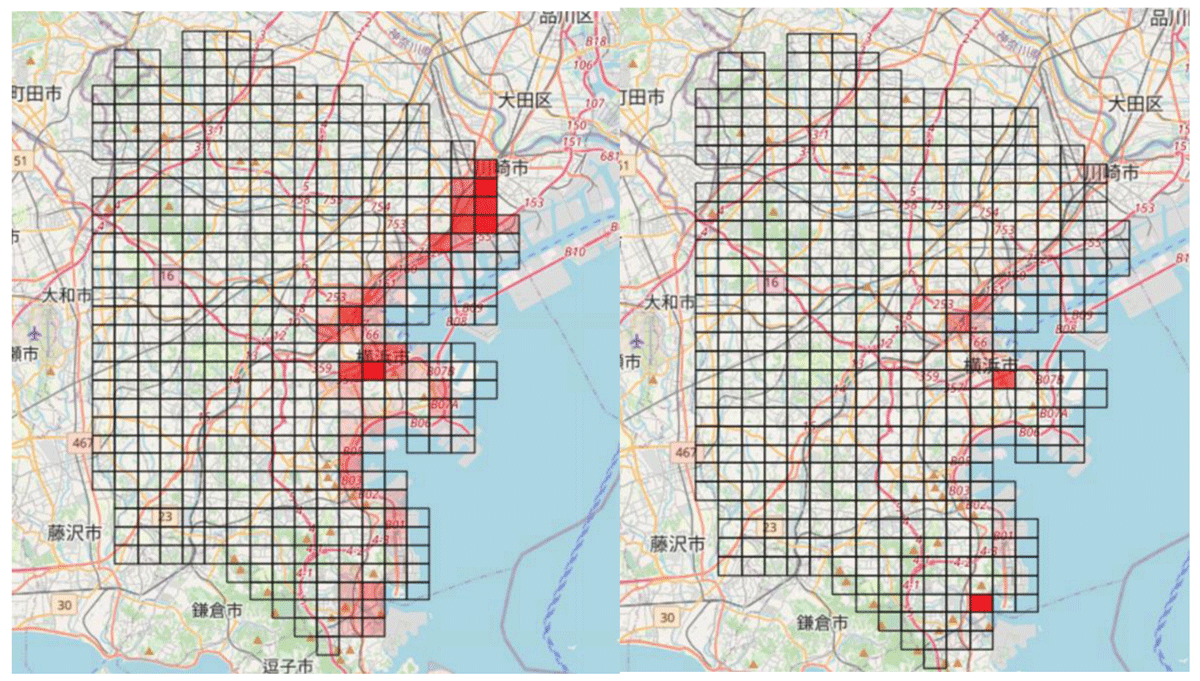
Figure 4
(Left) 3rd level Grid Square statistics on the influential population in Yokohama, Kanagawa, Japan, which are estimated from population census in 2015, (Right) 3rd level Grid Square statistics on the influential population with more than 3 m flooding height level.
Table 5
The number of people affected by each range of increased depth.
| CODE | UP to 0.3 m | 0.3 to 0.5 m | 0.5 to 1.0 m | 1.0 to 3.0 m | 3.0 to 5.0 m | 5.0 to 10.0 m |
|---|---|---|---|---|---|---|
| 2053390500 | 441.636 | 396.7353 | 2972.834 | 4175.102 | 467.1022 | 0 |
| 2053391459 | 547.4452 | 335.9536 | 3178.925 | 10252.67 | 84.22234 | 72.0569 |
| 2053391521 | 716.2998 | 1048.627 | 2253.313 | 3044.836 | 267.209 | 0 |
| 2053392525 | 400.2654 | 20786.42 | 707.9612 | 0 | 0 | 0 |