
1. Introduction
Since efficient data reuse across different scientific disciplines is crucial, we need to consider data analysis procedures from a multidisciplinary point of view. There are various types of data formats worldwide. Data scientists usually spend 80% of their time on data preparation and only 20% on data analysis (Press, 2016). Thus, increasing data readiness in every data science project across various fields is an important issue.
If an algorithm significantly reduces the preparation time for data with different formats, it may allow data scientists to focus more on data analysis and less on data preparation. This paper focuses on data conversion issues from XYZ Tiles to Grid Square-based tiles since Grid Square statistics are widely used in statistical data analysis for small areas.
Chow suggests a conceptual model for exploring and extending the existing functionalities of Maps APIs, which are widely used for displaying and processing both raster and vector data (Chow, 2008). This model is particularly relevant to our research as it provides a framework for understanding and working with different types of map data, including XYZ Tiles.
Serving XYZ Tiles using Web APIs is a conventional practice to provide map image data, not only standard maps, satellite images, and hazard maps (GSI Tiles). Several map services provide image data based on XYZ Tiles. For example, Open Street Map, Google Map, and a map service of the geospatial information authority of Japan provide their own map data based on XYZ Tiles.
According to Netek et al., the first web map was published in 1993. And then, in 2005, Google introduced XYZ map tiles, which have become the most popular standard for serving web maps. They also stated that there is a shift to vector data from raster data, but satellite or aerial-based maps rely on raster data (Netek et al., 2020). The advantage of using XYZ Tiles is that the data is calculated in advance on the server side, that there is almost no need for further calculations on the server side when providing map images, and that the map can be displayed to the user in a short time.
However, map tile data differs from other types of socioeconomic data, such as Grid Square statistics, which are mainly used in official statistics. It is necessary to convert map data formatted as XYZ Tiles into Grid Square-based tiles for comparative analysis with different data sources formatted in XYZ Tiles and Grid Square statistics.
This research aims to develop a data procedure using XYZ Tiles-formatted data with Grid Square statistics. This paper proposes a method for converting XYZ Tiles into a World Grid Square tile, which is compatible with the Japanese National Grid Square.
As a case study using the proposed data conversion procedure, we compared tsunami hazards and the population census, including several areas of physical exposure to the Tsunami, and estimated the number of evacuees from the population census.
The rest of the paper is organized as follows. Section 2 explains the proposed conceptual framework, XYZ Tiles, and our proposed method for converting XYZ Tiles into a World Grid Square tile. Section 3 evaluates conversion errors in the World Grid Square tile converted from XYZ Tiles. Section 4 explains a case study on tsunami hazard assessment in Yokohama, Japan, based on the proposed procedure. Finally, Section 5 discusses improvement plans for scheduling tsunami shelters. Section 6 is devoted to conclusions and addresses future work.
2. Data and Methods
2.1 Proposed framework
Figure 1 shows the proposed conversion framework from XYZ Tiles to a World Grid Square tile. The proposed framework is implemented into the MESHSTATS Web API by Research Institute for World Grid Squares. MESHSTATS (MESHSTATS Web API, 2023) processes the data conversion in the following way:
Users request World Grid Square tile by API to MESHSTATS.
If MESHSTATS retains request data, send data to the User.
If MESHSTATS does not retain the requested data, MESHSTS requests XYZ Tiles in an original server, such as Open Street Map or Google Maps.
MESHSTATS converts XYZ Tiles to a World Grid Square tile by algorithm.
MESHSTATS stores the World Grid Square tile.
MESHSTATS sends the World Grid Square tile to the User.
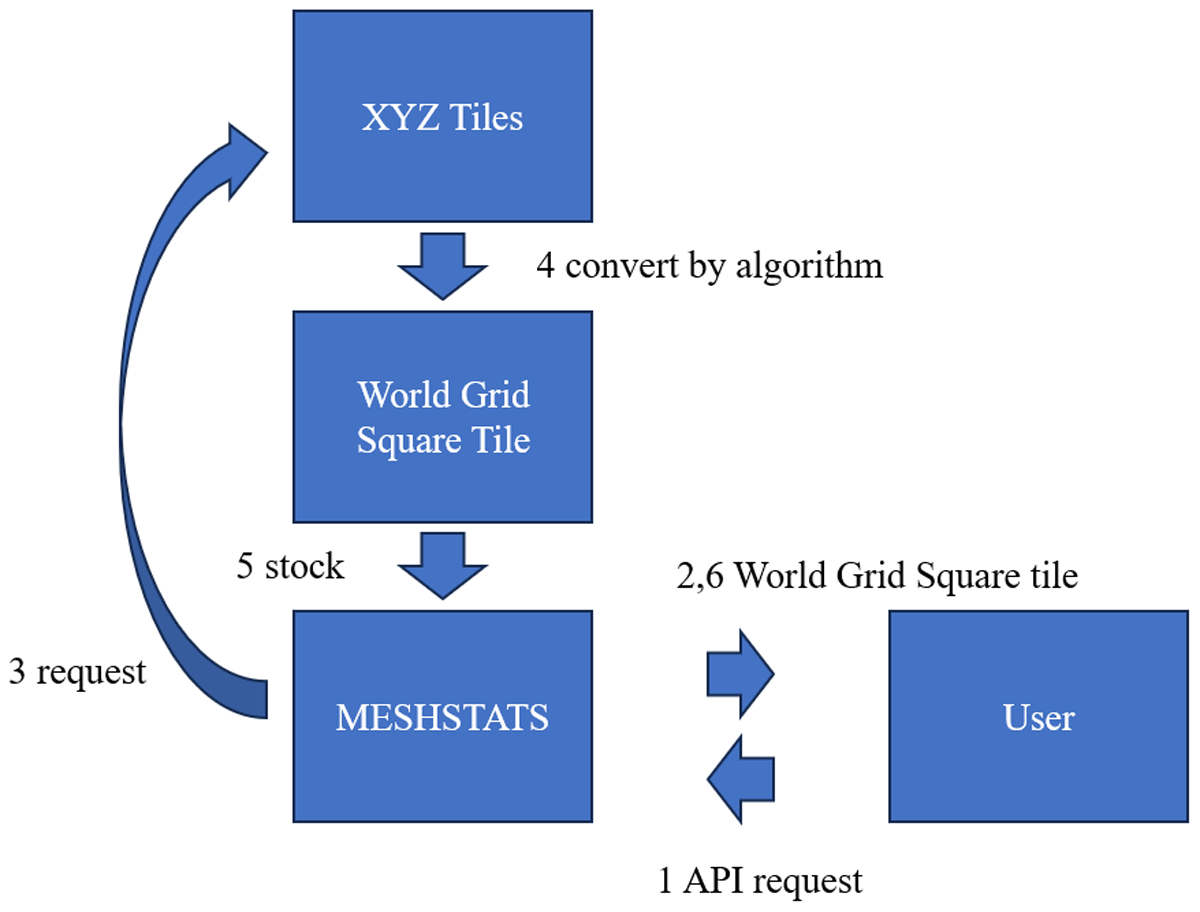
Figure 1
Schematic illustration of the proposed Web API.
This enables data analysis for Grid Square statistics with XYZ Tiles through the proposed Web API architecture.
2.2 XYZ Tiles (Slippy Maps)
XYZ Tiles are the most commonly accepted image delivery format in major web mapping services such as Open Street Map (OpenStreetMap), Google Maps (Google Maps Platform), and the Geospatial Information Authority of Japan. Tiling provides a means of partitioning map images to improve data transmission and display speeds. XYZ Tiles can be expressed as (z, x, y) where z is a given zoom level, x is the tile number in the north–south direction, and y is the tile number in the east–west direction. The x and y values can be calculated using the following formulas for any latitude and longitude in association with a given z value.
And by expanding this formula, we can get the tile’s upper left (north–west).
For example, Tokyo Station is located at longitude 139.767125 and latitude 35.681236. This is included in (227, 100) under z = 8, and (14552, 6451) under z = 14. Hereafter, this will be written as (8, 227, 100) and (14, 14552, 6451).
2.3 Proposed methods
Here, we explain the method for converting XYZ Tiles into a World Grid Square tile. We propose a six-step to identify the minimum World Grid Square tile from several XYZ-based map tiles.
Step 1: Set a given World Grid Square code and XYZ Tiles’ zoom level as z.
Step 2: Using the World Grid Square open library, identify easting longitude, westing longitude, northing latitude, and southing latitude (Research Institute for World Grid Squares, 2022).
(easting longitude, westing longitude, northing latitude, southing latitude)
= (longitudee, longitudew, latitudes, latituden)
Step 3: Obtain XYZ Tiles, including northwest, northeast, southwest, and southeast points of the given World Grid Square tile.
Let T(x1, y1) be the XYZ Tiles containing the northwestern edge latitude and longitude (latituden, longitudew) of Grid Square, and T(x2, y2) be the tile containing the southeastern edge latitude and longitude (latitudes, longitudee) of that. Figure 2 shows the relations between XYZ Tiles and World Grid Square tile. We obtain these tiles in between, i.e., (x2 – x1 + 1) × (y2 – y1 + 1) tiles. Tiles are identified according to the value of z. Then, x is represented by Equation 1 and y by Equation 2.
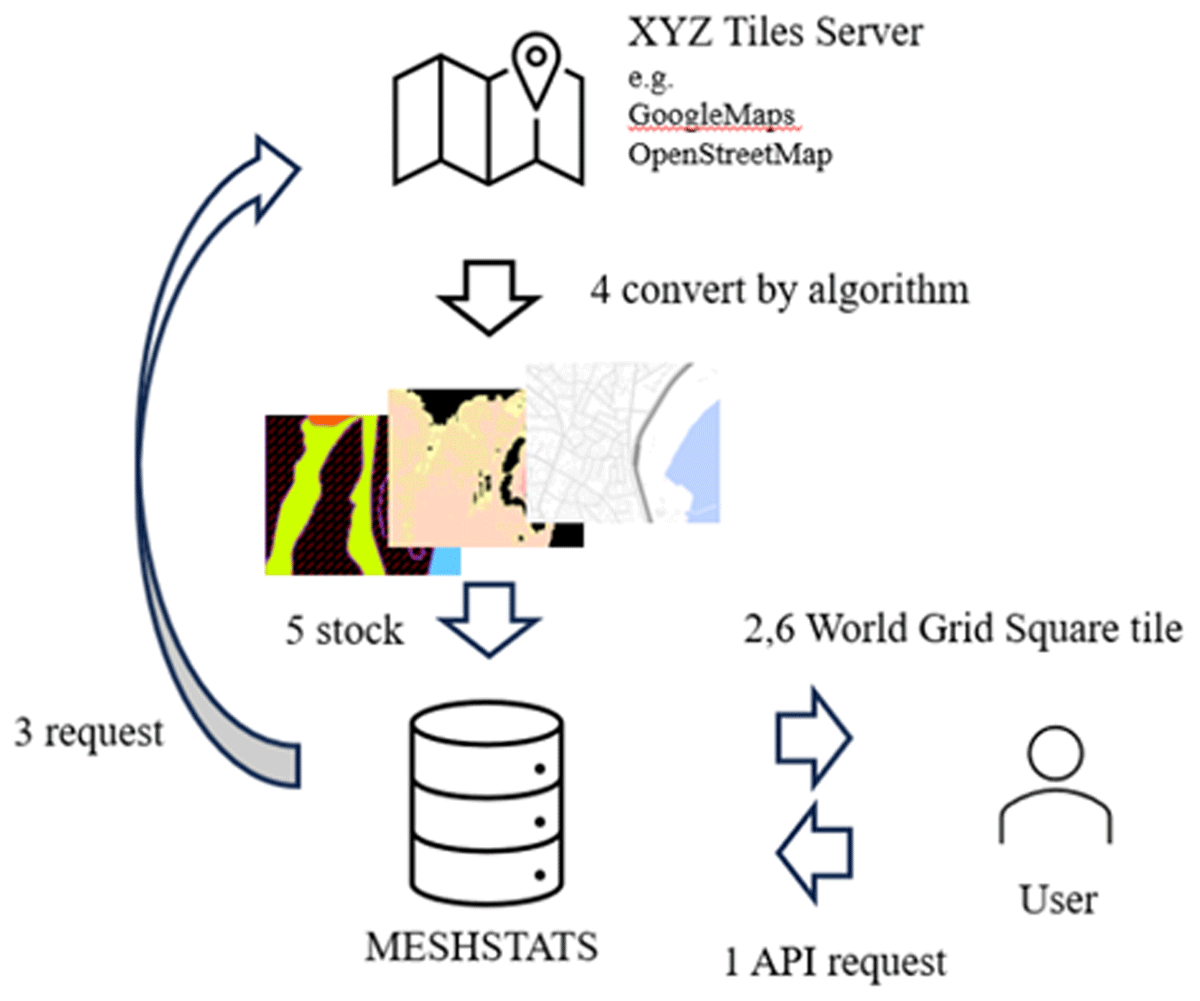
Figure 2
Relations between XYZ-based tiles and a World Grid Square tile.
Step 4: Determine the latitude and longitude values for the north-western and south-western corners of the north-westernmost tile, as well as the coordinate values for the north-western and south-western corners of the south-easternmost tile. The corner coordinates of a tile T(x, y) are provided by Equation 3 for the western boundary, Equation 4 for the northern boundary, Equation 5 for the eastern boundary, and Equation 6 for the southern boundary. X1 indicates the west longitude of tile x1, X2 indicates the east longitude of tile x1; X3 indicates the west longitude of tile x2, X4 indicates the east longitude of tile x2. Y1 indicates the north-end latitude of the y1 tile, Y2 indicates the south-end latitude of the y1 tile, Y3 indicates the north-end latitude of the y2 tile, and Y4 indicates the south-end latitude of the y2 tile.
Process 5: Identify the location of the Grid Square’s edge in the Tiles, then cut and join.
The position of the edge of east, west, south, north, and south of the Grid Square in the tile is specified using the latitude direction Equation 7 and longitude direction Equation 8 as latitude la and longitude lo, respectively. The northwest side is rounded down and the southeast side is obtained by rounding up.
Process 6: T(x1,y1) and T(x2,y1) are joined in sequence. This is repeated from y1 to y2 to complete a tile that completely encapsulates the Grid Square.
3. Conversion Error
We define the maximum conversion error as Equation 9, where lo = (longitudinal length of one Grid Square), la = (latitudinal length of one Grid Square), eq = equatorial circumference 40,075 km, and pc = polar circumference 39,941 km. Then, the maximum conversion error err in terms of zoom level Z and Grid Square level is obtained as shown in Table 1. The Grid Square tile created using this algorithm has a maximum conversion error of 2.88% with the 3rd level Grid Square under z = 14. For z = 15, this err is 1.43%. By selecting the appropriate zoom level for the Grid Square level, we can convert it into Grid Squares data from XYZ Tiles’ data with an appropriate error.
4. Case Studies on Tsunami Hazards
4.1 Background
A potentially devastating wave or series of waves is generated by an Earthquake, Landslide, volcanic eruption, or even a giant meteor hitting the ocean and causing a rise or mounding of water at the ocean surface. This phenomenon, known as a Tsunami, can travel across the open sea at about 500 mph and slow down to about 30 mph as it approaches land. However, the wave grows significantly in height around land, leading to inundation when running up to land.
The importance of accurate evacuation plans during a tsunami disaster cannot be overstated. People cannot evacuate to a shelter facility if it is over capacity. However, evacuation plans are generally designed in advance for those living there. The number of evacuees may need to be assessed during the pre-risk assessment stage. Therefore, comparing predicted flooding depth from tsunami and census populations is necessary when local authorities establish evacuation plans and assign shelter capacities based on area characteristics.
UNISDR reports that it is necessary to standardize a tsunami risk analysis method and suggests establishing online references and guidelines to assess tsunami hazards and risks (Løvholt, 2017). Globally, tsunami risks are dominated by rare but often very destructive events. Assessment of tsunami hazard and risk is required to support preparedness measures and effective disaster reduction. In most coastal locations, highly destructive tsunami events could be better represented in historical records, which tend to be short compared to the return period of large tsunamis (hundreds to thousands of years). The ‘low frequency/high consequences’ character of tsunamis induces considerable uncertainty in tsunami hazard and risk assessments.
Okumura et al. (2017) propose a methodology for tsunami risk assessment and apply it to a case study in Kamakura, Japan, based on the fundamental tsunami risk assessment flow consisting of (1) determination of the probability of flooding, (2) calculation of flood scenarios, (3) assessment of the consequences, and (4) integration into a risk number or graph.
The probability of flooding is approximated based on the data provided by local institutes with the flood scenarios. They show that a tsunami in Kamakura can result in thousands of casualties. They conclude that interventions such as improvements in evacuation systems, which would directly reduce the number of casualties, would greatly influence risk reduction. Sato and Sawai (2014) compute the physical exposure of the Japanese air transportation network to assess its tsunami risks. They use 1-km Grid Square statistics on population census to estimate the socially exposed value of airports and 1-km Grid Square statistics on tsunami hazard estimated from historical data of tsunami run-up events.
4.2 Evaluation
In this case study, we focus on the areas identified by World Grid Square code 2053390500 with the highest average exposure to tsunamis in Yokohama.
Following Step 1, we define the World Grid Square code 2053390500, and the XYZ Tiles’ zoom level z to be 14. Following Step 2, we use the World Grid Square open library and calculate the easting longitude, westing longitude, northing latitude, and southing latitude as 35.34166667, 35.333333. 139.6375, 139.625 respectively.
Following Step 3, we calculate the XYZ Tiles, including the northwest, northeast, southwest, and southeast points of the given World Grid Square tile. We calculate for Equations 1 and 2. By substituting longitudee and longitudew into Equation 1 and substituting latituden and latitudes into Equation 2, one has
(x1, x2, y1, y2) = (14546, 14547, 6470, 6471).
The 2053390500 region consists of four sections of the XYZ-based tiles identified as x = 14546 and 14547, and y = 6470 and 6471 at z = 14.
Following Step 4, we calculate the coordinate values for the north-western and south-western corners of the north-western tile, and the coordinate values for the north-western and south-western corners of the south-easternmost tile. Substituting X = 14546, 14547 into Equations 3 and 4 yields
(X1, X2, X3, X4) = (139.6142577125, 139.63623046875, 139.63623046875, 139.658203125)
Similarly, by substituting Y = 6470,6471 into Equations 5 and 6, one gets
(Y1, Y2, Y3, Y4) = (35.353158905445, 35.3352360278321, 35.3352360278321, 35.3173091745261).
Following Step 5, we identify the location of the Grid Square’s edge in the XYZ Tiles and cut join. Substituting X1, X2, and longitudeW into Equation 7 and rounding down to the decimal point, we obtain XA = 125. Substituting X3, X4, and longitudeE and rounding up to the decimal point, we obtain XB = 15. Substituting Y1, Y2, and latitudeN into Equation 8 and rounding down to the nearest whole number, we obtain YA = 164. Substituting Y3, Y4, and latitudeS and rounding up to the nearest whole number, we obtain YB = 28. Therefore, it is determined that the region indicated by World Grid Square code 2053390500 consists of the 125th pixel of x = 14546 through to the 15th pixel of x = 14547 and the 164th pixel of y = 6470 through to the 28th pixel of y = 6471.
We produce a World Grid Square-based map tile using the proposed algorithm from XYZ Tiles. Figure 3a shows a tsunami hazard map (Ministry of Land, Infrastructure, Transport and Tourism of Japan), Figure 3b a land condition map (Geospatial Information Authority of Japan, 2012, ‘Usage Information’), and Figure 3c a standard map (Geospatial Information Authority of Japan, 2013, ‘Standard map’) in the area identified by World Grid Square code 2053390500.
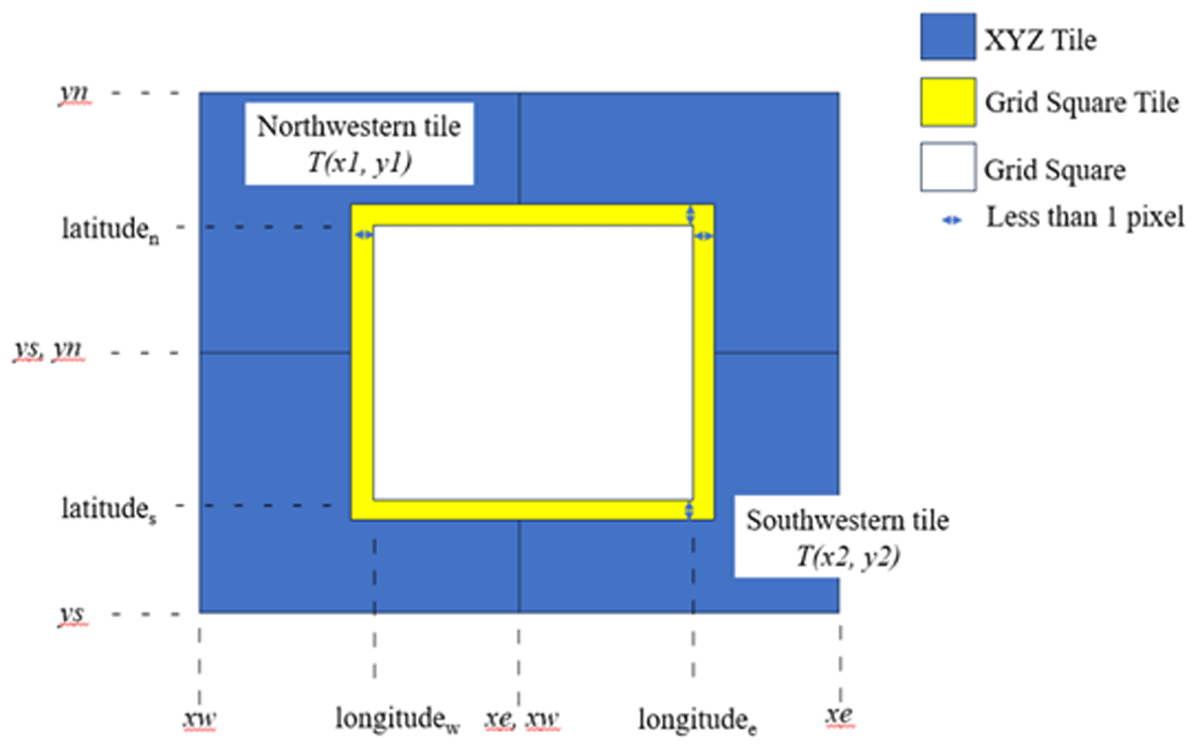
Figure 3
(a) Tsunami hazard map, (b) land condition map, and (c) graphical map at Kanazawa-Ku, Yokohama, Kanagawa Prefecture, Japan.
4.3 Discussion
We developed Web API to obtain a World Grid Square map tile from a World Square code (Research Institute for World Grid Squares, 2022). In this section, we show how a Grid Square was created using the proposed algorithm to predict the number of tsunami victims and compare the gap with the capacity. We propose a computation scheme consisting of six steps as follows:
We use the MESHSTATS API to create a tsunami hazard map and a land condition map.
We obtain the number of color codes for inundation depth from the tsunami hazard map and the number of color codes for the waterfront from the land condition map. We show the relationship between tsunami inundation depth levels and color codes in Table 2. We also show a color code to indicate the waterfront in the land condition map in Table 3 (Geospatial Information Authority of Japan, 2016).
We compute the percentage of waterfront area from the percentage of RGB(0,0,0) in the tsunami hazard map and estimate the land area of the target region.
We obtain the population of the target region from Grid Square statistics about the census population provided by the Statistics Bureau of Japan.
The population distribution for each inundation depth can be calculated by the following equation:
We compare the capacity of designated shelters in the Grid Square with the number of people affected and analyze the target region.
As an example, we attempt to estimate the population affected by tsunami runup events for the region identified by World Grid Square code 2053390500. We convert Grid Square based tile for a tsunami hazard map, a land condition map, and a standard map. From the Grid Square statistics about census population 2020, we can identify the population in the target area as 10,037. We estimate land ratio and population influenced by tsunami runup events as shown in Table 4.
Table 4
Land ratio and affected population in the region identified World Grid Square code 2053390500.
| TSUNAMI INUNDATION DEPTH | LAND RATIO | AFFECTED POPULATION |
|---|---|---|
| 0 m | 0.136946 | 1374.527 |
| ~0.3 m | 0.038192 | 383.3331 |
| 0.3 ~ 0.5 m | 0.034309 | 344.3594 |
| 0.5 ~ 1.0 m | 0.257085 | 2580.362 |
| 1.0 ~ 3.0 m | 0.361055 | 3623.909 |
| 3.0 ~ 5.0 m | 0.040394 | 405.4346 |
| 5.0 ~ 10.0 m | 0 | 0 |
| 10.0 ~ 20.0 m | 0 | 0 |
The evacuation centers in this area are Kanazawa Elementary School, The Park House Oikos Kanazawa-Bunko, and Seaside Line Umi no Koen South Exit. These three evacuation centers should accommodate 7,338 people (rounded up to the nearest whole number) who are expected to be affected by the earthquake (~0.3 m) or more. Outliers are removed from 2,108 of the 2,111 Kanagawa Prefecture shelters with area data with a threshold value of 1.5. Since a shelter’s exclusive area per person is from 1.57 m2 to 2.93 m2, each shelter can accommodate approximately 1,000 to 2,000 people (Cabinet Office, Government of Japan, 2008). This indicates that the three shelters can accommodate between 3,000 and 6,000 people, which is less than the number of expected evacuees and cannot be accommodated in the shelters.
Figure 4 (left) shows that the affected population is concentrated along the coastal areas but that inland areas along the rivers will also be flooded. Other areas of concentration include the areas near the border with Kawasaki City, the area containing the Kawasaki Police Station (the area around code 2053392525), and the area around Yokohama Station (code = 2053391459). Specifically, there are some places near Yokohama Station where the tsunami height exceeds 5 m (code = 2053391459).
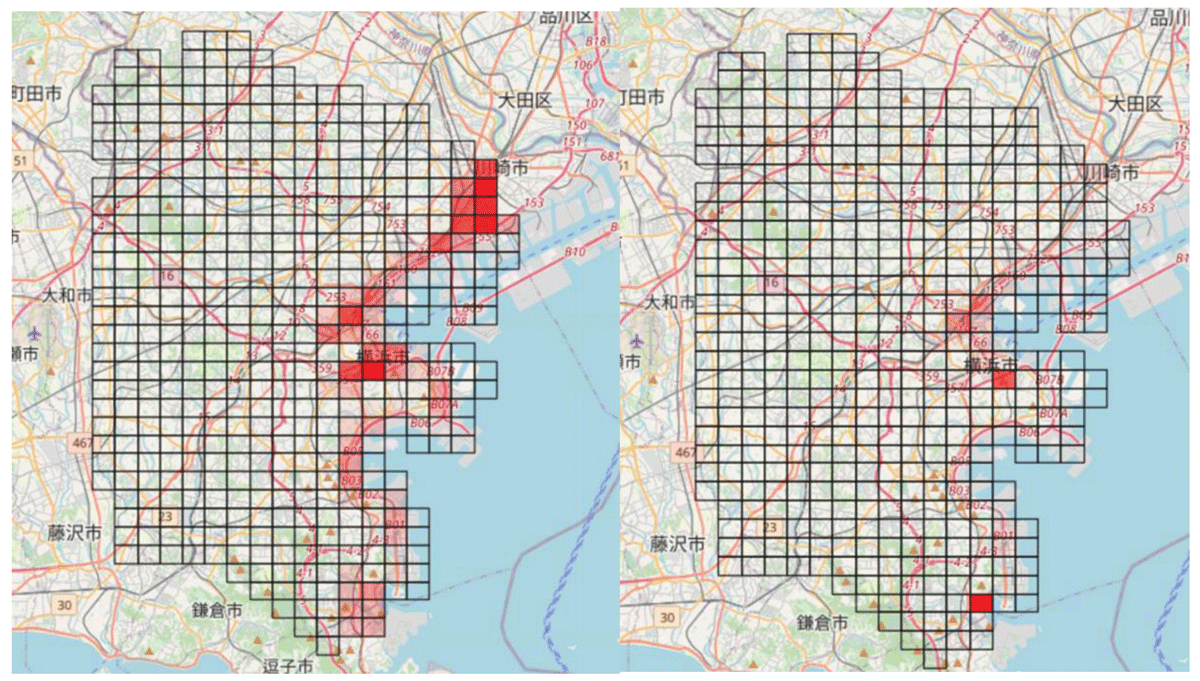
Figure 4
(Left) 3rd level Grid Square statistics on the influential population in Yokohama, Kanagawa, Japan, which are estimated from population census in 2015, (Right) 3rd level Grid Square statistics on the influential population with more than 3 m flooding height level.
Figure 4 (right) shows that the population affected by tsunami inundation depths of 3.0 m or greater is particularly concentrated in the area around Ishikawa-chou, Naka-ward, Yokohama City code = 2053391521, and the area around Deiki, Kanazawa-ward, Yokohama City code = 2053390500. From Figure 4 (right) we can determine the priority of locations in terms of tsunami’s affected population.
Table 5 shows the number of people affected by each inundation depth in the code = 2053390500, 2053391459, 2053391521, and 2053392525 areas for the affected population used in Figure 4. The 2053390500 area has the highest number of people affected above 3.0 m, 2053391459 has 5.0 m to 10.0 m, and 2053392525, on the other hand, is expected to be inundated up to 1.0 m. There are some places at code = 2053391459 (near Yokohama Station) where the tsunami height exceeds 5 m. This is captured by the statistical calculation shown in Table 5, however, it is difficult to make a quantitative assessment of hazards and risks based on color map images of hazard data.
Table 5
The number of people affected by each range of increased depth.
| CODE | UP to 0.3 m | 0.3 to 0.5 m | 0.5 to 1.0 m | 1.0 to 3.0 m | 3.0 to 5.0 m | 5.0 to 10.0 m |
|---|---|---|---|---|---|---|
| 2053390500 | 441.636 | 396.7353 | 2972.834 | 4175.102 | 467.1022 | 0 |
| 2053391459 | 547.4452 | 335.9536 | 3178.925 | 10252.67 | 84.22234 | 72.0569 |
| 2053391521 | 716.2998 | 1048.627 | 2253.313 | 3044.836 | 267.209 | 0 |
| 2053392525 | 400.2654 | 20786.42 | 707.9612 | 0 | 0 | 0 |
5. Conclusion
We proposed an algorithm to convert XYZ Tiles into a World Grid Square map tile. Our method enables users to analyze data provided by different organizations using XYZ Tiles data.
We implemented a Web API to obtain a World Grid Square tile converted from XYZ Tiles data for a given World Grid Square code and a zoom level in MESHSTATS. Users request the World Grid Square code by the Web API to MESHSTATS. If MESHSTATS caches the requested World Grid Square tile data, MESHSTATS sends it. Otherwise, using the proposed algorithm, MESHSTATS converts XYZ Tiles into a World Grid Square tile. MESHSTATS stores and sends it to users.
We evaluated the accuracy of the converted World Grid Square tile converted from XYZ Tiles.
As a case study using the proposed method, the number of tsunami victims was predicted from the tsunami hazard map created in Yokohama City, Kanagawa Prefecture, Japan. Moreover, it was revealed that more shelter capacity needs to be built in some regions. The affected population was analyzed in this analysis, combining information about flooding height levels indicated by the tsunami hazard map and the census population.
Future work will involve estimating the time-dependent population affected by tsunami disasters using Grid Square statistics on dynamic populations computed from smartphone GPS data and cellular system antenna logs.
Funding Information
This work was conducted at the platform MESHSTATS developed by a research project financially supported by JST MIRAI entitled ‘Architecture design and actual proof for self-distributed World Grid Square statistics platform.’ (Project leader: Prof. Dr. Aki-Hiro Sato; Grant Number: 2020 JPMJMI20B6; Duration: November 2020–March 2023).
Competing Interests
The authors have no competing interests to declare.