
1 Introduction
ORFEUS (Observatories and Research Facilities for European Seismology1) is a non-profit foundation that promotes seismology in the Euro-Mediterranean area through the collection, storage and distribution of seismic waveform data, metadata, and closely related services and products. It is also the European organisation to distribute seismological waveform data within the European Plate Observing System (EPOS2). The European Integrated Data Archive (EIDA, 2016) within ORFEUS is a distributed system which provides access to seismic waveform data from European archives. EIDA’s role is to ensure federated data and metadata delivery services, organise EPOS integration and manage interactions with the FDSN. EIDA has been described by Strollo et al. (2021).
Data is hosted across 12 European seismological data centres, so-called EIDA nodes3 and made available through the same inter-operable methods. In the following, we use the term data centre and EIDA node interchangeably. EIDA, as a whole, fully complies to domain specific international standards as defined by the International Federation of Digital Seismograph Networks (FDSN4). The requirements for a node to join EIDA is to respect FDSN data and metadata standards and operate a defined set of protocols and services. Each EIDA node has different data management and data distribution infrastructure, software, data volumes, staffing level, institutional and national constraints.
It is becoming increasingly important to be able to demonstrate the scientific impact of the EIDA services at regional, national and European levels, both for institutional support and for funding purposes. Therefore, the EIDA Management Board (EMB) continuously dedicates effort to improve knowledge on impact. In the context of distributed research infrastructures, such as many European Infrastructures on the European Strategy Forum on Research Infrastructures (ESFRI) road map,5 the indicators need to be homogenised across many organisations to build consistent Key Performance Indicators (KPIs).
EIDA is an ideal test case for developing such systems, as it has a very strong and mature federative culture and a moderate number of federated data centres (presently 12, and still growing).
EIDA presently has two complementary strategies to provide insight on impact and usage. The first one is to strongly support the attachment of persistent identifiers (DOI) to each dataset and to link them to citation metadata (authors, funders, stakeholders, …). For waveform data, FDSN has published a set of recommendations (Evans et al., 2015) updated in 2023 (FDSN, 2014) and provides a DOI minting service (operated by EarthScope [2014]) and citation tool. ORFEUS supports the implementation of DOIs for seismic networks, both by helping networks who need identifiers and by undertaking actions towards publishers, through collaboration with partner organisations, and through interaction with scientific users of the network data. Usage information from that channel is increasing but it is still sparse because data citations through identifiers are still gaining traction in the community. Once the networks are systematically cited through these identifiers it will be possible to understand better the use of data: scientific publications versus private sector reports, areas of research, connection to publication keywords, etc.
A second strategy, which is the subject of this article, is to quantify service usage through logging of metadata and data requests in order to build a set of key indicators. Carefully chosen key indicators can give a quantified view (albeit approximate) of the number of users and their geographical distribution, shipped data volumes and number of requests.
In parallel, the KPI needs for research infrastructures is progressively being harmonized, in particular after the publication of the ESFRI Report ‘Monitoring of Research Infrastructures Performance’ (ESFRI Working Group, 2019). It highlights that the KPIs applied to a Research Infrastructure should fulfil the ‘RACER’ criteria (Relevant, Accepted, Credible, Easy to Monitor), and promotes 21 indicators. Most of these are mainly adapted to single site physical Research Infrastructure where the applicants, users, user profile, and ensuing results (e.g., scientific articles) are well known. Some of them however are relevant for data services and distributed research infrastructures where services are accessed anonymously by a large number of users worldwide. In particular, the KPI 1 (Number of user requests for access) and 2 (Number of users served) can be evaluated through the monitoring of service usage. Additional KPIs depend on knowing the geographical location of users (KPI 8, ‘Share of users and publications per ESFRI member country’, and KPI 17, ‘Share of users and publications per non-ESFRI member country’) can at least be partly estimated through service usage monitoring. These and additional KPIs may be relevant across different institutions and countries.
The KPI collection and aggregation requires that all the EIDA nodes agree on a set of prioritised service usage KPIs that are useful to EIDA, and to all or a subset of nodes and other potential users of the KPIs. Additionally, a strong constraint is that each node can provide the logs used for the KPIs calculation. This is a common challenge across most EPOS Thematic Core Services and other distributed infrastructures, which is why it is subject of dedicated harmonisation efforts within the European project Geo-INQUIRE.6 Discussions within this context, across almost all EPOS Thematic Services and several other distributed Research Infrastructures, demonstrated the necessity and the challenge of adopting and operating a KPI system aggregated across several data centres, and of being able to serve KPIs at different granularity to different users.
This article addresses how EIDA designed a federated KPI system where metrics are collected locally at each node and consolidated in a central database. The federated KPI system has been operational since April 2021. Today, EIDA is in a good position to evaluate the process, strengths and weaknesses of the system, and to share the lessons learnt with a larger community; this sharing of practical experience is the main objective of the article.
2 Technical Framework of KPIs Collection
The section provides the basic information needed to understand the technical context and constraints that had to be considered when designing the KPIs system.
Seismological waveform data are identified through a hierarchical naming schema. Seismic stations are part of a network, for which a network code is provided by the FDSN. Within a network, the data is then hierarchically organised by station (with a station code), location (with a location code) and high-level instrument and time sampling information (with a channel code). As a side note, the need for a location code origins in situations where a single station may have multiple instruments, not precisely collocated. The quadruple network|station|location|channel uniquely identifies the data stream. This naming schema is part of the FDSN standards (FDSN, 2020).
The end users access metadata and data based on FDSN standard web services (respectively fdsnws-station and fdsnws-dataselect) (FDSN, 2019) served at all EIDA nodes. These requests may be sent directly by the end user, programmatically (for instance with the Obspy Python library (Krischer et al., 2015)) or from other tools such as interactive web interfaces. Ultimately, all metadata and data requests result in requests to a specific EIDA node over the HTTP protocol. Almost all data requests are made by programs; interactive access is marginal. For instance, the Epos-France national seismological data centre registers less than 2% of requests issued through web browsers. Web crawlers which scrape web sites by following each possible link cannot issue any valid data request. Therefore, there is no significant added value of keeping, in the KPI system, a trace of the tools used to access the data (known as the user agent).
As a first step, the KPI system focuses on the data delivery service, fdsn-dataselect. This service has a very rich set of options and various selection parameters that can be expressed either in the URL or in the body of an HTTP POST requests. In this way, the users can cut and slice in the data holdings over multiple time windows and source identifiers. This makes it impossible to deduce the amount of data distributed grouped by identifiers by observing only web server logs: the shipped data volume needs to be provided by the backend.
In EIDA, data is hosted and distributed through (presently) 12 data nodes. Discoverability, metadata access and data download are possible through a central routing system. While most network data are hosted at a single node, some are distributed over several nodes, for example, large international seismological experiments operating under a single network code, and the splitting of the data streams can go down to channel level. In this distributed context, the high level KPIs for data usage of a seismological network has to be aggregated over several nodes.
To be part of the EIDA federation, a node has to provide all the waveform related services described by the FDSN web services specification (FDSN, 2019). Although a majority of nodes deploy the same software stack (Helmholtz-Centre Potsdam-GFZ German Research Centre for Geosciences and GEMPA GmbH, 2008), other nodes have their own implementation. For the KPI system, the requirement for all EIDA nodes is to produce a detailed log of the requests in a specified text format. As a side note, each node has operational monitoring systems adapted to their local context, so the KPI system is not aimed at operational use cases.
Only a few of the data sets distributed in EIDA are not available in open access. Therefore, almost all data requests are issued anonymously and the only information that can account for the number of users is the origin’s IP address. We discuss the limitation of this information in Section 4.2.
The first generation of data distribution system for EIDA (now retired Arclink7) had the capacity of providing basic KPIs values based on daily emails from each EIDA node and aggregated by the EIDA node hosted at the German Research Centre for Geosciences in Potsdam (GFZ Data Services, 2017). When EIDA migrated to the standardised FDSN web services, this capacity was not immediately implemented. Designing a new system for key indicators across EIDA, rather than reproducing the functionalities of the old one, was therefore a priority for EIDA.
3 Management Process
The strategy for defining KPIs and their intended audience may explain the good performance and low cost of the system, and may potentially be useful for others who wish to design a similar system. In the following we will use the term EMB for the EIDA Management Board, composed of one member from each of the EIDA primary nodes and ETC for the EIDA Technical Committee composed of engineers from the EIDA nodes (with at least one member per EIDA Primary node).
3.1 User driven approach to define the required indicators
The EMB decided to design the usage indicators system with a pragmatic approach based on an assessment of which information is needed by whom, and for which purpose. This was a four-step process, based on the most common use cases of the indicators system: identifying target user groups, identifying KPIs for each of them, specifying granularity levels of the KPIs and finally choosing the most relevant time buckets.
3.1.1 Identifying target user groups
In the first step, the EMB identified four priority target user groups:
Network technical staff, either field personnel or local station managers. The purpose could be, for example, to demonstrate impact at institutional level, or to prioritise field interventions depending on how much data from a station are used.
Principal Investigator, here defined as the scientific manager of a temporary or a permanent seismic network. Their needs can be the same as those above (in some cases it may even be the same person), with additional purposes related to network wide needs, such as funding of network activities, or demonstration of scientific impact of previous temporary experiments, either for career or for funding purposes.
EIDA node managers. This group has KPI needs that are similar to those of Principal Investigator, but at network level, for example, to prioritise data integration between networks, calculation of quality metrics, interaction with network operators etc. EIDA nodes additionally need KPIs at node level, related to management and funding at institutional, regional, national and European level.
The EMB mainly needs to provide overall KPIs to ORFEUS and to EPOS and needs to demonstrate EIDA impact for funding purposes.
As can be seen from the list above, different levels of management need information at different granularity. Note that the funding agencies or the institutions are not listed as priority users, as the EMB considered that the information to defend funding proposals and yearly budgets should be prepared by the management at each level, to present the information in a consistent form with the funding agency’s expectancy and formats. Also, the public and scientific users are not included in the priority target user groups.
3.1.2 Identifying KPIs for each group
The second step was to define and prioritise which information these target user groups need, formulated as a set of questions which a user may ask. These priority questions are:
How many requests? The number of correctly formatted data requests made through fdsnws-dataselect. This number demonstrates how many the requests the EIDA node needs to process, independently of whether there are any available data.
How many successful requests? The number of data requests that actually delivered data.
How much data shipped? The volume delivered through fdsnws-dataselect service.
How many distinct users? The number of different users that requested data.
How many authenticated users? The number of different users that authenticate while requesting data.
Geographical distribution of requests? The numbers above, associated with the country from where the requests have been issued.
3.1.3 Identifying granularity levels for the KPIs
In the third step, the EMB identified different levels of granularity for the response to the questions, to be able to define which level of information is the most important for each targeted user group:
Station Values at station level.
Network Values for a seismological network as a whole.
Node Values across all data holdings of an EIDA node.
EIDA Values across all EIDA nodes.
3.1.4 Identifying time buckets
In the fourth and final step, the EMB defined over which time periods the data should be aggregated. The size of the time buckets will have a direct impact on the database size and request processing time. For all the user groups defined above, the KPI are meaningful for yearly or monthly statistics.
3.1.5 Restricting KPI access at network level
While the general strategy is to have the KPIs as openly accessible as possible, the EMB identified at a later stage that KPI access at network level is under the authority of the network managers. Therefore, it was required that the access to the KPIs can be restricted at network level.
3.2 Presenting the requirements to the technical staff
In order to ease the communication process between management board and technical committee, the EMB produced a matrix representing the combinations of all parameters. A colour code was given for the criticality of the combination of user target group, question and granularity. The ETC was asked to make sure that all top criticalities were addressed by the system, and to the extent, possible that lower levels were addressed as well, in the order of criticality that was indicated in case of conflict.
This matrix (see Supplementary Material 1) has served as an overview for all the requirements of the project and was a reference document throughout the development phase.
4 Technical Analysis of the Requirements and Strategic Technical Choices
With the requirement matrix finalised by the EMB, the ETC was able to consider implementation choices and identify possible technical problems. Also, the ETC could evaluate the resources necessary for the software development. Besides, acknowledging the important share of Information and Communication Technology in the global environmental crisis (Istrate et al., 2024), the technical design aims at minimizing the footprint of the implementation. In this section, we present the main challenges and the strategic choices made before the implementation.
4.1 Data delivery estimation
Many open-source solutions provide tools for HTTP traffic analysis. Usually, inside an HTTP web server, it is easy to track the request parameters appearing as options in the URL, the status of the request (successful or in error), and the amount of data delivered to the client. But, due to our technical context, detailed in Section 2, those tools are not fit for the EIDA KPI system.
Figure 1 illustrates the logging methods on the web server and the dataselect engine and showcases the information that exists at the two levels. In the webserver logs, the response size is a global value that cannot be attributed to source identifiers. On the contrary, the data delivery logs provide the number of bytes delivered for each source identifier.
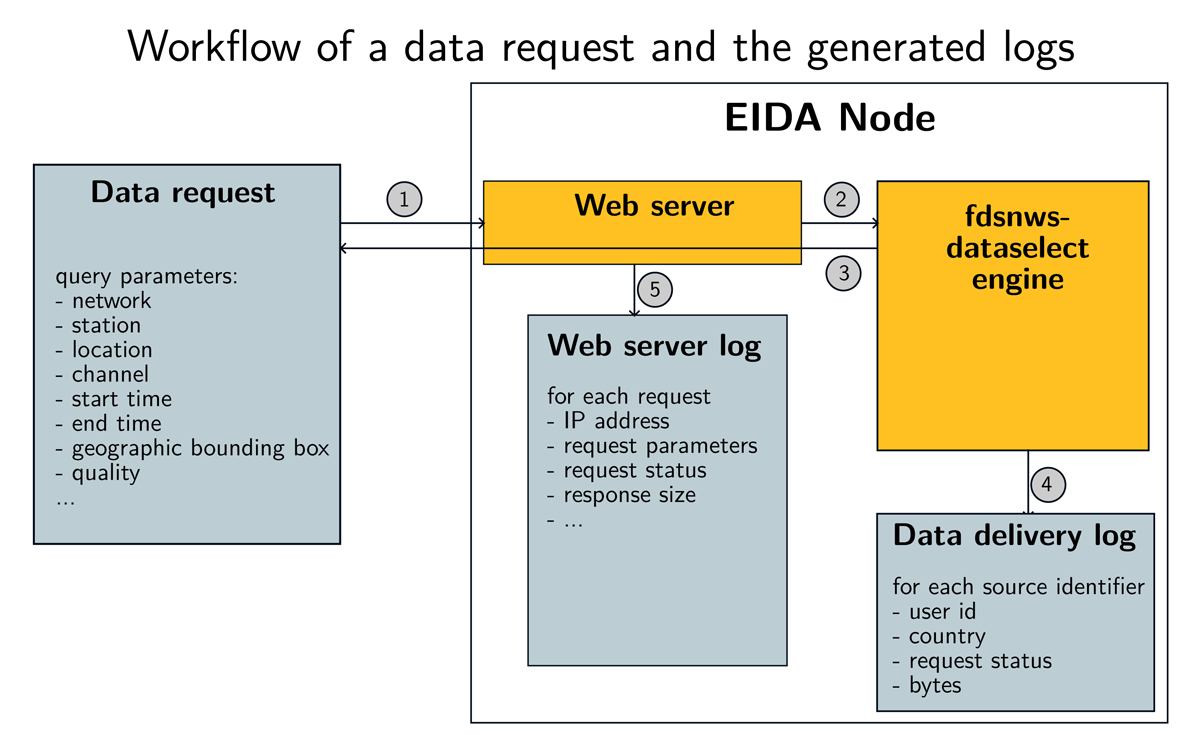
Figure 1
Illustration of how a request is logged in an EIDA node: (1) a request with a set of constraints arrives to the web server; (2) the request is transmitted to the fdsnws-dataselect engine that analyses the constraints, finds the matching data; (3) the data are delivered; (4) the data shipped are analysed in order to write a data shipment report; (5) the web server logs the request. Note that in the webserver log, the response size is a global value that cannot be attributed to source identifiers, while the data delivery log provides the number of bytes delivered for each source identifier.
4.2 Number of different users
Another request from the EMB is to know how many different users are using data from EIDA. There are several challenging issues with this request.
In order to evaluate the number of distinct clients to the service, the EIDA nodes need to identify the user of each request. This identification can be made in two ways:
When the data request is authenticated, the EIDA node retrieves the email address of the user
When the data request is anonymous, the EIDA node retrieves the IP address.
4.2.1 Approximating the number of users by the number of distinct IP addresses
In the context of generally anonymous data access, there is no way to identify an individual. As a user can be either a person or a computer program, we agreed to map the concept of a user to the IP address. Therefore, each unique IP address is considered as a user. Sometimes we refer to users as clients, both words designating this proxy. This information can, at best, be a proxy for the unique users’ evaluation due to two limitations:
The same user can use several IP addresses to request data (for instance from a computing cluster, or Dynamic Host Configuration Protocol (DHCP));
The same IP address is used by several people, in the case of a centralised server with many users like HPC platforms or Network Address Translation (NAT);
Over time, the data access methods may evolve with more HPC usage, for instance, changing the proportion of real user behind one IP address.
In spite of these shortcomings, the number of different IP addresses gives a meaningful approximation of the number of users, by giving a reasonable order of magnitude.
4.2.2 Anonymising the logs
Both email and IP addresses are considered as personal information and thus, the system should take care of privacy considerations, and comply to the General Data Protection Regulation (GDPR8). We manage this by anonymising the IP addresses in each node, followed by an additional layer (hyperLogLog, see below) before shipping any information to the central node. In this way, each node is fully responsible for respecting GDPR locally, while the central node does not handle data that falls under GDPR legislation.
Therefore, during the data logging process at the fdsnws-dataselect engine level, the user’s email or IP address is digested to compute a user identifier. This process is done using a hash function,9 and guarantees that:
The same input always results in the same user ID (it is deterministic),
It is difficult to retrieve the initial information by making a reverse computation (non-reversible one-way function10).
Note that this hashing algorithm is common to all the implementations across all EIDA nodes,11 otherwise, the number of users across EIDA becomes meaningless.
4.2.3 Computing the cardinality of unique users on target time windows
The unique users indicator is specific because the sum of unique users across all the aggregates or for large time windows would count the same users several times. It is a very common use case to retrieve seismological data from several EIDA nodes simultaneously. This is usually known as the count-distinct problem.12 To take into account multiple occurrences of the same IP address when aggregating time windows, we used the HyperLogLog (Flajolet et al., 2007) algorithm which can aggregate together sets of information and evaluate very efficiently the cardinality of elements in them, with an acceptable accuracy for the project (2% standard error).
The resulting object does not carry the original information (in our case a hashed IP address or user email) but only sets of numbers that allow to estimate a cardinality. This property is particularly interesting because the values manipulated by the central system does not contain any personal data, not even the hashed IP address.
The requirements issued by the management process state that the time granularity of the indicators should be by month and by year. The aggregative property of HyperLogLog sets enables the possibility to minimise the size of the database according to the initial intention of the project to minimise its ecological footprint. Therefore, the indicators in the central database are aggregated by month (see Section 5.3 for implementation details).
4.3 Aggregation over EIDA nodes
Three strategies have been discussed when designing the federated indicators system:
Fully centralised: all logging information is shipped and centralised by a single node;
Fully distributed (distribution of logging information from each EIDA node, with clients built on top for the aggregate, build indicator values and make them accessible);
Hybrid approach: logging information is aggregated locally on each EIDA node, and aggregated values are shipped and centralised by a single node.
Finally, the latter model was chosen, based on the advantages and disadvantages set out below.
4.3.1 Centralised storage and exploitation of logging information
The centralisation of storage and exploitation implies that each data centre sends all collected data request information to a single EIDA node which takes the responsibility of storing and computing indicator values based on all the logs. The advantage of centralising each data query event through a centralised database is that it enables new possibilities like carrying out knowledge discovery on the data request patterns, or even alerting in real-time. This architecture is shown in Figure 2.
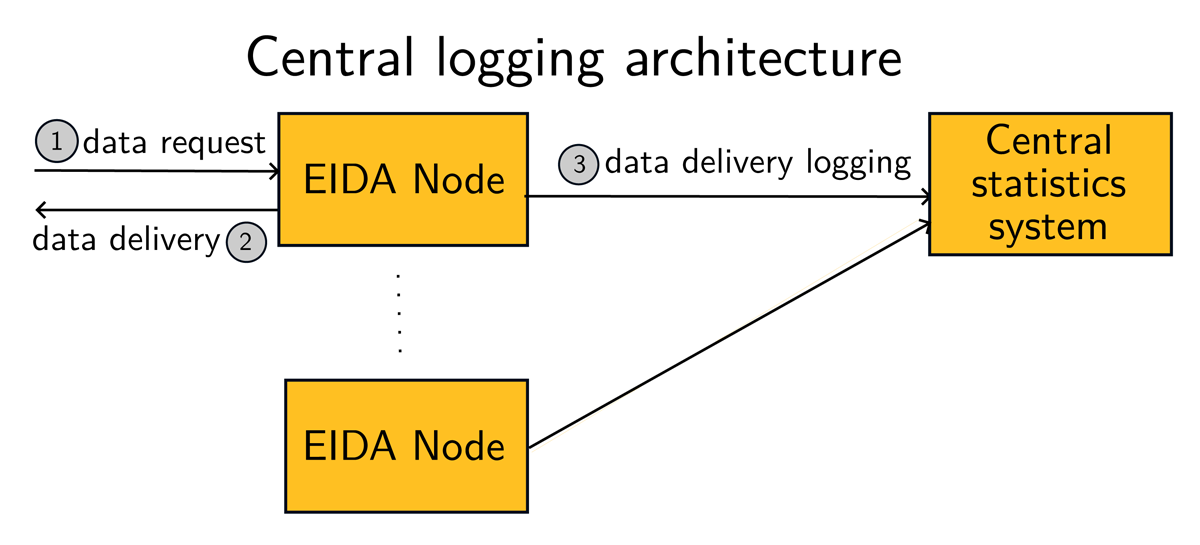
Figure 2
In a central logging architecture, each EIDA node, for each request, sends the information to the central system.
Today, major open-source solutions such as OpenSearch13 bring interesting features and capabilities for managing this amount of information, but this was not the case at the time of the conception of our architecture.
4.3.2 Distributed storage and exploitation of logging information
A fully distributed KPIs system would mean that each data centre would maintain an access endpoint for the end user (e.g., EIDA management, EIDA node managers and network managers) to fetch values, in a similar strategy to those of the metadata or data distribution web services. The main advantage is that each EIDA node can manage its logging system independently.
The main drawback is that it becomes costly to develop and maintain the tools that allow a user to obtain the indicator values interactively across all nodes and consolidate high-level information across all or a subset of nodes. A fully distributed system also requires continuous uptime across all EIDA nodes for the service to be effectively available to the user at all times. Such efforts can be made for priority services, such as metadata and data access for scientific users, but is unrealistic for a service which is not top priority for each EIDA node. The risk of failure of continuous service at any one of the EIDA nodes is therefore too high, considering the low priority that this service has in daily operations.
4.3.3 Distributed aggregation of logging information, centralised storage of aggregates
An intermediate approach is to make each data centre responsible for computing periodically some log statistics and ship the result to a central service, which can then publish aggregated values to the end users. The main advantages are:
Computing and storage are managed at each node (local hardware constraints respected);
Volume of shipped logging information remains small;
Periodic rather than continuous ingestion of EIDA node logging information (no need for continuous uptime of the service at all nodes and relaxed uptime constraints on the central node).
It remains possible in this semi-centralised system to clearly identify the responsibility of the individual EIDA nodes as well as of the central node that operates the EIDA-wide central system: Once the high-level logging aggregates are successfully shipped to the central system, the EIDA node can discard it, leaving the hosting responsibility to the central system. The semi-centralised system still leads to a straightforward software architecture across the whole federation, from logging collection to the final usage of the system. The workflow is illustrated in Figure 3, the aggregation process is described in more detail in Section 5.1.
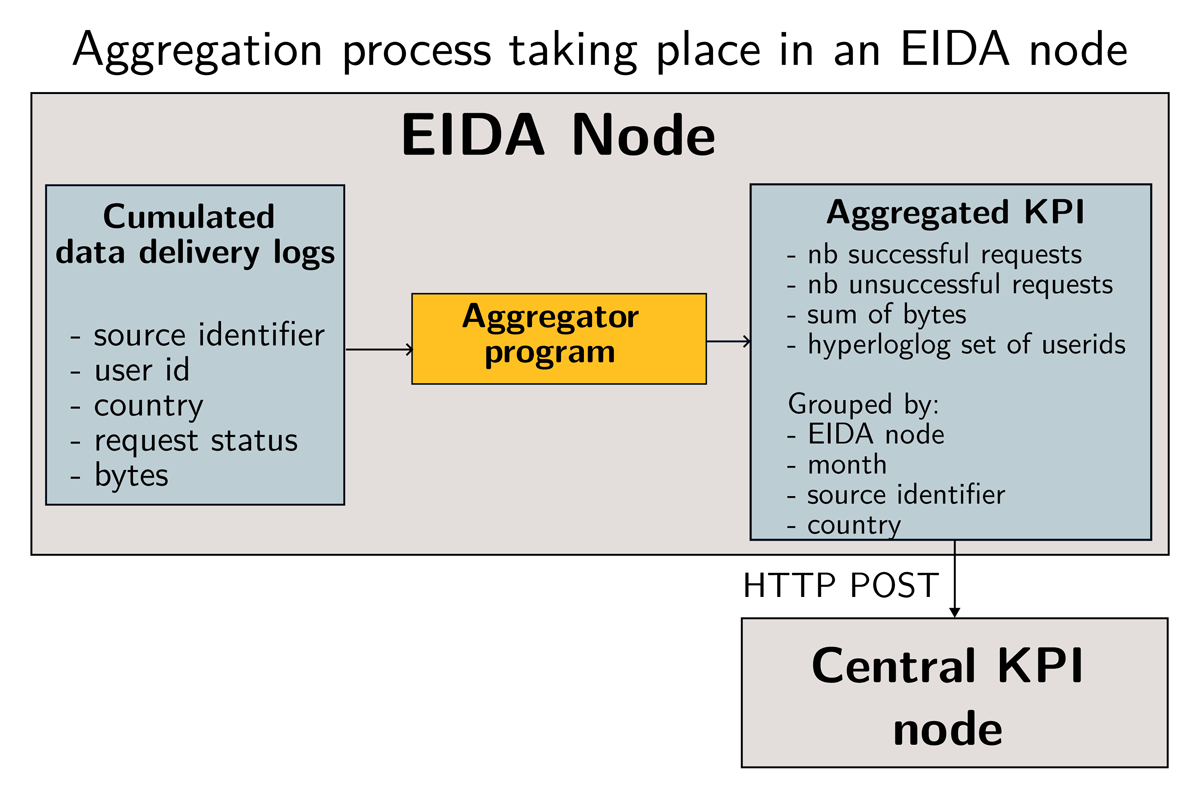
Figure 3
Workflow of building data usage indicators from initial logs. The Aggregator program transforms a set of data delivery events into aggregated values where a subset of individual values is grouped by month, source identifiers and country of origin of the requests. The Aggregator program adds the EIDA node as additional metadata. The aggregated logs are sent to the central service as a payload. The central KPI system ingests the payload by aggregating it to the existing values.
4.3.4 Final aggregation strategy choice
Given the previous analysis of the various options at hand, ETC implemented a semi-centralised system, that is, an architecture of local aggregation, with central storage for aggregates, as described in Section 4.3.3.
5 Technical Implementation of the KPI System
In this section, we present the final technical description of the system.
The ETC endorsed the use of Python as it is used in most shared EIDA software. There are already Python libraries available in order to manage all the specificities of the project, in particular a stable implementation of the HyperLogLog algorithm (Aquino et al., 2021). In order to implement the data model and store the values of the indicators, we chose PostgreSQL (PostgreSQL community, 2022) relational database. PostgreSQL is a well-known software within the community and the implementation of HyperLogLog is provided by an extension postgres-hll (CitusData, 2023).
5.1 Step 1: Local aggregation of data request logs
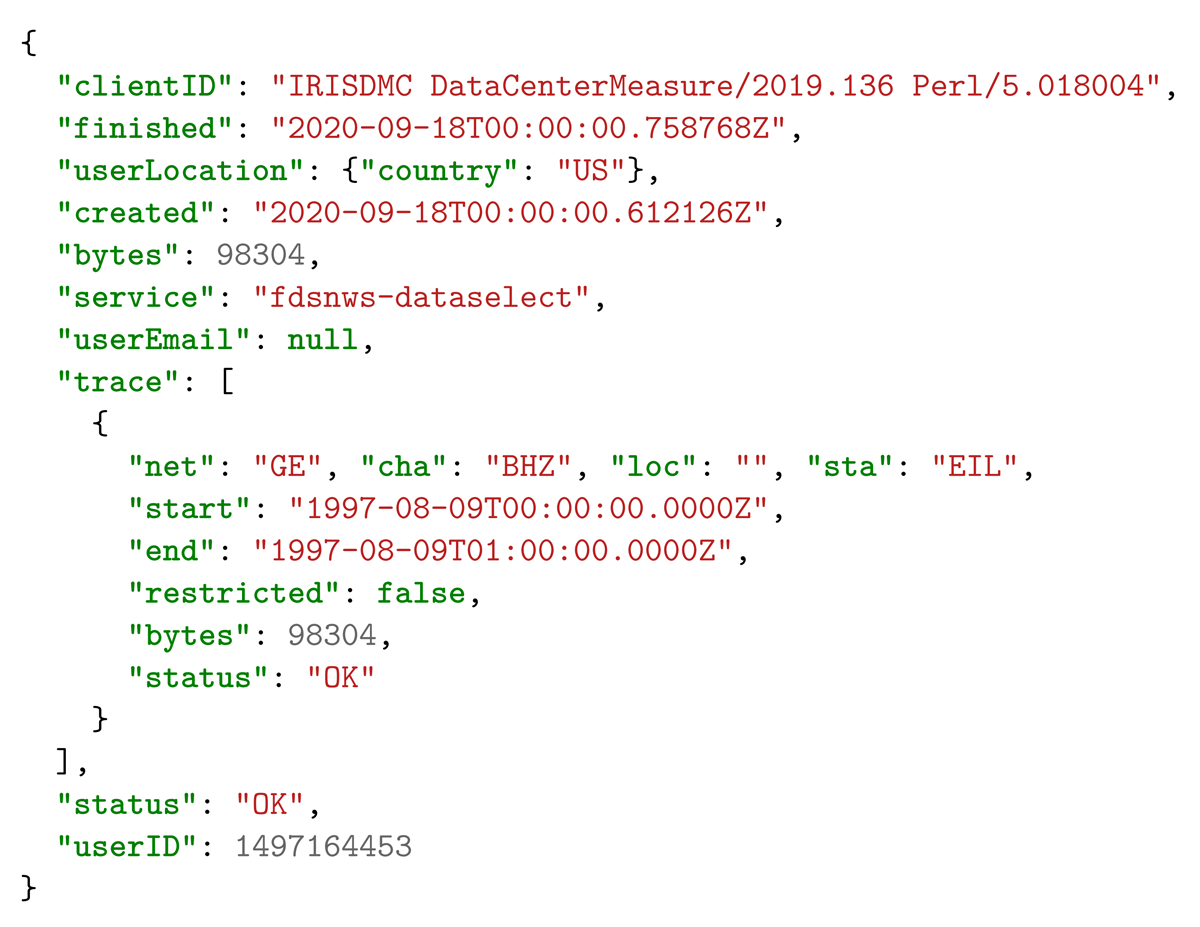
Each EIDA node produces an event log after each data request. This log contains information about the data delivered by the request, in a format that has been agreed on internally. Listing 1 illustrates with an example the information extracted for each data request.
Listing 1
Example of information available at an EIDA node after each data delivery.
clientId: The user agent as given by the client. This allows to identify the program used to fetch data. This field is not used by the system (see Section 4.2.3);
userLocation: The country where the request came from;
bytes: The number of bytes delivered;
trace: The source identifier of the data delivered (network, station, location, channel, start time, end time);
status: The outcome of the request;
finished: The time at which the request got fulfilled;
userID: A user identifier generated by a hashing algorithm. See Section 4.2.2 for details.
The logs are accumulated in a file which can be processed by the local Aggregator program (see Figure 3), provided by the project.
Values are aggregated with three parameters:
month: Date of the requests, truncated to the month as it is the time granularity specified for the project;
country: The country code (ISO 3166-1) where the request comes from, based on the IP address;
Source identifier: network, station, location, channel.
When parsing the logs, the program produces the following values:
successful requests: the sum of requests returning data;
unsuccessful requests: the sum of requests that did not return any data. This happens when a request is correctly specified but does not match any data.
unique clients: the number of unique clients. This is an HyperLogLog set of the userID parameters;
size: the sum of bytes distributed.
The aggregator also adds some metadata to its output (see example in Listing 2). At this stage, the EIDA node is ready to ship the values to the central KPI system. The overall workflow is illustrated in Figure 3. The aggregator was developed in the framework of the internal EIDA project eida-statistics (Schaeffer and Petrakopoulos, 2024).
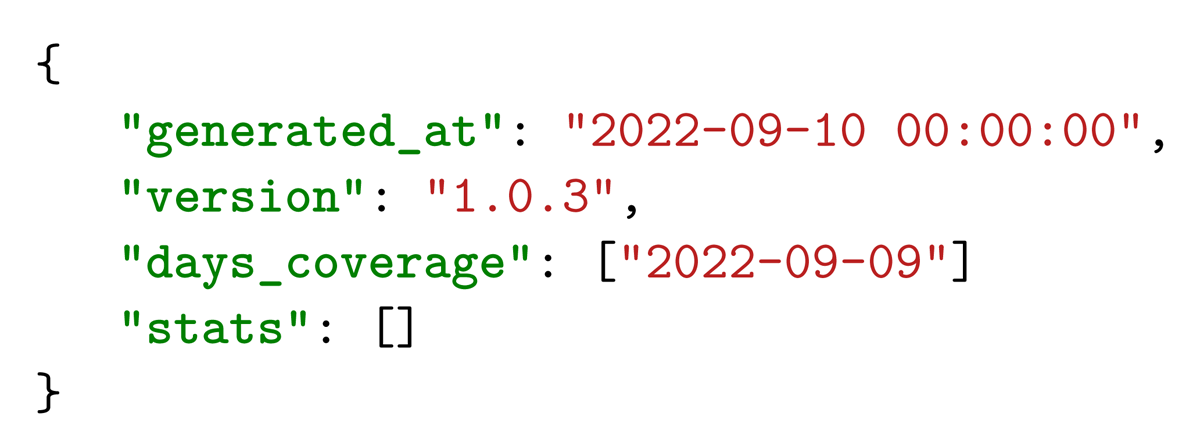
Listing 2
Metadata provided by each EIDA node in the JSON format.
5.2 Step 2: Shipping aggregates to the central KPI service
As all EIDA nodes do not rely on the same implementation in order to serve the fdsnws-dataselect web service, the strategy consisted of defining the interaction between the EIDA nodes and the central system. Each EIDA node is responsible for providing the logging aggregates in a given format through an agreed protocol. For the latter, HTTP was chosen because it is well-suited and well-known by the community. The ETC approved to ship the data from each EIDA node as a JSON file, optionally compressed using gzip. The aggregated JSON file contains a list of indicator values along with some metadata that are useful for the central system to store them: the version of the aggregator program and the list of days covered by the indicators. An example of this metadata is provided in Listing 2.
5.3 Step 3: Ingesting aggregates
The central database stores the data shipped by the nodes. The data model in the central database is tightly linked to the data structure that the aggregator program provides, illustrated in Figure 4. The ingestion mechanism can be decomposed into three steps:
Before its first submission, each EIDA node was provided with an authentication token from the central database operator, with which it can submit a payload (the output of the aggregator program).
On the server side, the token used in the submission request allows to identify the EIDA node. Commonly, nodes push their usage aggregates on a daily or weekly basis. All payloads are aggregated again by month, source identifiers and EIDA node.
A hash of the payload is computed and kept in the database in order to avoid ingesting twice the same payload. This is a simple approach guarding against duplication errors on the EIDA node side and is efficient in our context where all the EIDA nodes are part of a trusted group.
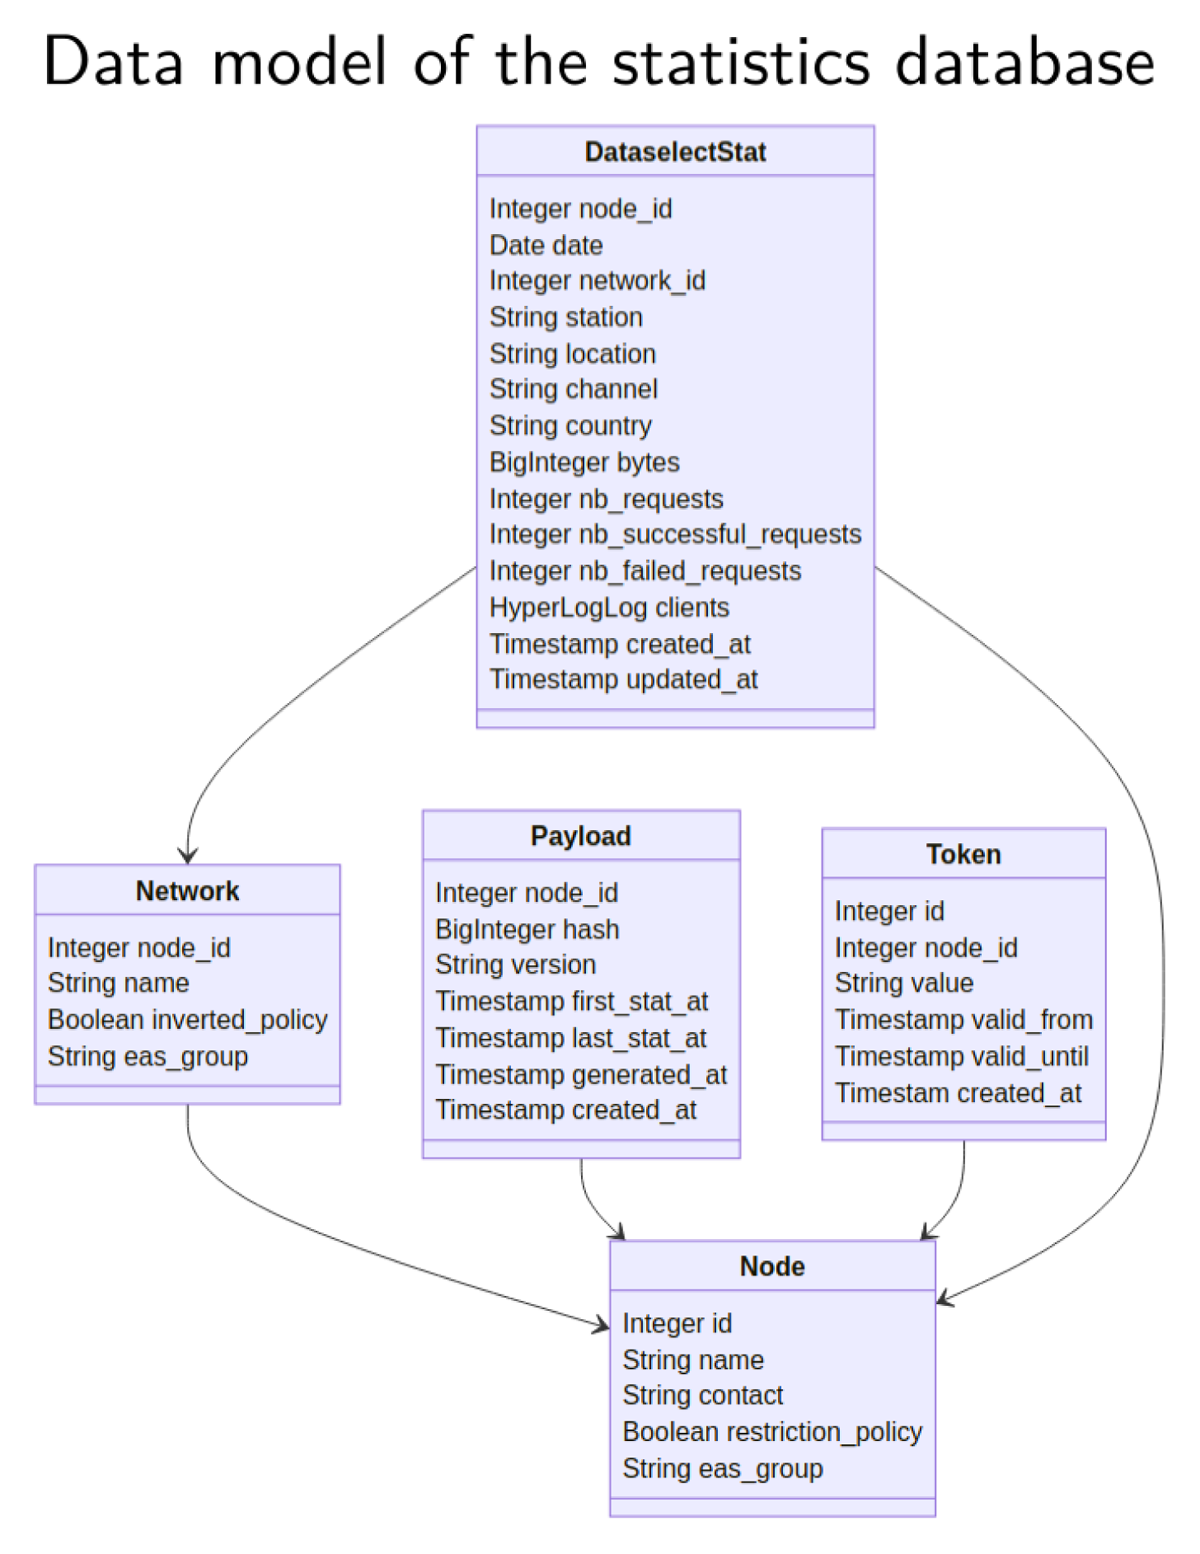
Figure 4
Data model of the KPI database.
The project eida-statistics (Schaeffer and Petrakopoulos, 2024) contains the database back end and a web service to ingest payloads. The web service specifications are publicly available and documented.14
5.4 Aggregates coverage in the central database
In order to provide trustworthy values, it is important to ensure that a representative amount of numbers have been collected to the central database. The coverage of a node is the percentage of days having KPI values over a time period. This metric is built and stored in the central database during the ingestion process, on a daily granularity.
The central database operator and all participants can access the coverage score of the nodes through a private dashboard web interface powered by Grafana (GrafanaLabs, 2022) and hosted at the Observatoire des Sciendes de l’Univers of Grenoble (Observatoire des Sciences de l’Univers de Grenoble, 1985). It is in practice a handy tool to identify problems between the nodes and the central database. Figure 5 illustrates a view of the KPI coverage for several months for some of the EIDA nodes. This view shows how a node’s operator or the EMB can have a quick and efficient estimate of the completeness of the indicators.
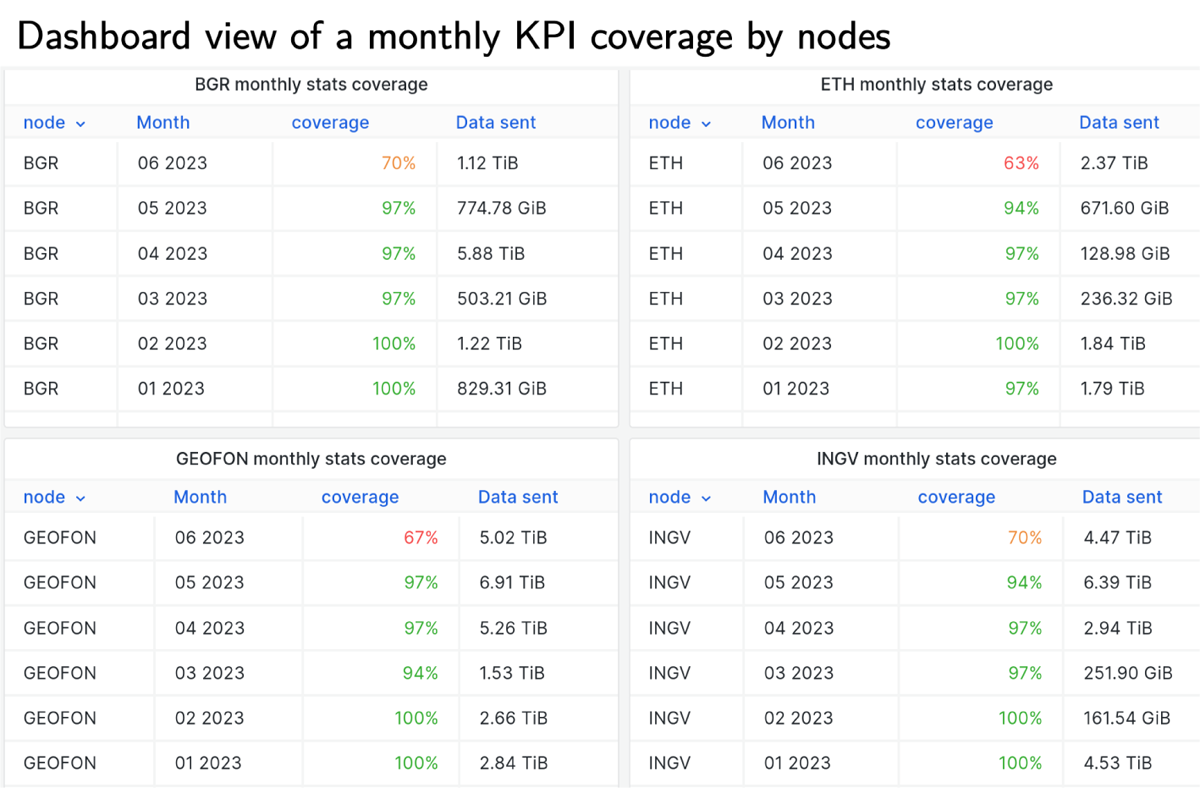
Figure 5
Example of a view for EIDA node operators, presenting monthly KPI coverage for four of the 12 EIDA nodes in June 2023. The coverage for June is not complete because it is the ongoing month.
5.5 Managing indicator access restrictions
Due to the requirement of the project, restricted access to indicators had to be implemented for specific seismic networks, as stated in Section 3.1.5. Authentication relies on the EIDA authentication system15 which is commonly used in the community. Authorisation management is based on B2Access groups.16 In the EIDA KPI database, each network has a restriction policy and the name of the B2Access group authorised to access the values. With this technical choice, the project avoids to manage individual accounts and associated GDPR issues.
5.6 Accessing the indicators values
The project provides an API to request KPI values in a form that facilitates a client-side exploration interface.
This API can be used directly for creating customized plots. We provide some examples to illustrate the possibilities in Figures 6 and 7. Figure 8 shows data delivery for AlpArray across EIDA nodes, generated with a simple Python script (see Listing 3). For the plots in Figure 6, we also provide sources.17
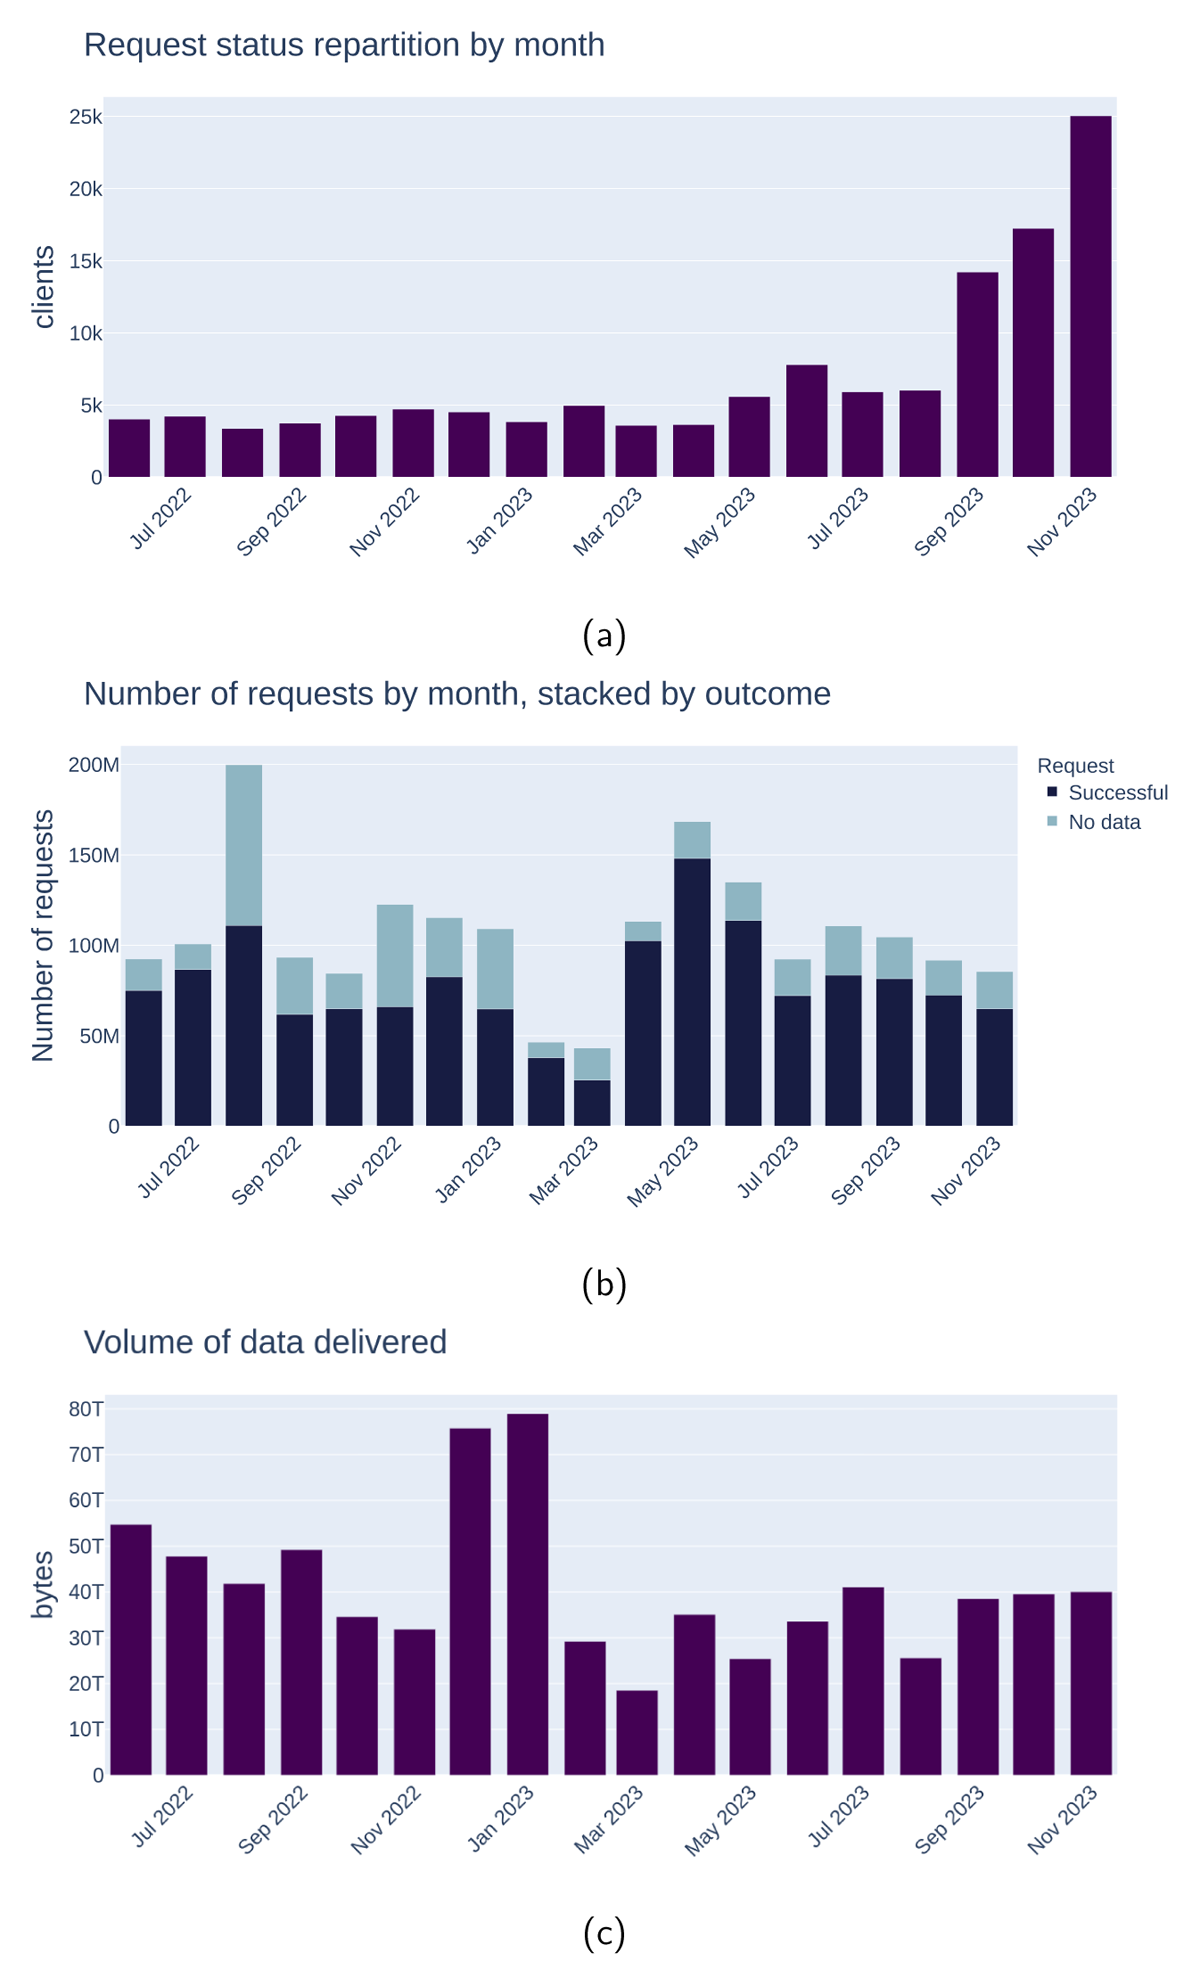
Figure 6
Examples of figures generated programmatically using the web API, illustrating three monthly KPIs across EIDA between June 2022 and November 2023. (a) shows unique users, (b) shows data requests (successful and unsuccessful) and (c) shows the volumes of data delivered.
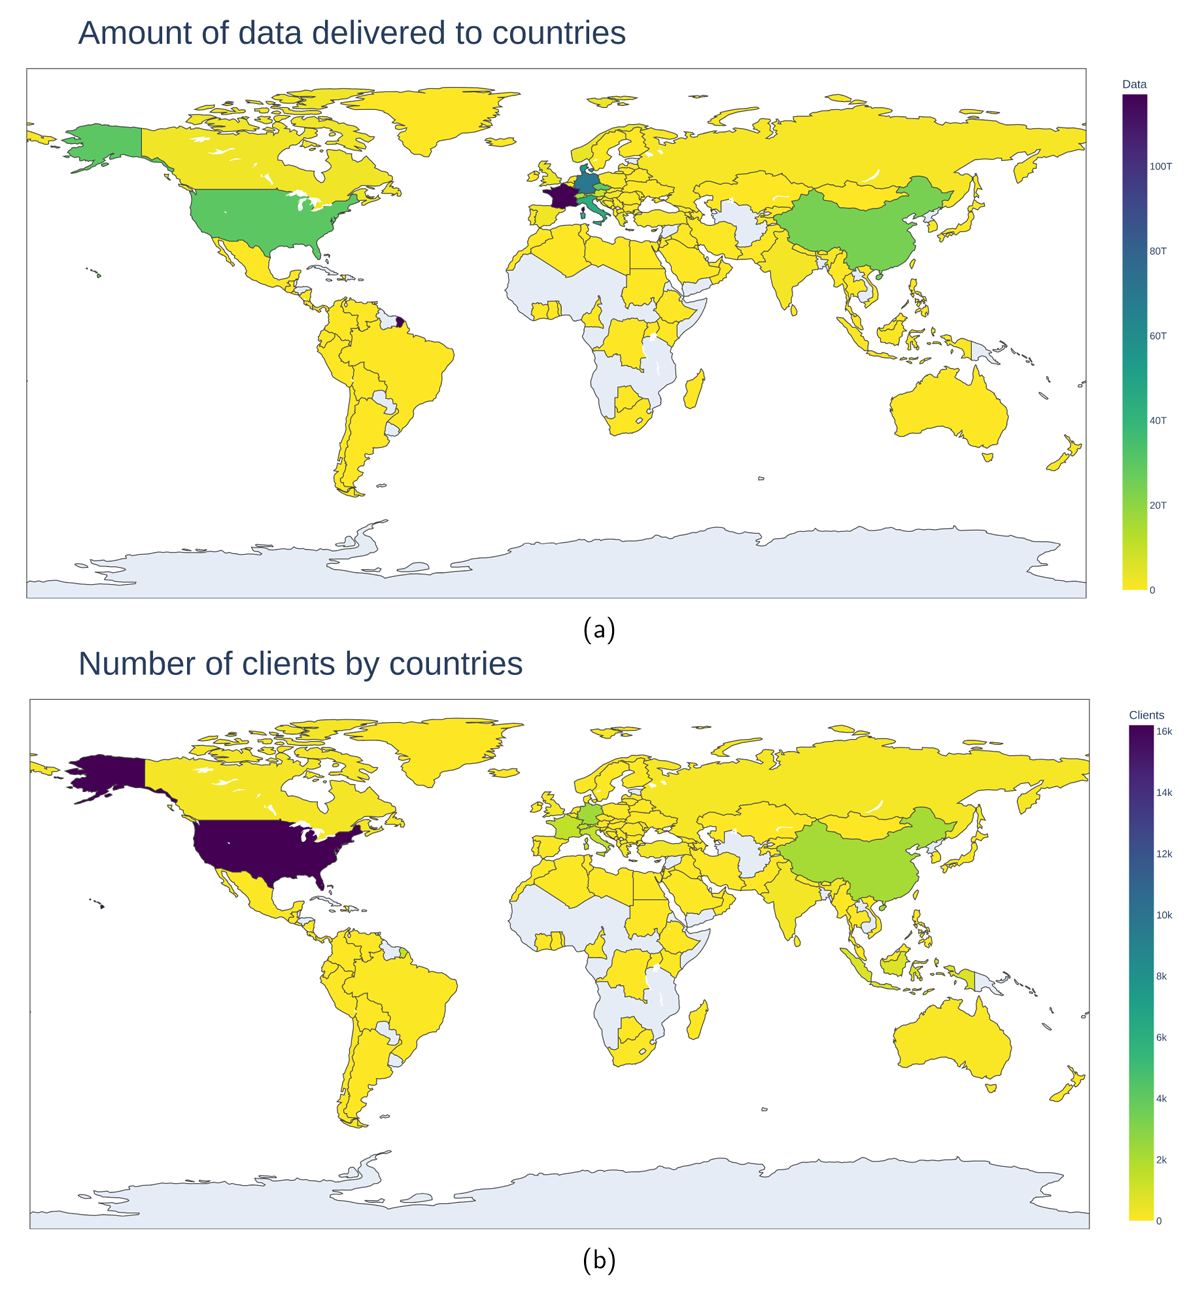
Figure 7
Figures showing worldwide repartition of some KPIs in 2022. (a) is the volume of distributed data and (b) is the number of clients. Similar figures can be produced via the API, for example, using the code snippet at https://gitlab.com/-/snippets/2529969.
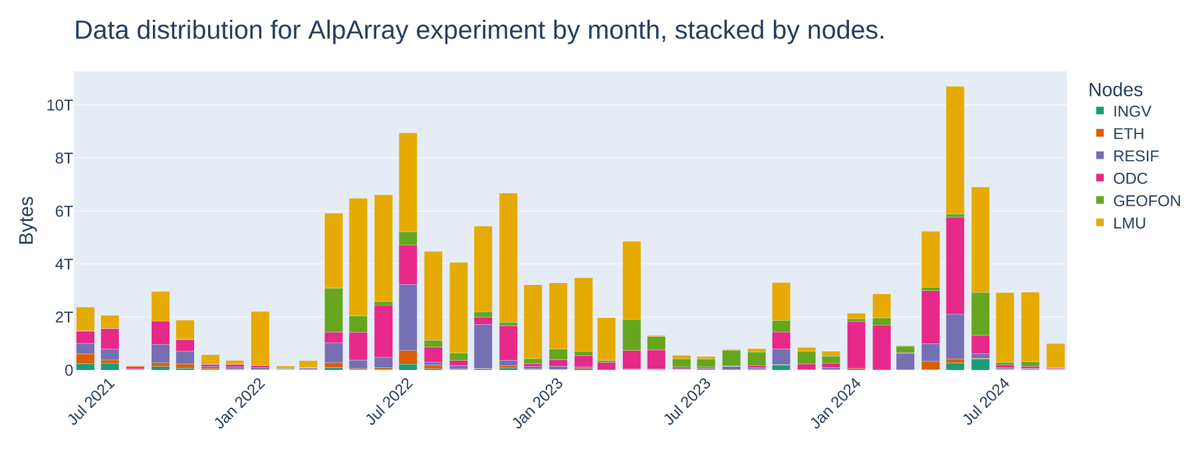
Figure 8
Cumulated data delivery for AlpArray across EIDA nodes using EIDA’s statistics web service. AlpArray data is distributed across 6 EIDA nodes. Figure produced by the code in Listing 3 using the statistics API.
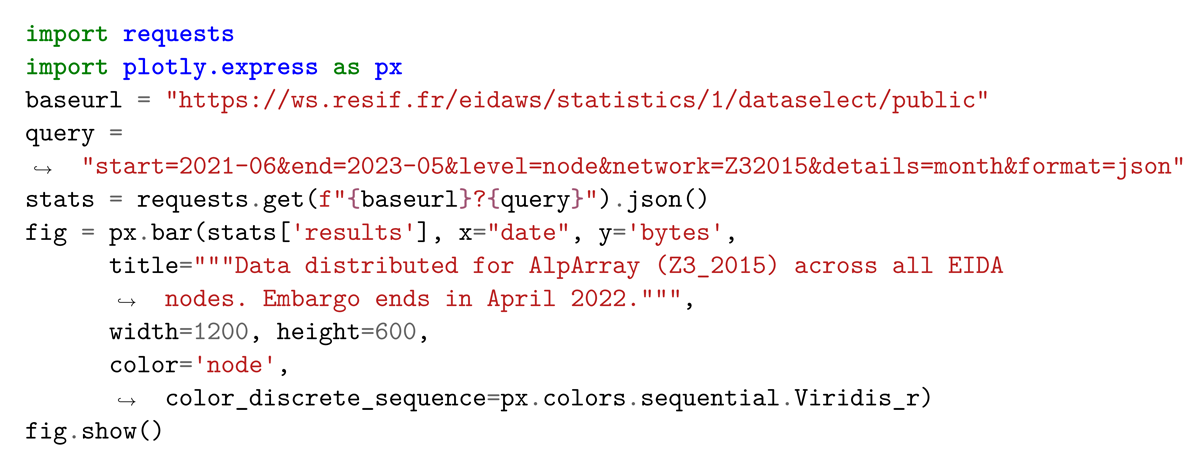
Listing 3
Example program producing Figure 8 using the Plotly library (Plotly, 2023), Code available as a snippet at https://gitlab.com/-/snippets/2530688.
Finally, EIDA developed a graphical dashboard (Petrakopoulos and Schaeffer, 2024) using the API. This web user interface exposes the parameters to request the statistics API and generates figures. The dashboard is now available for public consultation on the ORFEUS portal.18 Figure 9 shows some screenshots of the dashboard.
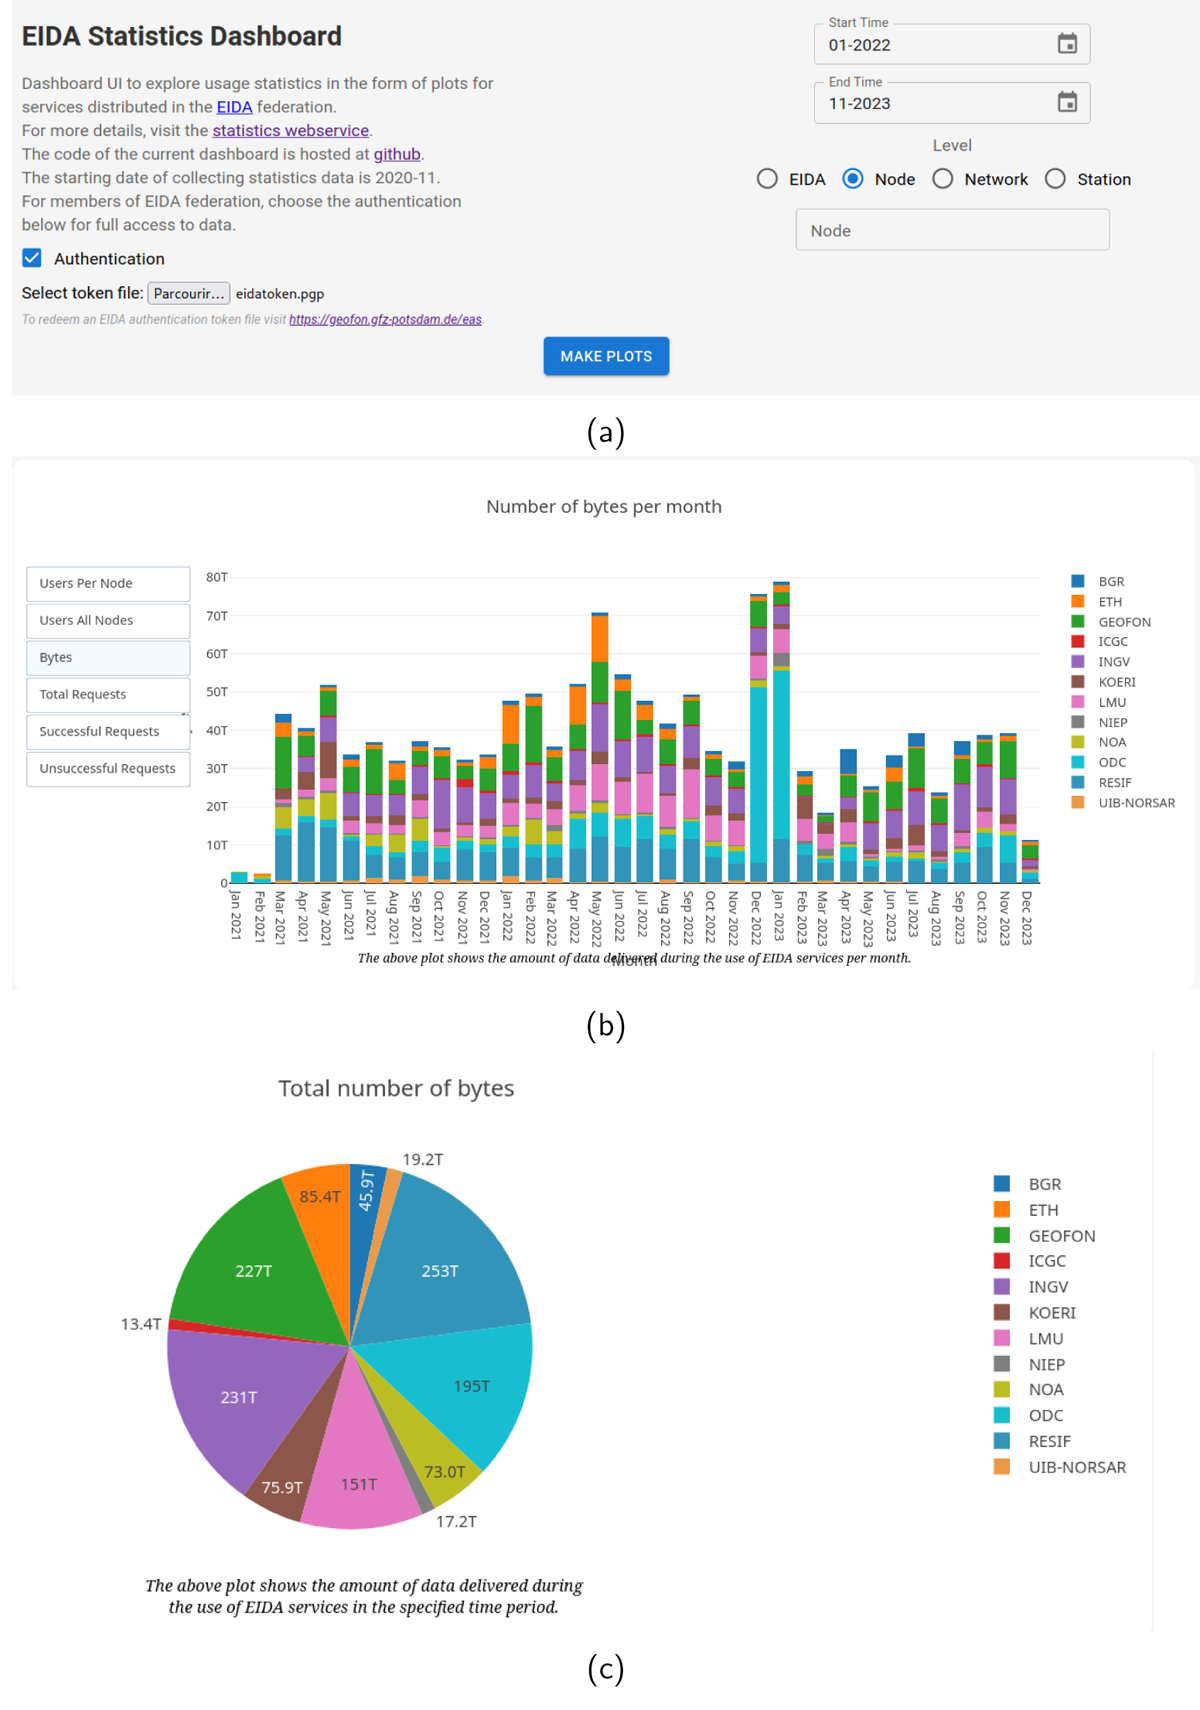
Figure 9
Screenshots of the dashboard. (a) is a view where the user can select time spans, level of visualisation and narrow down to node or networks. It is also possible to provide a token in order to be authenticated and access indicators for networks with restricted KPI access. (b) is a screenshot of one of the possible graphical visualisations provided by the web interface. (c) is a screenshot of another possible visualisation (pie chart).
Both the dashboard and backend API are developed in a tight collaboration between the development team and representatives of the different target user groups (see Section 3.1).
6 Resource Requirements
The central database is (as of December 2023) 1.2 GB for 6.5 million entries, growing around 300 MB per year. It ingests a mean of 200,000 new entries per month, accounting for 100 million data requests per month. The aggregation process reduces the database size by 500 as compared to storing all local logs in a central database.
Maintaining the central system is a lightweight task, below the threshold of time accounting.
The amount of work for the development has been evaluated at one month of development for one full-time equivalent. The developer’s tasks are to:
Make a data model for the central statistics database;
Develop a web service to ingest the aggregates into the database;
Develop the aggregator program to be deployed at all EIDA nodes;
Write a web interface to give access to the indicators.
The overall ingestion and data management system needs a small amount of code (approximately 700 lines of Python code), due to an efficient use of existing open-source libraries and tools. The code base for the web service is slightly larger. It is designed as a full-featured backend for interactive user interfaces. The API has been designed using the OpenAPI standard and is not likely to evolve. Therefore, the maintenance of this software is lightweight.
7 Lessons Learnt
After 2 years of exploitation in a production environment of the logs centralisation, we are able to draw up an assessment of our federated statistics system.
The overall quality of the centralised indicators strongly depends on the coverage of aggregated values from each EIDA node (see Section 5.4). If an EIDA node fails to send the aggregates for some time, the centralised result becomes less accurate. EIDA therefore decided to monitor the ingestion operations at the central node. The coverage level is checked by the central service managers and by the nodes operator in order to make sure that the statistics are correctly covered. Until now, the coverage rate meets the need for meaningful indicators, around 98%. In case of problems, the EIDA node operators have been able to resubmit their aggregates and fill the gaps. The key to this good coverage rate is:
A simple and robust architecture and implementation of the aggregation system;
A simple way to ship the aggregated data;
A simple way to deploy and upgrade the aggregator program on every node;
A simple way for node operators to check their coverage;
The possibility for all node operators to send data from the past, in order to recover missing time windows.
In case of the necessity to upgrade the aggregator program, all the EIDA nodes need to be coordinated. In practice, the central system stores the operator contacts for each EIDA node in order to ease the coordination process. Coordination has proven to be as efficient as the least responsive EIDA node, therefore, we promote within the ETC that the operators of each EIDA node need to realise the upgrade process rapidly. Furthermore, changes and updates need to be designed with a transition period in mind, as software updates and migrations do not take place simultaneously at all EIDA nodes, but rather roll out some period of time which is dependent on, for example, local workload and staff availability.
None of those difficulties has so far been an issue to keep the system operational, possibly due to the long experience of the EIDA nodes concerning robust operational environments to ensure high uptime.
For interested readers, we refer to Supplementary Material 2 which states a set of steps to implement a similar system in other contexts.
8 Conclusions
The need to provide KPIs for institutions is increasing and public research infrastructures like ORFEUS and its associated data centres rely on indicators showing that the data is helpful to a large community. In order to respond to this need, EIDA has chosen to implement a system which can provide both high-level insight and more detailed data usage indicators.
At this stage, EIDA is now able to provide uniform key indicators for institutions and network managers as initially required, and overcome the difficulties of consistently collecting indicator values across a medium-sized distributed system.
The EIDA statistics system will support EPOS, ORFEUS, EIDA, the EIDA nodes and the data providers through information on data download usage, in an easily accessible and reproducible manner. Furthermore, by carefully specifying the questions, the users and the granularity levels, the resulting system is simple, efficient, robust and easy to manage all whilst respecting the initial requirements.
Among the short-term outcomes of this project is that a similar system for all EIDA wide web services seems feasible, initially for the fdsnws-station that delivers seismic metadata.
Both EIDA node managers and station operators can benefit from the new system. For example, EIDA nodes can now easily obtain, visualise and share KPIs for data usage both at data centre level and with each of the network operators, consistent with the recommendations of the Research Data Alliance working group on data usage metrics (Lowenberg, Jouneau and Bruno, 2021).
Also, central statistics is the only system able to report on data usage for seismic networks hosted across several data centres such as, for example, the AlpArray (AlpArray Seismic Network, 2015) or AdriaArray (Meier and Kolinsky, 2023) experiments.
It may provide a practical model for EPOS, and for other large data distribution systems which are federated across many individual data centres.
In the medium term, the project plans to evaluate the COUNTER Code of Practice (COUNTER, 2023) in order to provide yearly reports as a service in a standard way.
Data Accessibility Statement
The project is built on several software components, all of them distributed under the GPLv3 free software license.
Logs aggregator: Computation of the local logs aggregates (Schaeffer and Petrakopoulos, 2024).19
Statistics Web API: The web service to ingest aggregates and access metrics (Schaeffer and Petrakopoulos, 2024).
Statistics board: Graphical user interface for making graphs with the metrics exposed by the web API (Petrakopoulos and Schaeffer, 2024).
Graphics generation: Code snippets to generate the graphics from this article.20
Team List
This work has been possible with the contribution of the EIDA Technical Committee and EIDA Management Board. The list of members is published online (https://www.orfeus-eu.org/data/eida/structure/).
Additional Files
The additional files for this article can be found as follows:
Supplementary material 1
Feature matrix of EIDA’s KPI system. DOI: https://doi.org/10.5334/dsj-2024-048.s1
Supplementary material 2
Guidance to build a KPI system suitable for distributed research infrastructures. DOI: https://doi.org/10.5334/dsj-2024-048.s2
Notes
[1] ORFEUS: http://orfeus-eu.org.
[2] EPOS: https://www.epos-eu.org.
[3] List of EIDA nodes http://www.orfeus-eu.org/data/eida/nodes/.
[4] FDSN https://www.fdsn.org.
[5] ESFRI road map 2021: https://roadmap2021.esfri.eu/.
[6] Geo-INQUIRE: https://www.geo-inquire.eu, WP7.
[8] GDPR details: https://eur-lex.europa.eu/legal-content/EN/TXT/PDF/?uri=CELEX:32016R0679.
[9] Hash function definition: https://en.wikipedia.org/wiki/Hash_function.
[10] Definition of a one-way function: https://en.wikipedia.org/wiki/One-way_function.
[11] Example of the implementation of user ID hash in seiscomp’s source code https://github.com/seiscomp/main/blob/3c11014d49dbefd29ccaa436647cb1aa0727482f/apps/fdsnws/fdsnws/reqlog.py#l36.
[12] Definition of the count-distinct problem https://en.wikipedia.org/wiki/Count-distinct_problem.
[13] OpenSearch: https://opensearch.org.
[14] See the POST/eidaws/statistics/1/submit at https://ws.resif.fr/eidaws/statistics/1.
[15] EAS: https://geofon.gfz-potsdam.de/eas/.
[16] B2Access:https://eudat.eu/catalogue/b2access.
[17] The source code for generating graphics by using the statistics API is provided as an orgmode file at https://gitlab.com/resif/publications/eida-kpi/-/blob/31258bb03b831473fe520bac709cfcc1c4b2dda3/libs/dashboard.org.
[18] Statistics board on the ORFEUS portal https://orfeus-eu.org/data/eida/stats/.
[19] Direct access to the aggregator code: https://github.com/EIDA/eida-statistics/tree/main/aggregator.
[20] Orgmode file to generate the figures using Python scripts https://gitlab.com/resif/publications/eida-kpi/-/blob/31258bb03b831473fe520bac709cfcc1c4b2dda3/libs/dashboard.org.
Acknowledgements
The authors are thankful to the organisations and personnel that operate seismic networks in Europe and across the world and who share their data openly for science. EIDA also thanks the community of scientific users who use the data from EIDA, and who provide feedback to the EIDA nodes and to the EIDA system as a whole. EIDA services are integrated into and supported by the European Plate Observing System (EPOS). Jonathan Schaeffer and Helle Pedersen are personnel of the Epos-France EIDA node which is part of the national research infrastructure Epos-France. This work has been supported by a grant from Labex OSUG (Investissements d’avenir – ANR10 LABX56). We thank two anonymous reviewers for their constructive comments.
Funding Information
EIDA development and consolidation have been supported through various EC-funded projects, namely: NERIES, NERA, ENVRI, VERCE, EPOS-PP/IP/SP, EUDAT, SERA and RISE.
The present work was partly supported by Geo-INQUIRE, funded by the European Commission under project number 101058518 within the HORIZON-INFRA-2021-SERV-01 call.
Competing Interests
The authors have no competing interests to declare.
Authors Contributions
Christos Evangelidis, Angelo Strollo, Jarek Bienkowski and Javier Quinteros contributed by closely following the implementation phase giving valuable inputs for the final tool to comply with the end users’ needs.
The EIDA Management Board contributed by submitting all the requirements of the initial project, provide funding sources and follow-up on the progress.
The EIDA Technical Committee contributed by deploying and operating the necessary tools on each EIDA node.
Jonathan Schaeffer was the technical manager of the project.
Vasilis Petrakopoulos wrote and tested the software.
Jonathan Schaeffer and Helle Pedersen wrote the article.