
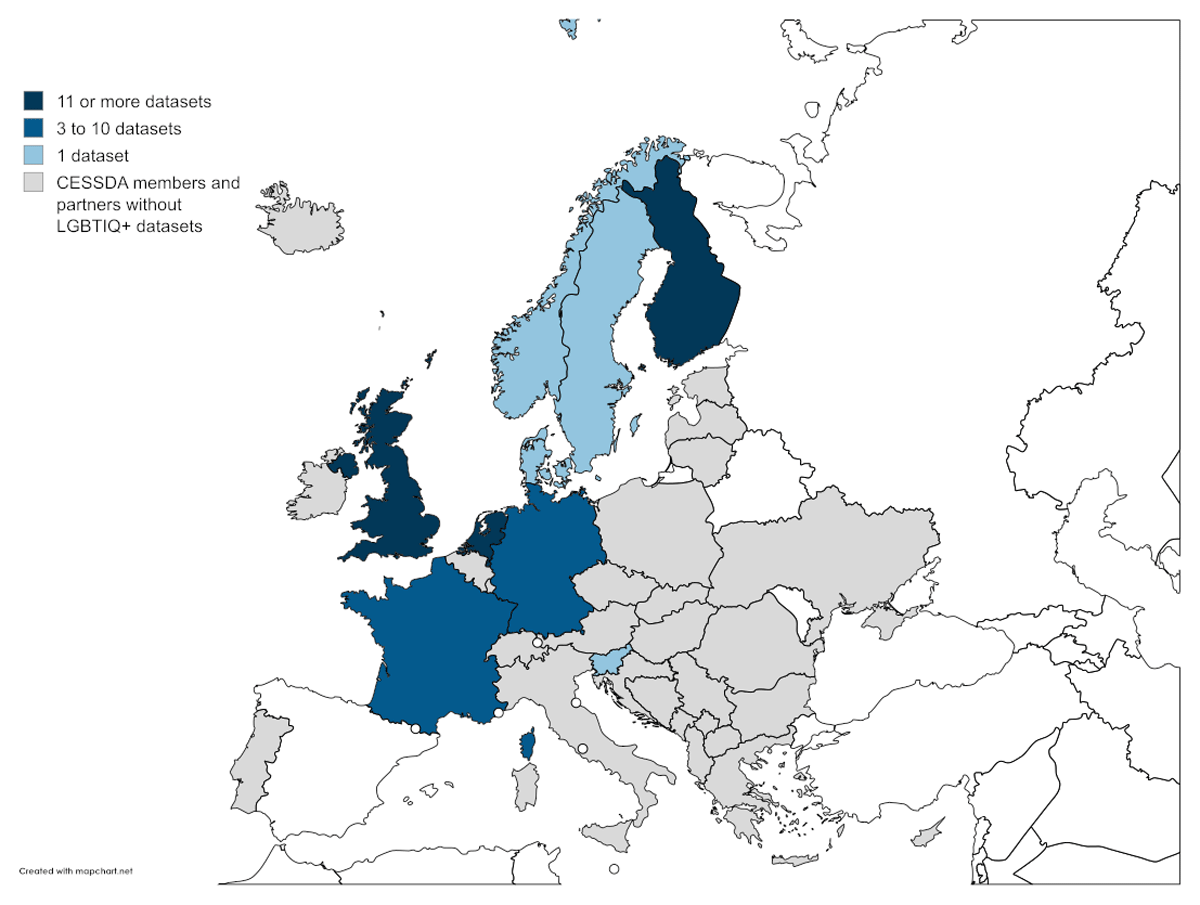
Figure 1
CESSDA member countries and partners and the number of LGBTIQ+ datasets in stock. N = 66 datasets. Map created with MapChart.net (CC BY-SA 4.0).
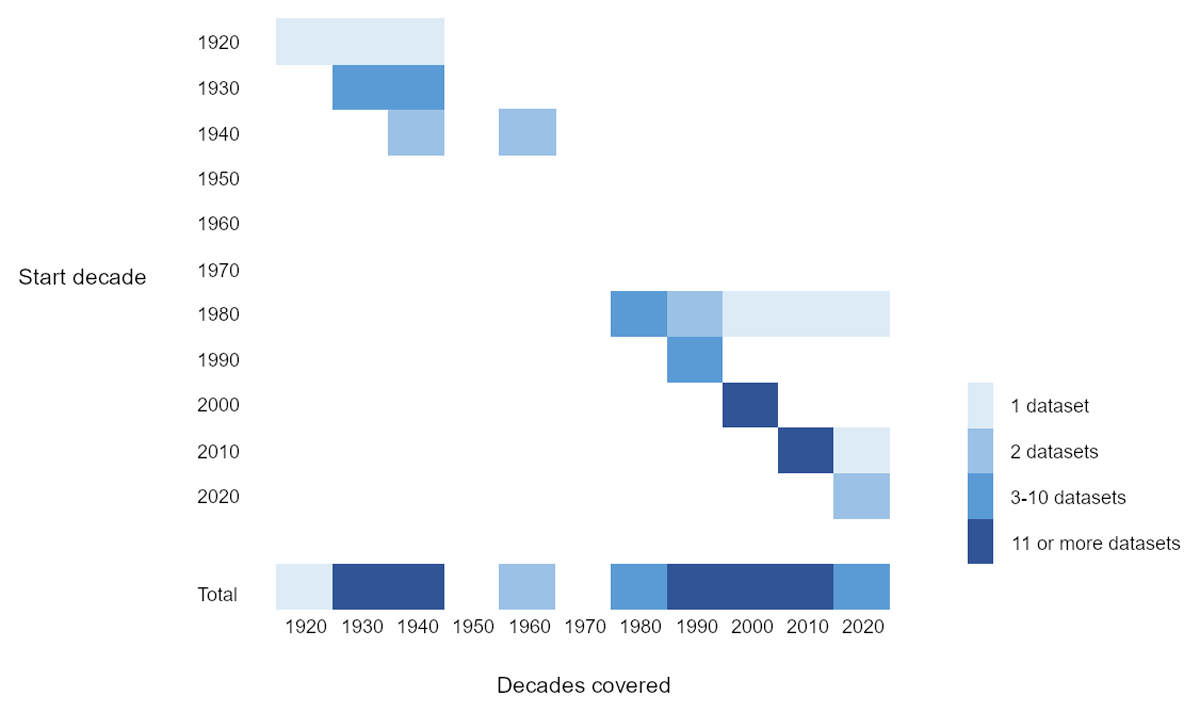
Figure 2
Temporal coverage of LGBTIQ+ datasets in European data archives. N = 66 datasets. Datasets ordered by start decade. Length of the bar represents decades covered by the datasets. Total bar displays the number of datasets covering a decade, irrespective of start decade.
Table 1
Start decade of temporal coverage and publication decade of LGBTIQ+ datasets in European data archives.
| PUBLICATION DECADE | ||||||
|---|---|---|---|---|---|---|
| 1990 | 2000 | 2010 | 2020 | TOTAL | ||
| Start decade | 1920 | – | 1 | – | – | 1 |
| 1930 | 1 | 9 | – | – | 10 | |
| 1940 | – | 2 | – | – | 2 | |
| 1980 | 1 | 2 | 1 | 4 | 8 | |
| 1990 | 3 | – | – | 6 | 9 | |
| 2000 | – | 8 | 8 | 1 | 17 | |
| 2010 | – | – | 12 | 5 | 17 | |
| 2020 | – | – | – | 2 | 2 | |
| Total | 5 | 22 | 21 | 18 | 66 | |
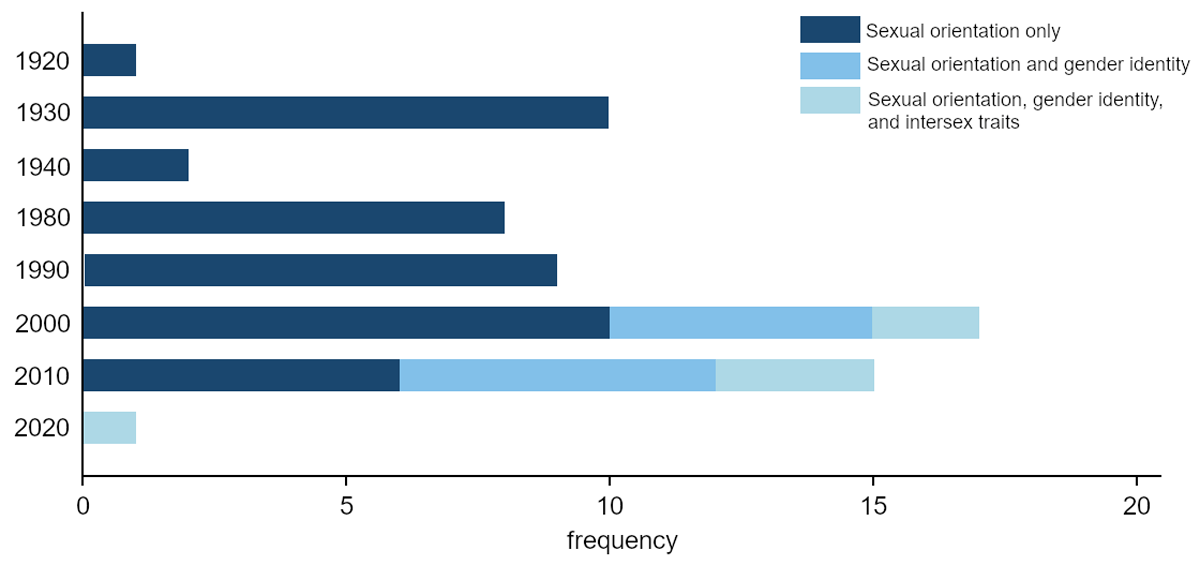
Figure 3
Samples covered by European LGBTIQ+ datasets by start decade. N = 63 datasets.
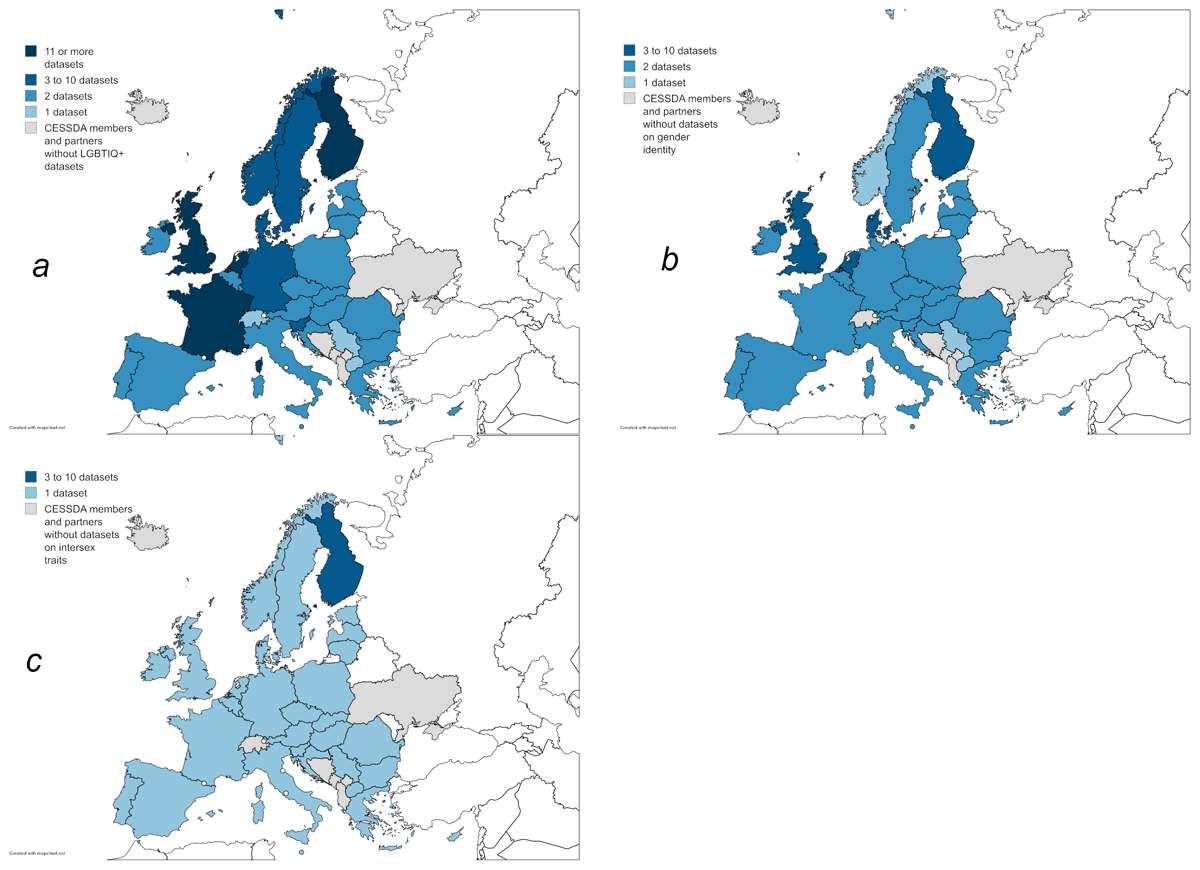
Figure 4
Countries in Europe covered by datasets that include information on (a) sexual orientation, (b) gender identity, and (c) presence of intersex traits in European data archives and the number of datasets covering each country. N = 65 datasets in (a) and (b), 63 datasets in (c). Map created with MapChart.net (CC BY-SA 4.0).
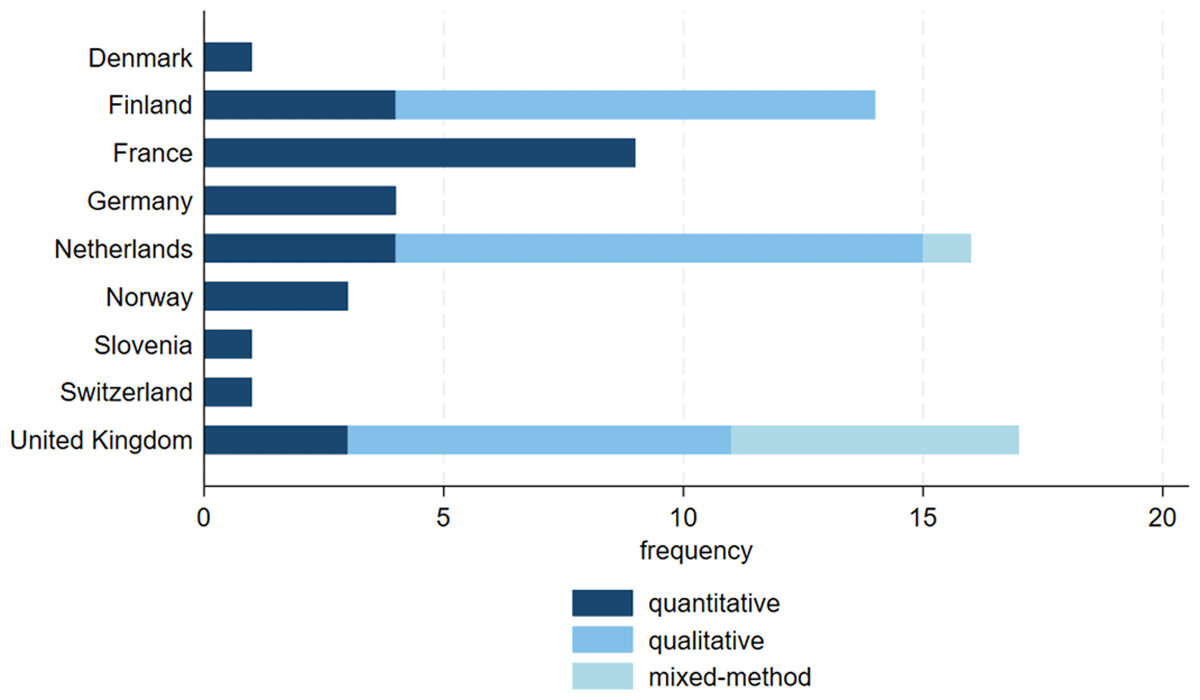
Figure 5
Countries with European LGBTIQ+ datasets by data collection method. N = 66 datasets.
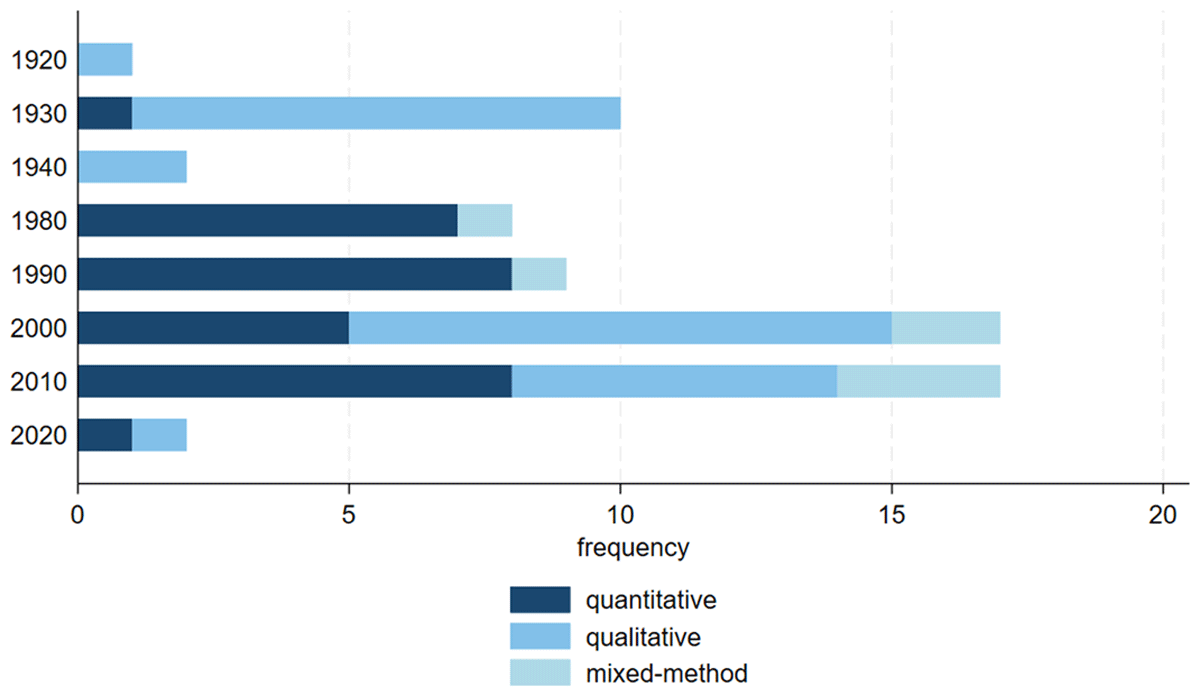
Figure 6
Start decade of European LGBTIQ+ datasets by data collection method. N = 66 datasets.
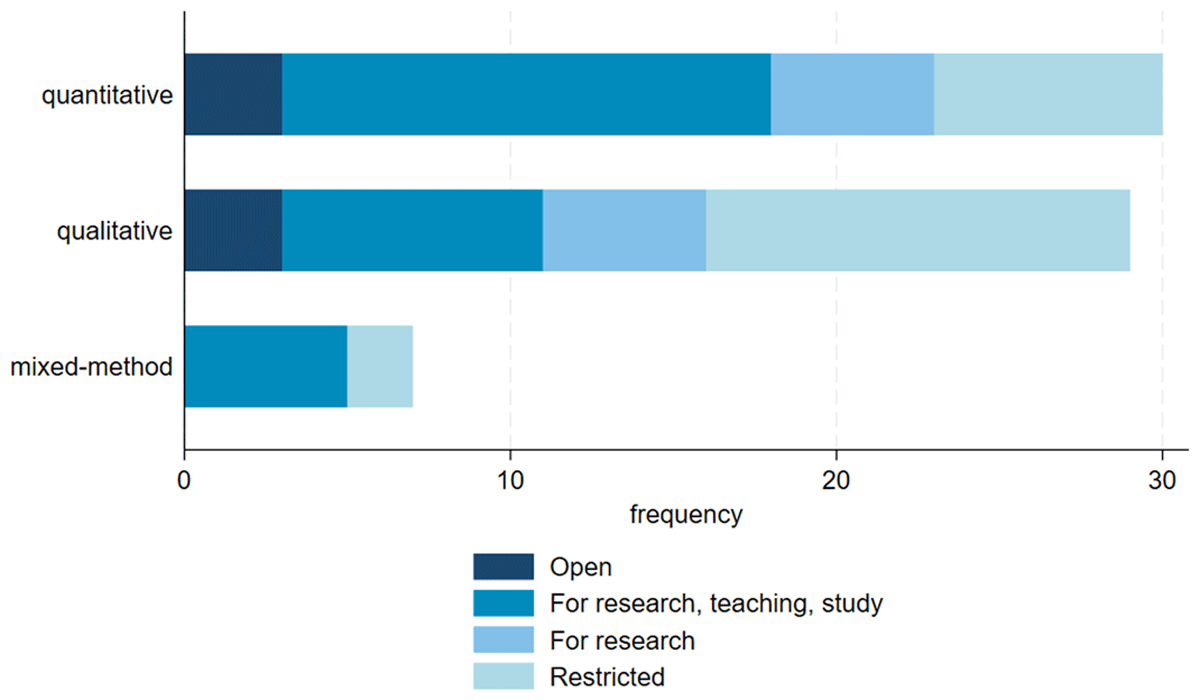
Figure 7
Data collection methods of European LGBTIQ+ datasets by dataset accessibility. N = 66 datasets.
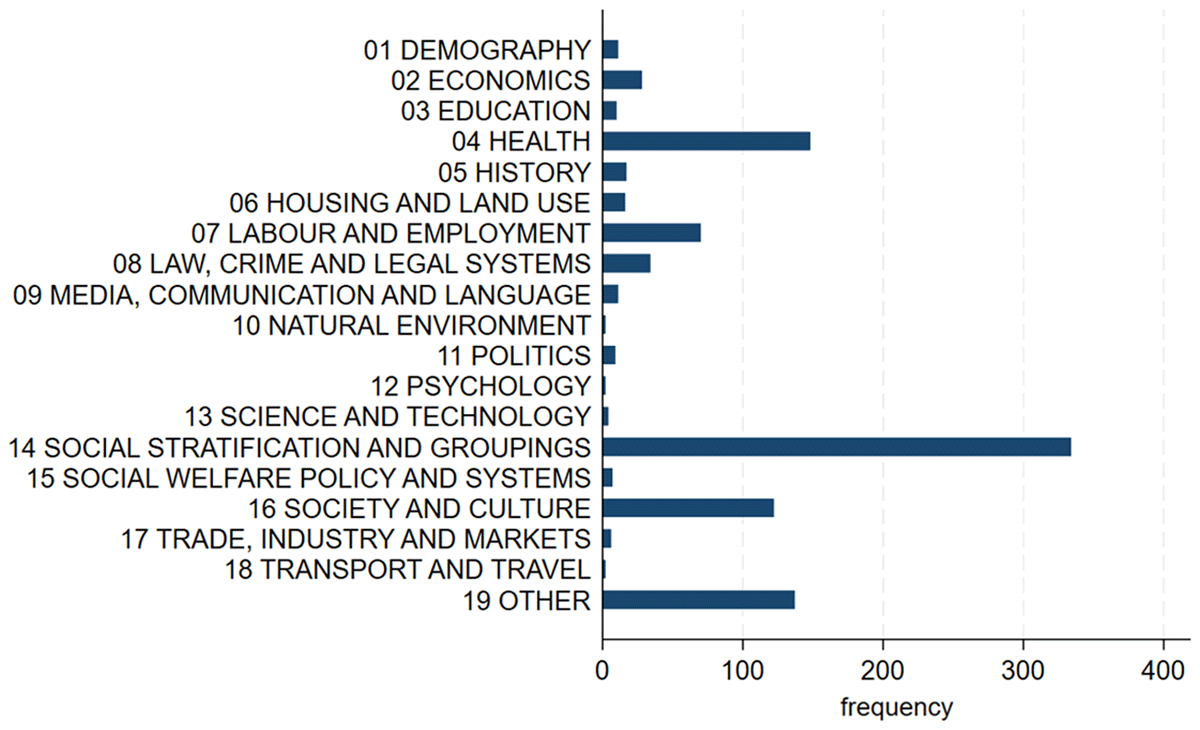
Figure 8
Topics covered by 65 LGBTIQ+ studies on the top level of the CESSDA Topic Classification 4.2.2 (English). Derived by classifying study keywords, N = 970.
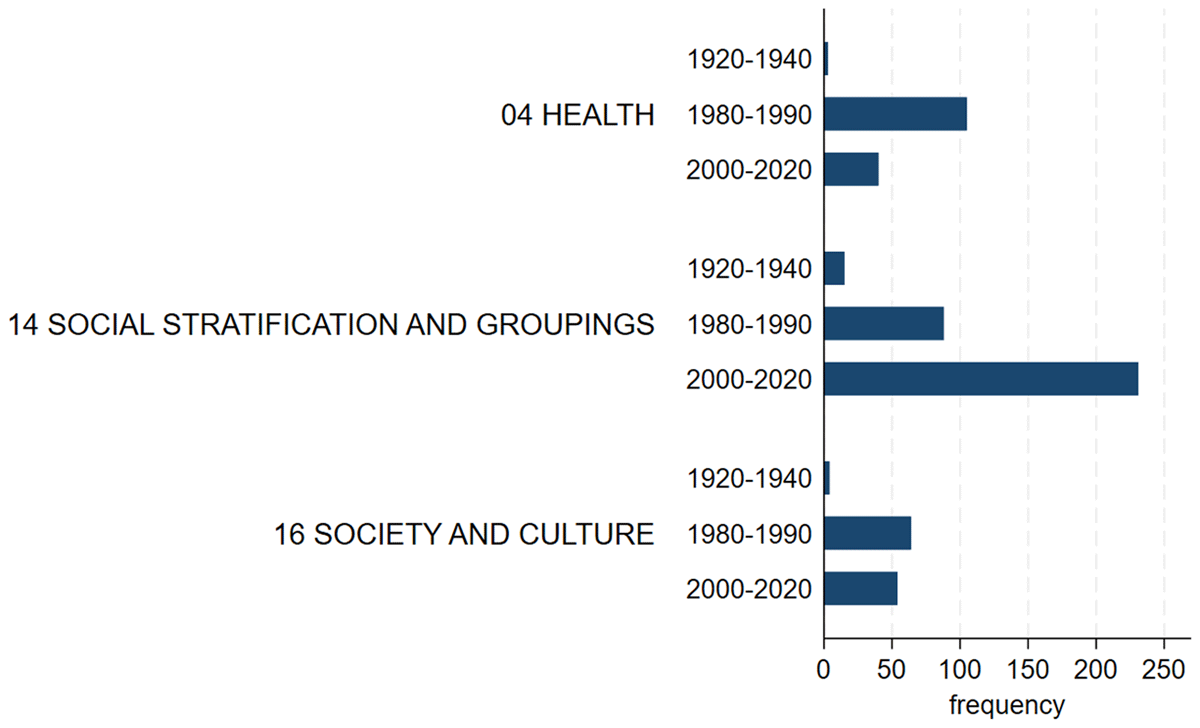
Figure 9
Selected topics covered by start decades, top level of the CESSDA Topic Classification 4.2.2 (English). Derived by classifying study keywords, N = 604.
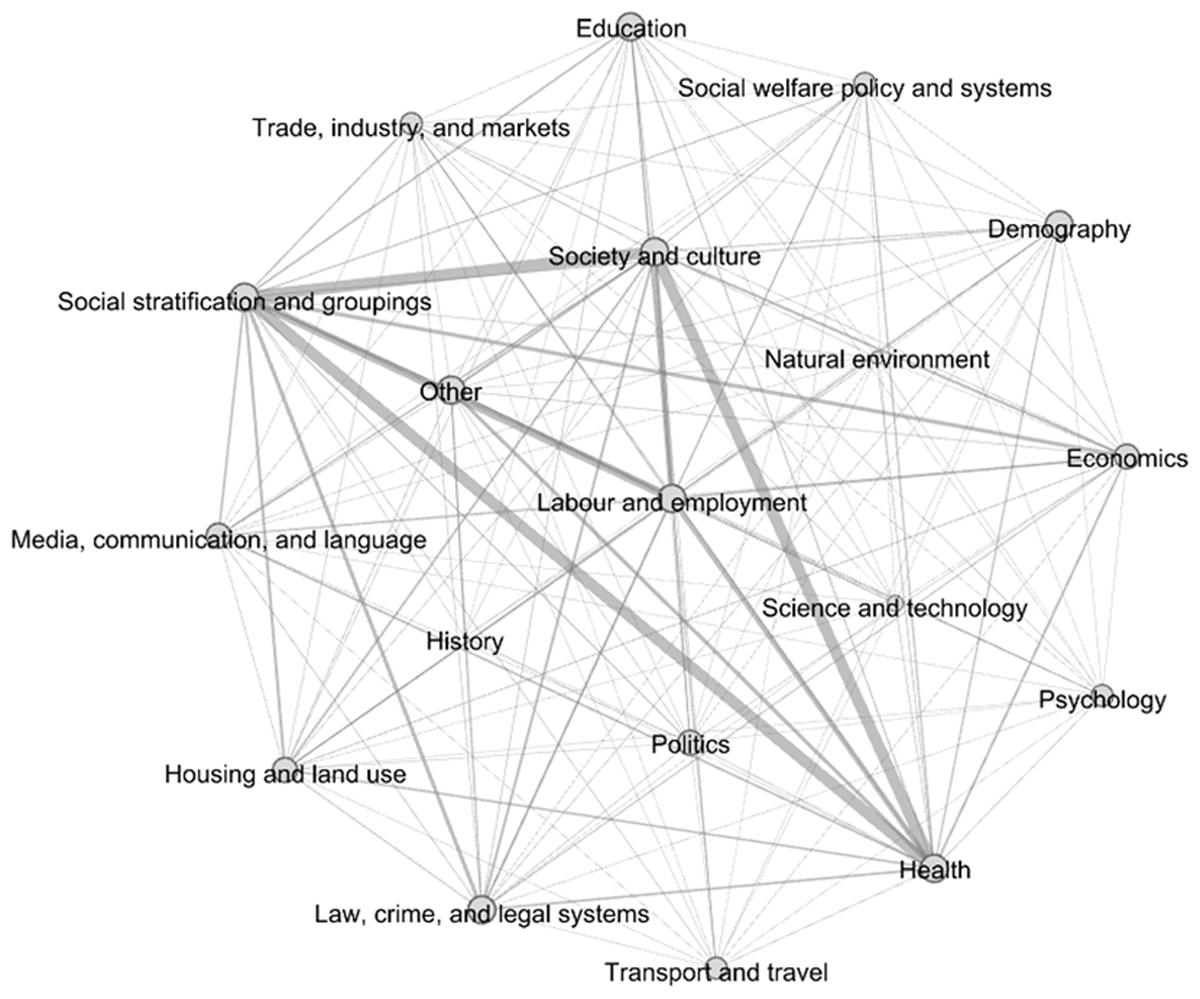
Figure 10
Topics co-occurrences, top level of the CESSDA Topic Classification 4.2.2 (English). Derived by classifying study keywords, network graph algorithm: Fruchterman and Reingold (1991), N = 970.
Table 2
‘HEALTH’ topic gaps. Absolute count per subcategory and percentage of all keywords, N = 970.
| 04. HEALTH | COUNT | % OF ALL KEYWORDS |
|---|---|---|
| Diet and nutrition | 4 | 0.4% |
| Drug abuse, alcohol and smoking | 20 | 2.1% |
| General health and well-being | 25 | 2.6% |
| Health care services and policies | 21 | 2.2% |
| Medication and treatment | 22 | 2.3% |
| Occupational health | 0 | 0.0% |
| Physical fitness and exercise | 9 | 0.9% |
| Public health | 2 | 0.2% |
| Reproductive health | 6 | 0.6% |
| Signs and symptoms; pathological conditions | 15 | 1.5% |
| Specific diseases, disorders and medical conditions | 17 | 1.7% |
| Wounds and injuries | 5 | 0.5% |
| Other | 2 | 0.2% |
Table 3
‘Social stratification and groupings’ topic gaps. Absolute count per subcategory and percentage of all keywords, N = 970.
| 14. SOCIAL STRATIFICATION AND GROUPINGS | COUNT | % OF ALL KEYWORDS |
|---|---|---|
| Adults | 1 | 0.1% |
| Children | 9 | 0.9% |
| Elderly | 0 | 0.0% |
| Elites and leadership | 0 | 0.0% |
| Equality, inequality and social exclusion | 43 | 4.4% |
| Ethnic groups | 9 | 0.9% |
| Family life and marriage | 63 | 6.5% |
| Gender and gender roles | 26 | 2.7% |
| Minorities | 33 | 3.4% |
| Sexuality and sexual identity | 138 | 14.2% |
| Social and occupational mobility | 0 | 0.0% |
| Youth | 7 | 0.7% |
| Other | 8 | 0.8% |
Table 4
‘SOCIETY AND CULTURE’ topic gaps. Absolute count per subcategory and percentage of all keywords, N = 970.
| 16. SOCIETY AND CULTURE | COUNT | % OF ALL KEYWORDS |
|---|---|---|
| Community, urban and rural life | 6 | 0.6% |
| Cultural activities and participation | 1 | 0.1% |
| Identity | 6 | 0.6% |
| Leisure, tourism and sport | 8 | 0.8% |
| Religion and values | 20 | 2.1% |
| Social behavior and attitudes | 66 | 6.8% |
| Social change | 4 | 0.4% |
| Social conditions and indicators | 6 | 0.6% |
| Time use | 1 | 0.1% |
| Other | 4 | 0.4% |