
1. Introduction: LGBTIQ+ Populations and Data Gaps
To a considerable extent, our world and how we interact with it are shaped by data-driven policies, research, and systems—e.g., in healthcare, transport, social welfare, or education. If data about population groups are faulty or missing, this can lead to biases in research results, and policy and systems design which impact parts of the population about whom data is not available in considerable, sometimes life-threatening, ways (see, for example, D’Ignazio and Klein 2020, p. 1).
A more widely researched example of data gaps is the gender data gap, understood as a significant lack of data about women, caused by and at the same time contributing to the ‘presumption that what is male is universal’ (Criado-Perez 2020, p. 24). In 2022, UN Women reported that ‘[o]f the 193 countries who committed to Agenda 2030, no one country has all the data available on gender-specific SDG [sustainable development goal] indicators’, projecting that it will take another 22 years for all relevant data to be available (UN Women, 2022). Pointing to the importance of disaggregating (statistical) data along dimensions such as gender, class, ethnicity, (dis)ability, Criado-Perez suggests that data gaps frequently concern minoritized groups. According to D’Ignazio and Klein, data gaps exist whenever a society is ‘characterized by unequal power relations’ (2020, p. 38): Due to a gendered and racialized power imbalance, data about minoritized groups is not collected as those in power disregard the need or do not feel responsible for the collection of such data.
Among the many existing data gaps are gaps concerning LGBTIQ+ people, i.e., lesbian, gay, bisexual, trans, intersex, and queer people, as well as all people with non-normative sexual or gender identities, including asexual and agender people, who do not consider themselves as falling under one of these labels. Population-level data about these groups are ‘not collected consistently or completely across surveys’ (Committee on Understanding the Well-Being of Sexual and Gender Diverse Populations et al., 2020, p. 400). In its LGBTIQ Equality Strategy 2020–2025, the European Commission points out that ‘[r]eliable and comparable equality data will be crucial for assessing the situation of LGBTIQ people and to effectively tackling inequalities’, vowing to support data collection efforts as part of implementing the strategy (2020, p. 22). Drawing attention to how a lack of gender-disaggregated data has negatively impacted LGBTIQ+ populations during the Covid-19 pandemic, Colaço and Watson-Grant attribute this lack, among other factors, to
political resistance; laws that criminalize and persecute non-cisgender people; stigma and discrimination around collecting gender-disaggregated data; and a lack of adequate awareness and training for both data collectors and respondents around gender definitions, gender-sensitive language, and data protection and confidentiality. (2021, p. 2)
In sociology, LGBTIQ+ people are considered a ‘hidden population’ by demographers—a population for which they ‘have no preexisting sampling frames, making population size and group boundaries unknown’, further contributing to a reluctance to collect data from these groups (Compton, 2018, p. 187). In addition to this, LGBTIQ+ identities are often fluid, something that is not easily captured in demographic data (Ruberg and Ruelos, 2020).
The LGBTIQ+ community is also difficult to access for data collection. In the Technical Report for the EU LGBTI II survey, 2019, the data collectors describe how they could not rely on probability-based random sampling techniques to achieve a representative random sample of LGBTI people across the EU, but instead opted for a self-selected web-based survey. Additionally, they put huge efforts into researching and promoting the survey in channels that target the LGBTIQ+ community as broadly as possible (European Union Agency for Fundamental Rights, 2020b). Still, this approach leads to biases in the sample; for example, it excludes individuals who do not use the internet. The collection of data on LGBTIQ+ groups is complicated further by the fact that these groups continue to experience discrimination and stigma, and therefore have justified privacy concerns (Canberra LGBTIQ Community Consortium et al., 2017). These concerns and the higher risks LGBTIQ+ persons are exposed to—in terms of discrimination and persecution, but also a higher suicide risk— must be acknowledged and accounted for during the data collection process and subsequent use of data.
Therefore, closing data gaps is not an end in itself. The ‘Data Harm Record’ of the Data Justice Lab lists incidents of data harm and data violence, which frequently occur when minoritized groups are overrepresented in data, for example, in the context of predictive policing (cf. Redden et al., 2020). Exploring the issue of gender, sex, and sexuality data in the UK, Guyan (2022) demonstrates that as long as such data is collected and analyzed in ways that follow the agreed rules and standards established and perpetuated by dominant groups, its potential to reinforce and perpetuate the power imbalances is much greater than that of disrupting them. In consequence, as D’Ignazio and Klein put it, ‘[w]hile equitable representation—in datasets and data science workforces—is important, it remains window dressing if we don’t also transform the institutions that produce and reproduce those biased outcomes in the first place’ (2020, p. 32).
And yet, as Guyan argues, data—especially if analyzed using an ‘intersectional approach’1—can contribute to exposing such imbalances of power and their effects on minoritized communities, thereby offering a means to ‘raise awareness, demonstrate where problems exist, challenge misinformation, galvanize communities and hold decision-makers to account’ (2022, p. 17).
Accordingly, there is no simple response to the question if, how, and by whom certain data gaps should be closed. In each case, the risks and benefits of collecting certain data or of making existing data more widely accessible have to be weighed carefully and in a process which centers the communities concerned (see, for example, Actionable Intelligence for Social Policy, 2020). This is reflected in the Feminist Data Manifest-No, whose authors encourage us to engage in ‘critical refusal as a powerful tool to open up and insist on radical and alternate futures’, including the refusal both to ‘reproduce research as a form of exploitation and to allow people in positions of privilege [to] make the decisions on behalf of those without’ (Cifor et al., 2019).
In ‘Solutions to Close the Gender Data Gap’, Data2X stress the importance of promoting and facilitating the provision and use of open data in efforts to close the gender data gap. This extends to the use of ‘historical data’ where possible (Data2X and Open Data Watch, 2022, p. 58). In this vein, a first step towards understanding and potentially reducing the LGBTIQ+ data gap is to identify existing data collected in the past. This task is complicated by the fact that even if data including or oversampling LGBTIQ+ populations was collected, classification systems and controlled vocabularies in use may not have been able to adequately describe them because they did not fall in any of the dominant knowledge system’s categories (Bowker and Star, 2000; Szostak, 2014; Szostak, 2024; for a queer perspective, see Drabinski, 2013, and The Trans Metadata Collective, 2022). For example, a classification system with only two gender categories makes nonbinary persons invisible and, thus, studies specifically dedicated to nonbinary persons not findable.
Historical data and its reuse come with caveats: older data in particular bears the risk of using concepts and language considered outdated and harmful today. Often, data and research about minoritized groups can be characterized as deficit- or damage-centered (e.g., see Guyan, 2022; Holloway, 2023; Levitt et al., 2023; Tuck, 2009) and thereby has the capacity of harming already vulnerable groups. While the identity of individual group members who participated in research can be protected from reidentification by employing sufficient anonymization measures, group harm resulting from research and data reuse cannot be prevented by such a technical approach. Thus, specific care and ethical consideration should apply not only when collecting data from these groups, but also when reusing previously collected data. Archives can support researchers in this effort, for example by contextualizing data to ‘decenter whiteness and to center the voices of the silenced, marginalized, and unheard’ (Wilson Special Collections Library and The University of North Carolina at Chapel Hill University Libraries, 2022, p. 3). In addition, it is of eminent importance that we develop and implement suitable ethics frameworks to govern data reuse.2
This paper aims to address the LGBTIQ+ data gap. We give an overview of quantitative and qualitative LGBTIQ+ data in European social science data archives, namely the archives of the 22 members states of the CESSDA ERIC consortium, its 12 associated members as well as 1 former member archive.3 With our dataset overview, we also want to raise awareness for the implications existing LGBTIQ+ data gaps have for research and policy making.
2. Methodology: Identifying LGBTIQ+ Data in European Social Science Data Archives
Data were collected between July and September 2023. We searched for LGBTIQ+ datasets in all 22 CESSDA member archives, the Danish National Archive,4 and CESSDA’s 12 associated partners. On each data archive website, we identified the data catalogue page and used the simple search function by entering a defined list of search terms (i.e., we searched across all fields in the catalogue).5 Where the archive provided information about a controlled vocabulary (CV) used to describe the topic(s) covered by a given study, the relevant keywords in the vocabulary were identified and the search carried out with these terms. The entire search was an iterative process, as additional relevant keywords were discovered, and these were assigned to studies within the scope of our project. After searching all catalogues providing and using CVs, the collection of controlled terms was used to create a list of search terms to query archive catalogues that did not make use of CVs or where no information about the CVs used was available (see Appendix A1 for list). When the data catalogue was only available in the national language, we translated the search terms using an online tool.
We are aware that our list of search terms may not be complete. So, in addition, we wrote to each data archive to verify that our search results are complete. Fifteen archives confirmed our results and had no further datasets to add, two archives pointed us to one more dataset, and one archive, even to an entire set of nine datasets that we included in our collection. Two archives did not respond.
A dataset is considered relevant for our search when an LGBTIQ+ sample is the main focus of the data collection. This also includes oversampling for LGBTIQ+ populations or when the population is a significant part of the sample; for example, when it is contrasted with a heterosexual and/or cisgender and/or endosex control group. When not all metadata was available from the data archive, we researched the study websites, project reports, and related publications, when available, to complete the metadata. Two cases of datasets which were found but not available to order/download or access by any other means were deleted from our collection.
The complete list of datasets is available in Perry and Recker (2024) and in the reference section ‘LGBTIQ+ Datasets in European Social Science Data Archives’ below.
3. Results
3.1. Sample description
We found a total of 66 datasets with LGBTIQ+ samples or LGBTIQ+ oversamples in 9 data archives. The number of datasets per country ranges from 1 to 17. The datasets were published between 1990 and 2023. While most datasets cover single years or a field period of several months, 15 datasets cover longer time periods, some even across several decades: 13 datasets span 2 decades, 1 dataset spans 3 decades, and 1 dataset even 5 decades. Samples sizes range from 1 to 139,799 respondents. There are 6 datasets which are openly available, 28 available for research, teaching, and study, 10 available for research, and 22 only available under restricted access, such as with an additional user contract or in a secure data center. In 48 datasets, only LGBTIQ+ samples are surveyed. Respondents from the majority population are included in 18 datasets, hence LGBTIQ+ persons were the focus in these studies or were oversampled, but additional respondents are still included in the data. Data on sexual orientation are contained in 65 datasets, and 20 datasets contain data on gender identity. Only 6 datasets collected information about the presence of intersex variations in respondents. There are 30 quantitative, 29 qualitative, and 7 mixed-method datasets. The majority of datasets, namely 61, cover the same country as where the data was located, 4 datasets cover more than one country; this includes large international studies, such as those conducted by the EU. One dataset covers one country that is different from where it was located. Nearly one-third (30.0% or 20 datasets) of the datasets are in English. From those, only 3 datasets outside of the United Kingdom are in English, 2 at DANS and 1 at GESIS; there are 14 each in Finnish6 and in Dutch;7 and 10 are in French. Of the remaining datasets, there are 3 each in German and in Norwegian, and 1 each in Danish and Slovenian. One study that was conducted in Bangladesh was translated into English, except for the open answers that are also available in Bengali for clarity and due to difficult-to-translate concepts.
3.2. Descriptive analyses
General coverage
Out of 35 data archives, 9 hold LGBTIQ+ datasets. The UKDS in the UK with 17, DANS in the Netherlands with 16,8 and FSD in Finland with 14 studies store the majority of the 66 datasets. Three data archives store between 3 and 9 datasets: Sciences Po in France (9 datasets), GESIS in Germany (4), and SIKT in Norway (3). The 3 archives DNA in Denmark, ADP in Slovenia, and FORS in Switzerland hold 1 dataset each (Figure 1).
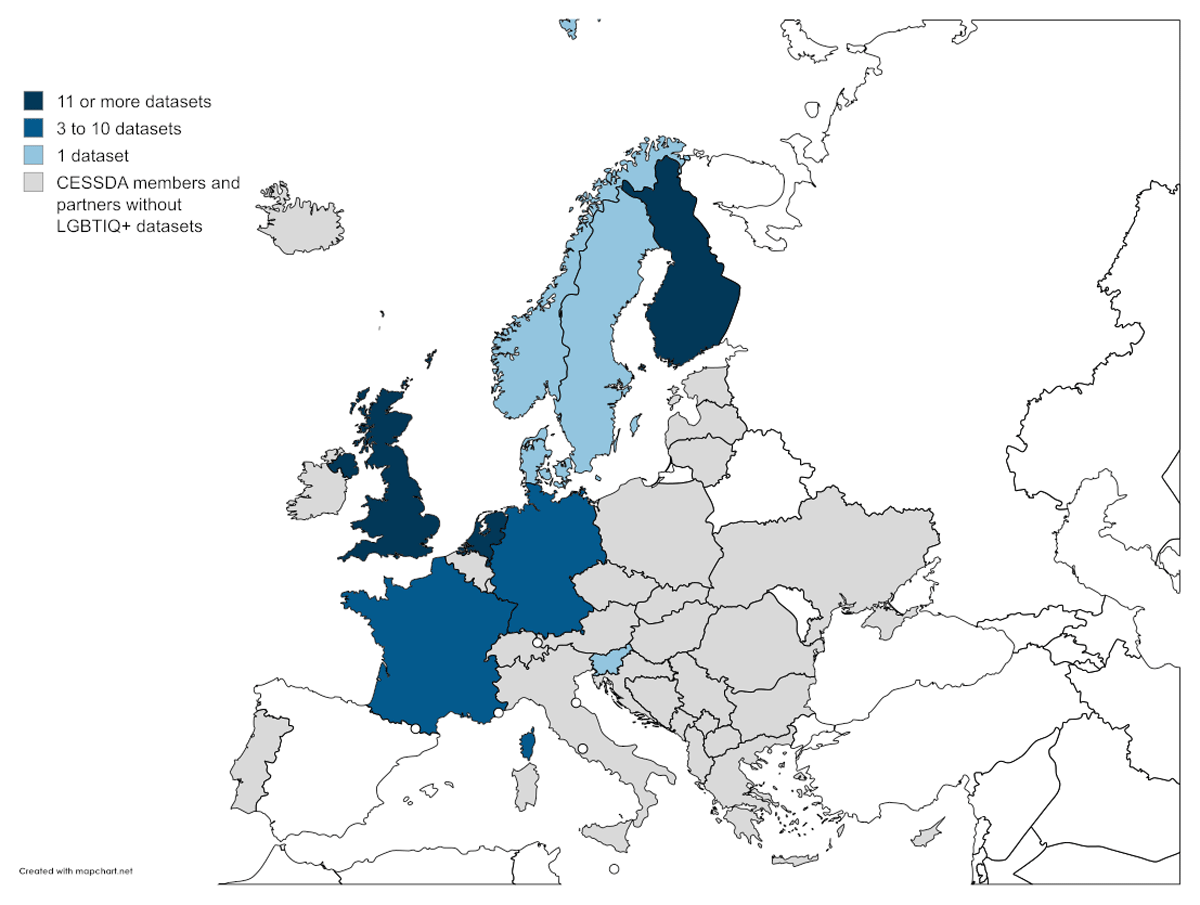
Figure 1
CESSDA member countries and partners and the number of LGBTIQ+ datasets in stock. N = 66 datasets. Map created with MapChart.net (CC BY-SA 4.0).
The samples usually cover LGBTIQ+ persons of the respective countries. One important exception is the EU LGBTI survey. This study was conducted by the European Union Agency for Fundamental Rights (FRA)9 in two rounds. The first round from 2012 is archived at UKDS, and the second round from 2019 is archived at GESIS. Both waves cover all EU member states. The second round also includes United Kingdom, Serbia, and North Macedonia. This leads to an extensive data coverage in Europe (see Figure 4a)10 as the majority of countries are covered by one or two rounds of the EU LGBT/EU LGBTI survey. Hence, this large-scale EU-wide study is an important data source for experiences and views of the LGBT+ population in the EU and allows comparisons between EU countries. Without this data source, country coverage would drop from 32 to 9 European countries.
Four countries are covered by more than 10 LGBTIQ+ datasets: Great Britain (18), the Netherlands (17), Finland (16), and France (11). Five countries are covered by 3 or more datasets: Germany by 5, Denmark, Norway, Slovenia, and Sweden by 3 each. Besides Norway, seven CESSDA partner or member countries are not part of the EU and therefore not included in the EU LGBT/EU LGBTI survey. Switzerland has one national time series. Albania, Bosnia-Herzegovina, Kosovo, Montenegro, Iceland, and Ukraine are not covered by any LGBTIQ+ data.
Three datasets also cover countries outside of Europe: One study with persons who identify as asexual covers the UK, USA, Canada, Sweden, and Australia. In addition to this, there are two smaller studies conducted with LGBTQ persons in UK and India, and with hijra persons (transgender and intersex persons), covering only Bangladesh.
Figure 2 displays the temporal coverage of the LGBTIQ+ datasets we have identified. The datasets are ordered by start decade of the time period observed on the y axis. Datasets may cover just one decade or extend over several decades, which is displayed by the length of the bar. The number of datasets available for each decade, by start decade, is displayed by the bar’s color. The bar at the bottom of the graph displays the total number of datasets covering each decade.
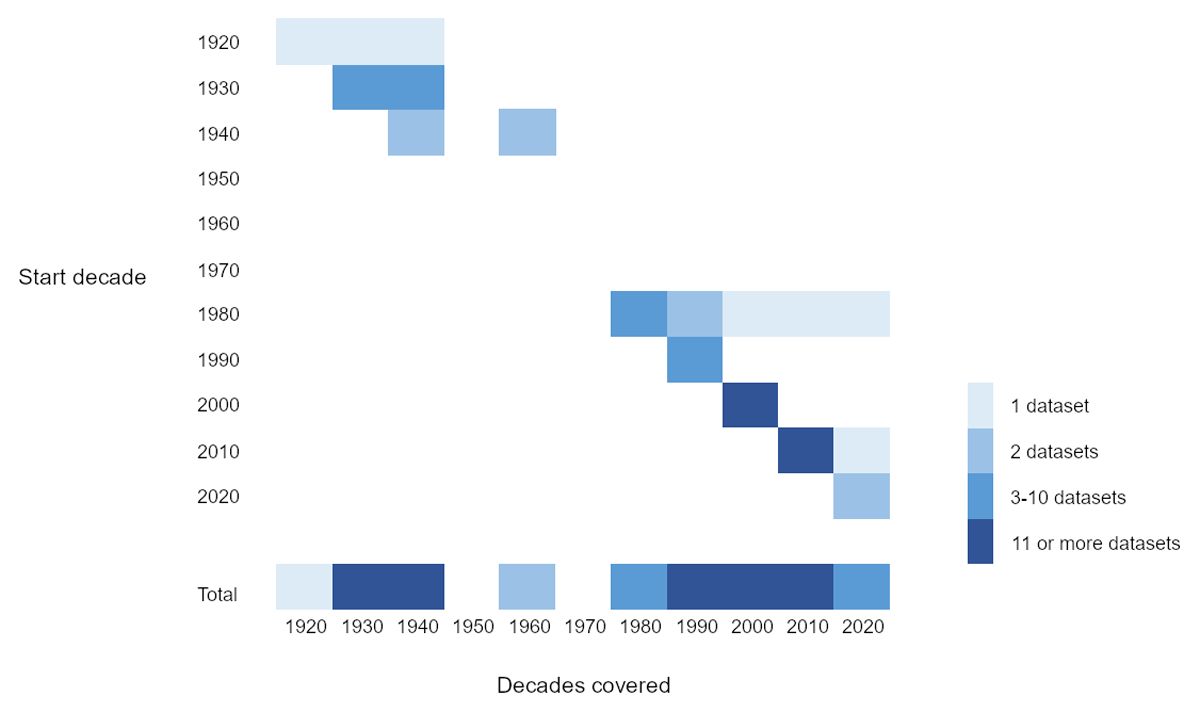
Figure 2
Temporal coverage of LGBTIQ+ datasets in European data archives. N = 66 datasets. Datasets ordered by start decade. Length of the bar represents decades covered by the datasets. Total bar displays the number of datasets covering a decade, irrespective of start decade.
We can see two blocks: The first block covers the 1920s, 1930s, and 1940s and look at homosexuality before and during World War II. A comparatively large number of studies cover the 1930s and 1940s. This is mainly due to 10 datasets from DANS which are individual interviews of the same study. The second time block begins in the 1980s, with 8 datasets starting in the 1980s, 2 of them covering further decades, and 9 datasets starting in the 1990s. In the 2000s, we see an increase of datasets starting with 17 each in the 2000s and the 2010s, and 1 further dataset from the 1980s still covering this timespan. This leaves quite a large gap between the 1950s and the 1970s when no study was started. Only the 1960s are covered by one Finnish study (published as two datasets) looking at homosexuality in the 1940s and 1960s. The early coverage (1920s–1960s) was collected in Finland, Germany, and the Netherlands only. Only later, starting in the 1980s, additional countries are covered as well.
The studies in the first block, which cover the 1920s to the 1960s, were published much later, in the 1990s and 2000s. Also, for the studies covering the 1980s and 1990s, we see some delay in data publication, reaching well into the 2020s. For datasets covering later periods, the publication dates are earlier, often close to data collection (Table 1). This can be for three reasons: First, we don’t know of data already collected but not yet published, and there may be data covering the 2000s and 2010s that will be published at a later time. Second, LGBTQI+ topics are becoming increasingly relevant, and data may still be collected retrospectively, either through archival research or surveys with elderly people and how they experienced queer life in past decades. Third, data sharing and Open Science practices become increasingly important, so that new data are shared soon after data collection. Due to this awareness, older data is also often shared now, even long after data collection.
Sample composition regarding LGBTIQ+ identity
Out of the 66 datasets, 48 cover only LGBTIQ+ persons. The remaining 18 datasets also contain data from the majority group. Reasons for the majority group to be included in the data are:
For comparison while oversampling LGBTIQ+ population in a survey addressed to the general population.
An inability to exclude the majority group during sampling.
Because the data depends on straight and/or cis persons reporting about LGBTIQ+ persons and their living conditions—especially in eyewitness reports about the pre–World War II and the World War II periods—in reports from caregivers and expert reports on the topic in focus, such as domestic abuse.
We distinguish between datasets that cover samples based on sexual orientation, samples based on gender identity, and samples covering intersex persons. It is very evident in Figure 3 that only sexual orientation, not gender identity or the presence of intersex traits, plays a role in datasets covering early samples, the start decades from 1920s to 1990s. With the 2000s, gender identity and the presence of intersex traits start to play a role: 7 out of 17 datasets in the 2000s include gender identity, 2 of them also include the presence of intersex traits. Datasets that started in the 2010s acknowledge both topics even more frequently: 11 out of 17 datasets cover gender identity, 3 of them also the presence of intersex traits. For datasets starting in the 2020s, 1 dataset covers only gender identity and 1 other covers sexual orientation, gender identity, and the presence of intersex traits. This leads to a total of 20 datasets that include gender identity and 6 datasets that include persons with intersex traits in the sample.
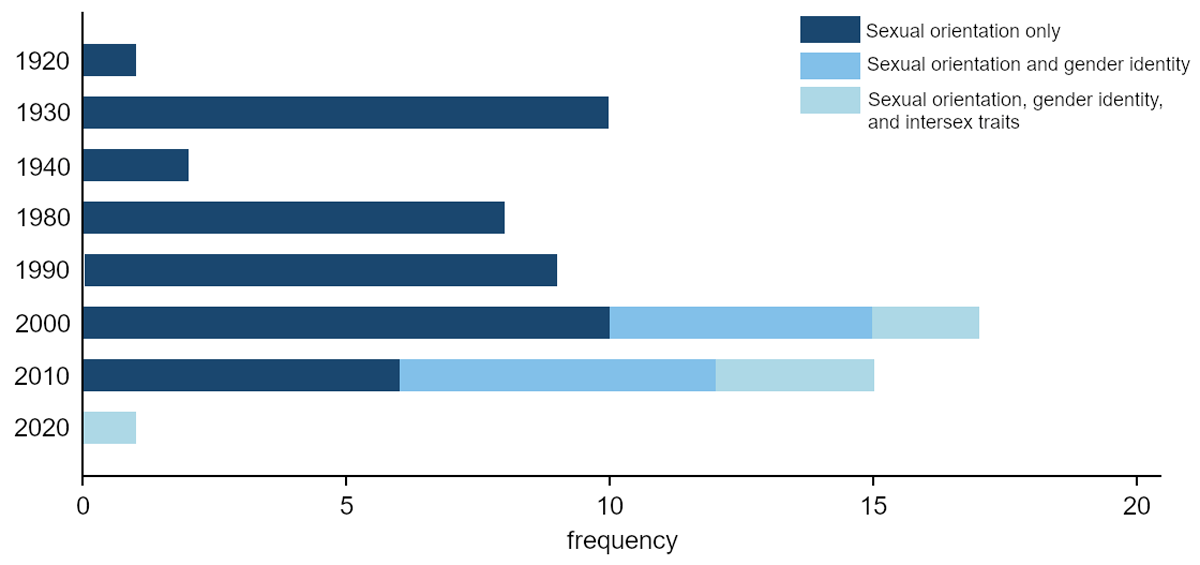
Figure 3
Samples covered by European LGBTIQ+ datasets by start decade. N = 63 datasets.
Hence, only about one-third of the studies identified consider gender identity, restricting research about transgender, nonbinary, and gender queer persons further. Even fewer, namely 6 datasets, report findings on intersex persons. Figure 4 presents the coverage in European countries of each of the LGBTIQ+ aspects in the data found in European data archives. Data focusing on or including gender identity is available in two more countries outside Europe: Bangladesh and India.
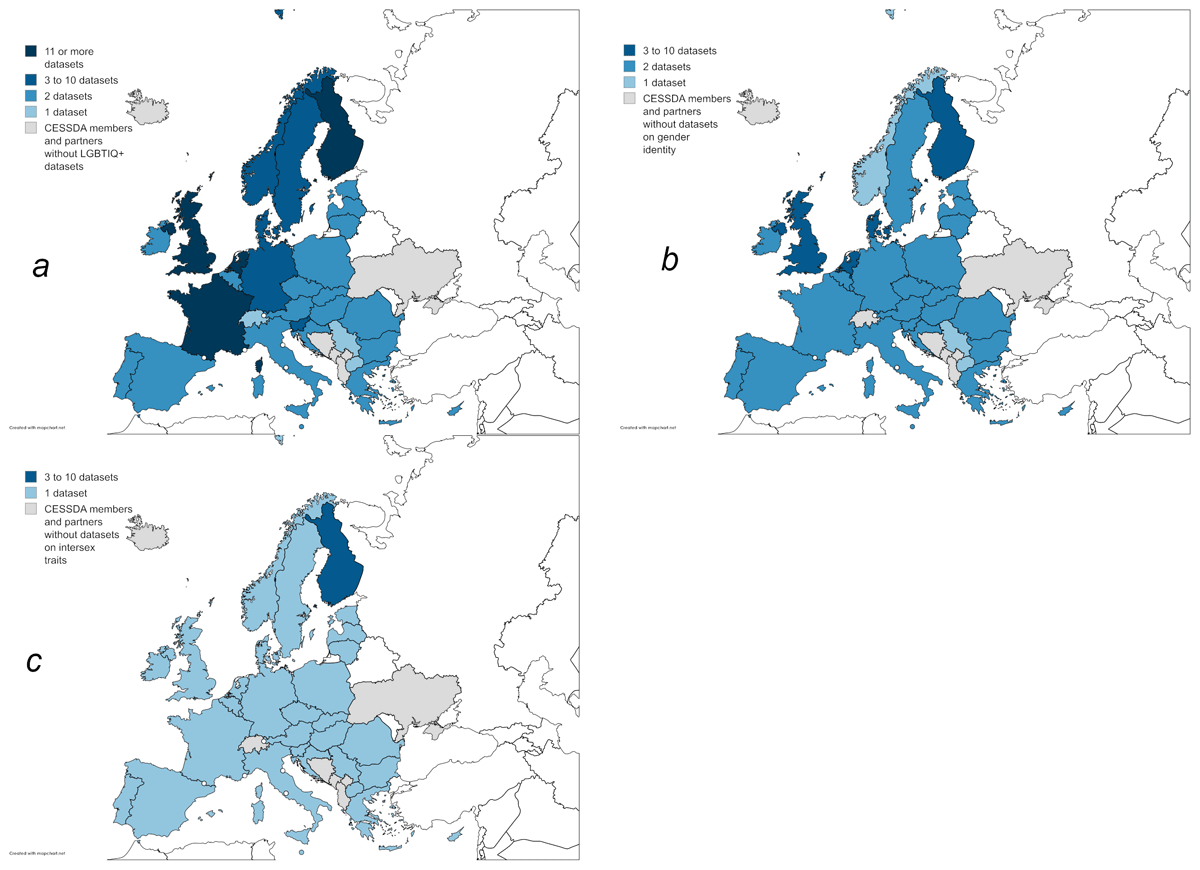
Figure 4
Countries in Europe covered by datasets that include information on (a) sexual orientation, (b) gender identity, and (c) presence of intersex traits in European data archives and the number of datasets covering each country. N = 65 datasets in (a) and (b), 63 datasets in (c). Map created with MapChart.net (CC BY-SA 4.0).
Coverage of data on sexual orientation (Figure 4a) is strongest. Compared to this, country-wise coverage remains similar for gender identity and intersex traits, but the number of datasets in each country is reduced. There is no country that is covered by more than 10 datasets with a focus including gender identity (Figure 4b). Finland and Great Britain are covered by 10 and 7 datasets, respectively, Denmark, Germany, and the Netherlands by 3 datasets each. Almost all other countries are covered by 2 datasets each in the two EU LGBT/EU LGBTI surveys. North Macedonia and Serbia joined the EU LGBTI survey for the second round and therefore have a coverage of 1. The numbers are even further decreased for persons with intersex traits: 5 datasets cover intersex persons in Finland. All other EU countries are covered by the second round of the EU LGBTI survey and, hence, have a coverage of 1 (Figure 4c). This demonstrates again the importance that large-scale international studies have in covering minority groups across several countries. Norway has 1 country study covering sexual orientation, gender identity, and presence of intersex traits. Other CESSDA members and partners that are not in the EU are not covered at all, as they were not included in the EU LGBT/EU LGBTI surveys and didn’t collect data on gender identity or the presence of intersex traits themselves: Albania, Bosnia-Herzegovina, Kosovo, Montenegro, Iceland, Switzerland, and Ukraine.
Method
We identified an about equal number of quantitative and qualitative datasets. Of the total, 30 datasets are quantitative, 29 are qualitative, and 7 are mixed-method. The qualitative and mixed-method datasets are located in only 3 of the 9 countries: Finland, the Netherlands, and United Kingdom (Figure 5).
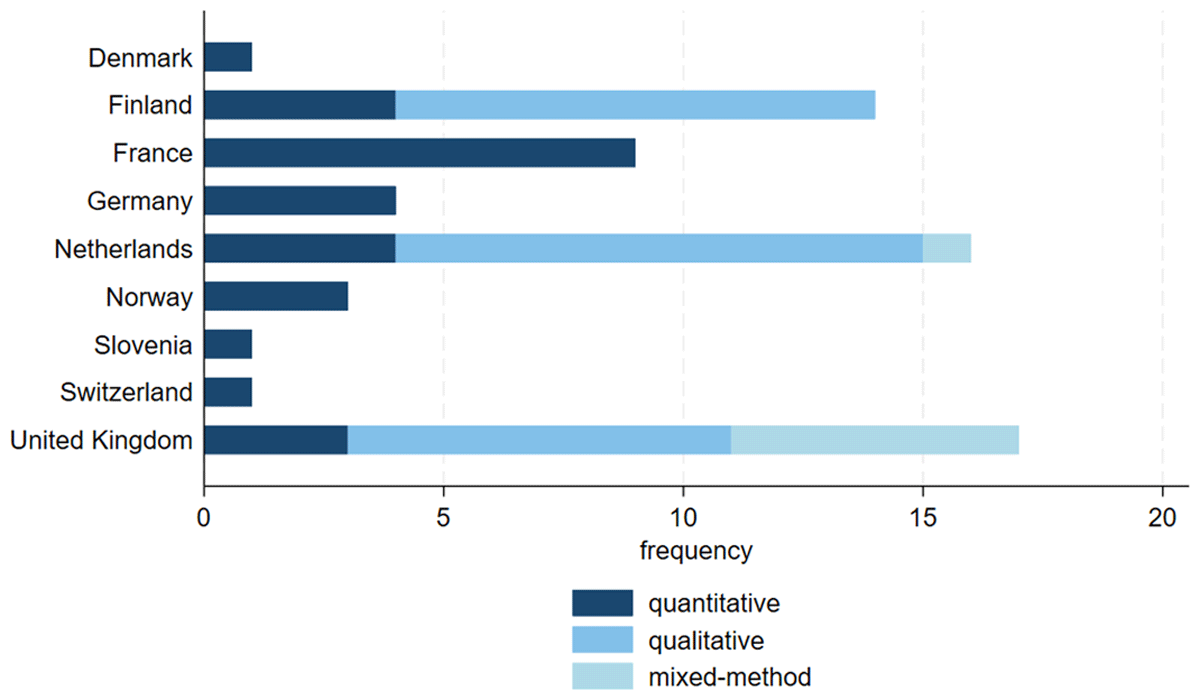
Figure 5
Countries with European LGBTIQ+ datasets by data collection method. N = 66 datasets.
Nearly all datasets (12 out of 13) from the World War II era are qualitative, most of them eyewitness interviews about that time. In the 1980s and 1990s, the studies are mostly quantitative, 15 for both decades combined, plus 2 mixed-method studies. In the 2000s, the majority of the studies are qualitative (10), 5 are qualitative, and 2 are mixed-method. This share drops to about half in the 2010s, with 6 qualitative, 3 mixed-method studies, and 8 quantitative out of a total of 17 studies (Figure 6).
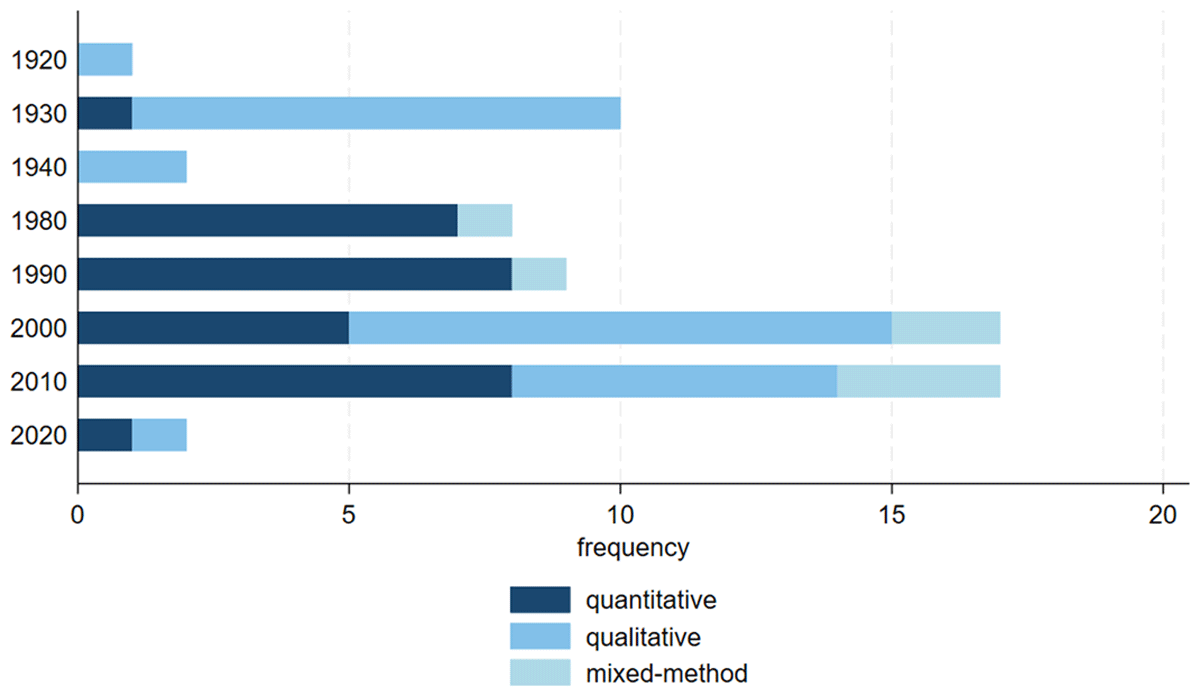
Figure 6
Start decade of European LGBTIQ+ datasets by data collection method. N = 66 datasets.
Qualitative and mixed-method studies are more restricted in access. While only 7 out of 20 quantitative studies are restricted, 13 out of 29 qualitative and 2 out of 7 mixed-method studies are restricted (Figure 7). This reflects the more sensitive nature of qualitative data, which could potentially include more identifying information than quantitative data.
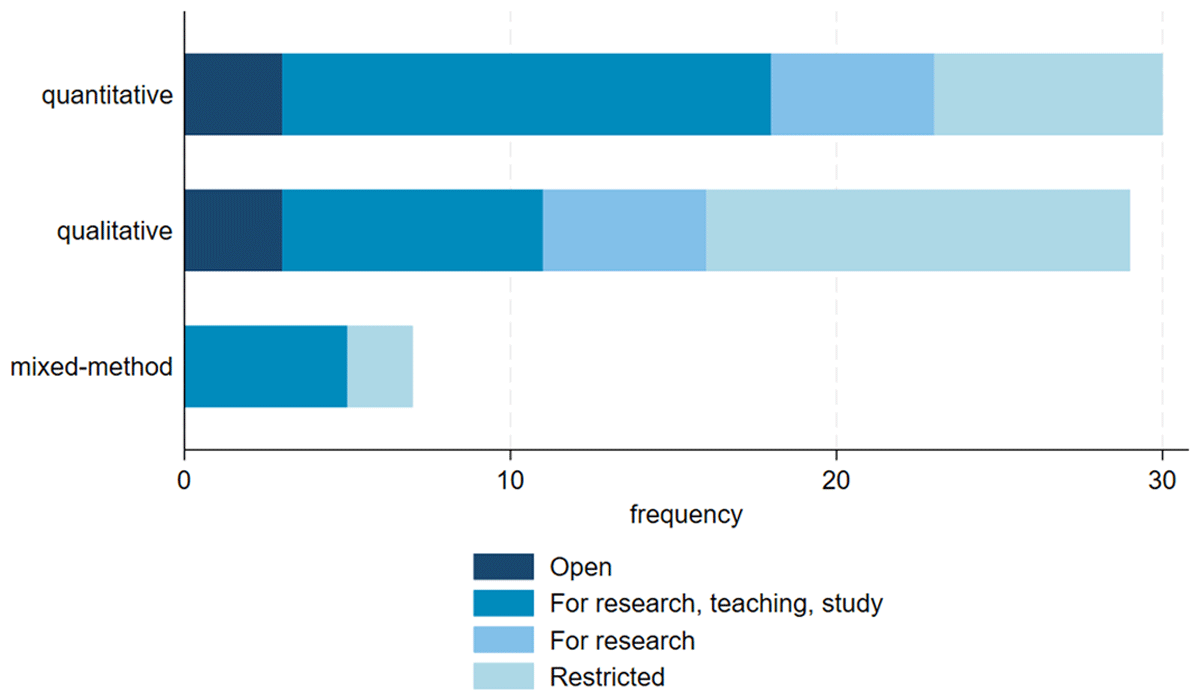
Figure 7
Data collection methods of European LGBTIQ+ datasets by dataset accessibility. N = 66 datasets.
4. Methodology: Keyword Analysis
To enable an initial description of the topics covered in the studies, the datasets’ keywords—originating from different controlled vocabularies—were mapped to the CESSDA Topic Classification, Version 4.2.2 (CESSDA, 2022), a typology for describing the subjects of datasets. It consists of two levels of topic terms, with 19 broader topic categories (spelled in all uppercase letters), which in turn have up to 12 narrower subcategories. Another 6 subcategories were added to the classification to account for gaps in the vocabulary: ‘Adults’, ‘Countries and regions’, ‘Ethnic groups’, ‘Identity’, ‘Holocaust’, and ‘Sexuality and sexual identity’. In addition, a subcategory ‘Other’ was added to each topic category. See Appendix A2 for an overview of the topic terms, including additions, and a graph illustrating the keyword-to-topic mapping for the 50 most-used keywords. The complete mapping is available in Perry and Recker (2024).
If definitions were available in the controlled vocabulary from which a keyword stemmed, this definition was consulted in the process of classification. In addition, a cataloguer with expertise in the use of the CESSDA Topic Classification checked the completed mapping and provided feedback to us.
Each keyword was assigned one category and one subcategory (if applicable). This made it necessary to decide when to use the subcategory ‘Minorities’ versus using a subcategory describing a (minoritized) group or a group characteristic. A keyword was assigned to the ‘Minorities’ subcategory when it explicitly described a minoritized group, e.g., ‘transgender persons’ or ‘homosexual men’. Nouns or adjectives used to describe a characteristic based on which individuals and groups experience marginalization and discrimination were assigned to the fitting group characteristic subcategory. For example, ‘homosexuality’ or ‘gay’ were assigned to the subcategory ‘Sexuality and sexual identity’, and ‘transgender’ (interpreted as an adjective) was assigned to ‘Gender and gender roles’.
5. Results
5.1. Sample description
All but one catalogue record for the identified datasets have keywords assigned to them. This amounts to 970 keywords all in all and 601 unique keywords. Of the 65 studies with keywords, 42 have keywords in English. Other keyword languages are Dutch and French. In one case—the UK Data Service—studies published via the ReShare repository11 had two different sets of keywords, depending on the system from which the catalogue record was retrieved. For the keyword analyses, only the controlled keywords from the main catalogue were considered as this is the primary search interface for the UK Data Service.12
Of the 10 most-used keywords, 7 have to do with (homo)sexuality and sexual identity. Together, these keywords make up 9% of all keywords (N = 970), with ‘homosexuality’ being the most-used keyword by far (assigned 23 times). This aligns with the fact that the samples of most studies covered here were selected based on sexual orientation.
5.2. Covered topics, topic co-occurrences, and topic gaps
Top-level topics
Based on the mapping to the CESSDA Topic Classification the most strongly covered topics, with more than 100 keywords each, are found in the categories ‘Health’, ‘Social Stratification and Groupings’, and ‘Society and Culture’ (Figure 8). The ‘Health’ category covers policy aspects as well as mental and physical health, specific diseases or medical conditions, and medical treatment. ‘Social Stratification and Groupings’ contains subcategories for different population groups based on characteristics, such as age, gender, sexuality, ethnicity, or minority status. In addition, it covers the subtopic ‘Equality, inequality and social exclusion’. ‘Society and Culture’, among others, includes subcategories pertaining to community, values and attitudes, social behavior, activities, and quality of life.
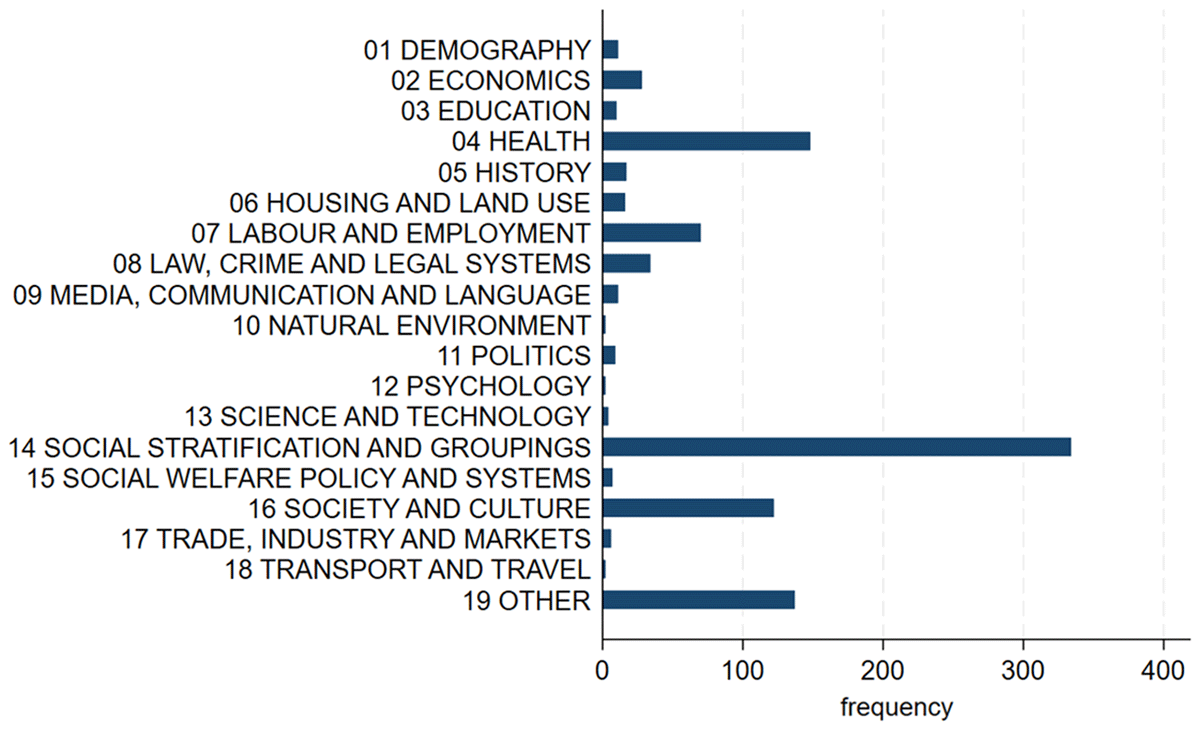
Figure 8
Topics covered by 65 LGBTIQ+ studies on the top level of the CESSDA Topic Classification 4.2.2 (English). Derived by classifying study keywords, N = 970.
Topics over time
To identify topics dominating in different time periods, we divide temporal coverage into three groups: the 1920s–1940s (World War II era), the 1980s–1990s, and studies starting in the 2000s. For studies from the 1920s to the 1940s we generally have fewer keywords, due to fewer studies being available. The four largest topic categories here are ‘HISTORY’, ‘LAW, CRIME AND LEGAL SYSTEMS’, ‘SOCIAL STRATIFICATION AND GROUPINGS’, and ‘OTHER’. This reflects the World War II–era studies, as these are often eyewitness reports about the past or research in historical documents with a focus on the illegality of homosexuality. The category ‘OTHER’ is very large here, as one qualitative study with 10 datasets used great numbers of names and places as keywords. Figure 9 and Table A3 (Appendix) show that health topics were the predominant topics in the 1980s and 1990s, along with social groups. This shifted in the 2000s, when social groups became the predominant topic. The focus on health during the 1980s and 1990s may not be surprising, as this was the height of the HIV/AIDS pandemic, and initially considered to affect primarily homosexual men, as well as those injecting drugs (World Health Organization, n.d.). The most prominent health topics in studies from the 1980s and 1990s were ‘Drug abuse, alcohol and smoking’, ‘General health and well-being’, ‘Health care services and policies’, ‘Medication and treatment’, ‘Signs and symptoms; pathological conditions’, and ‘Specific diseases, disorders and medical conditions’. In the 2000s the focus within ‘HEALTH’ mainly shifted to ‘General health and well-being’ (Appendix: Figure A3a). In the 2000s, the focus also shifted away from health topics to ‘SOCIAL STRATIFICATION AND GROUPINGS’ (Figure 9). The main topic here is ‘Sexuality and sexual identity’, a topic introduced by the authors. Further topics that gained attention in the 2000s (with more than 20 mentions) are ‘Equality, inequality and social exclusion’, ‘Family life and marriage’, and ‘Minorities’ (Appendix: Figure A3b). These findings may demonstrate a shift towards the role of LGBTIQ+ in society, away from specific dominant topics of previous decades, such as health and illegality. Topics of ‘SOCIETY AND CULTURE’ became relevant in the 1980s and further decades and their relevance does not vary much until the 2020s. The only prevalent subcategory is ‘Social behaviour and attitudes’ (Appendix: Figure A3c). This topic includes ‘social behavior; social interaction and networks; social responsibilities; social norms and rules; and attitudes towards these issues’ (CESSDA, 2022). In our case, keywords were often about interpersonal relationships and also included terms, such as ‘bullying’, ‘aggressiveness’, and ‘violence’. ‘Coming out’ also falls under this topic.
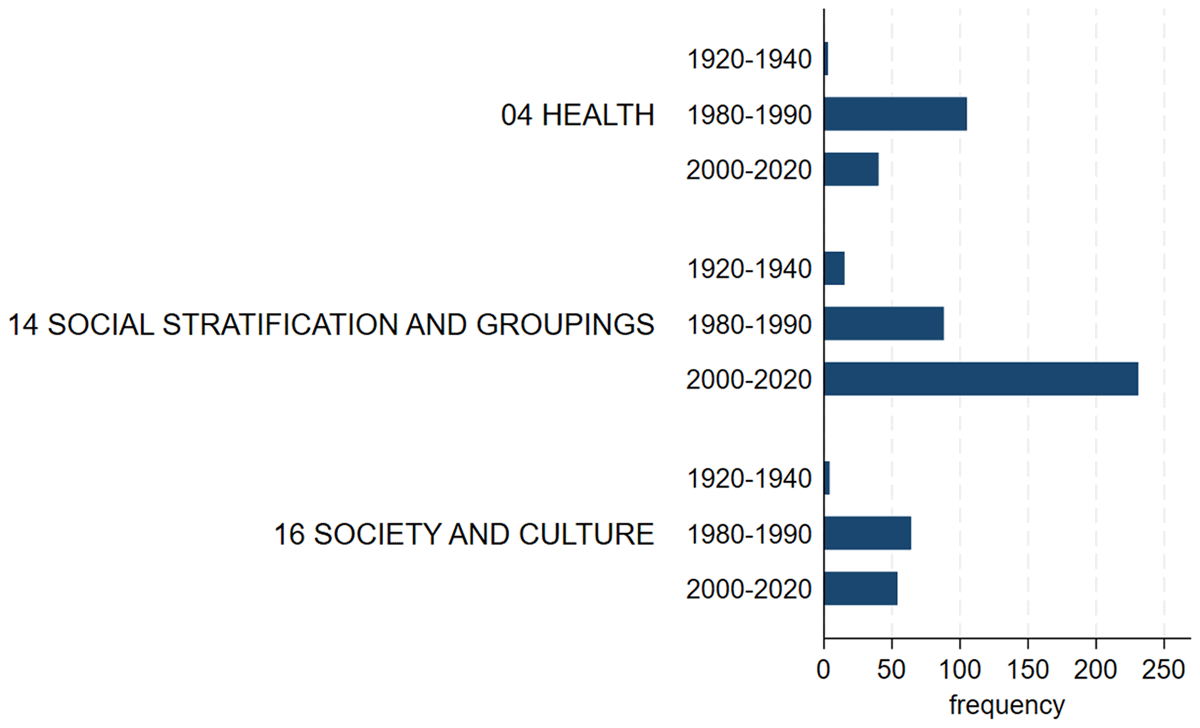
Figure 9
Selected topics covered by start decades, top level of the CESSDA Topic Classification 4.2.2 (English). Derived by classifying study keywords, N = 604.
Topic co-occurrences
In a next step, we look at how the topics co-occur across the 65 datasets. Figure 10 displays co-occurrences in a network graph using the algorithm by Fruchterman and Reingold (1991). This network is very dense and not centralized, with high interconnectivity between the top-level topics. The three most-occurring topics, ‘Health’, ‘Social Stratification and Groupings’, and ‘Society and Culture’ have strong connections with each other, and each relates to every other topic that occurs. This hints at the fact that the three topics are very central for this group of datasets. Further, strong relations exist between ‘Social Stratification and Groupings’ and ‘LABOUR AND EMPLOYMENT’ and between ‘Society and Culture’ and ‘LABOUR AND EMPLOYMENT’. There are no fragments in the co-occurrence network, meaning that all topics are interconnected, and no topic or group of topics stands alone.
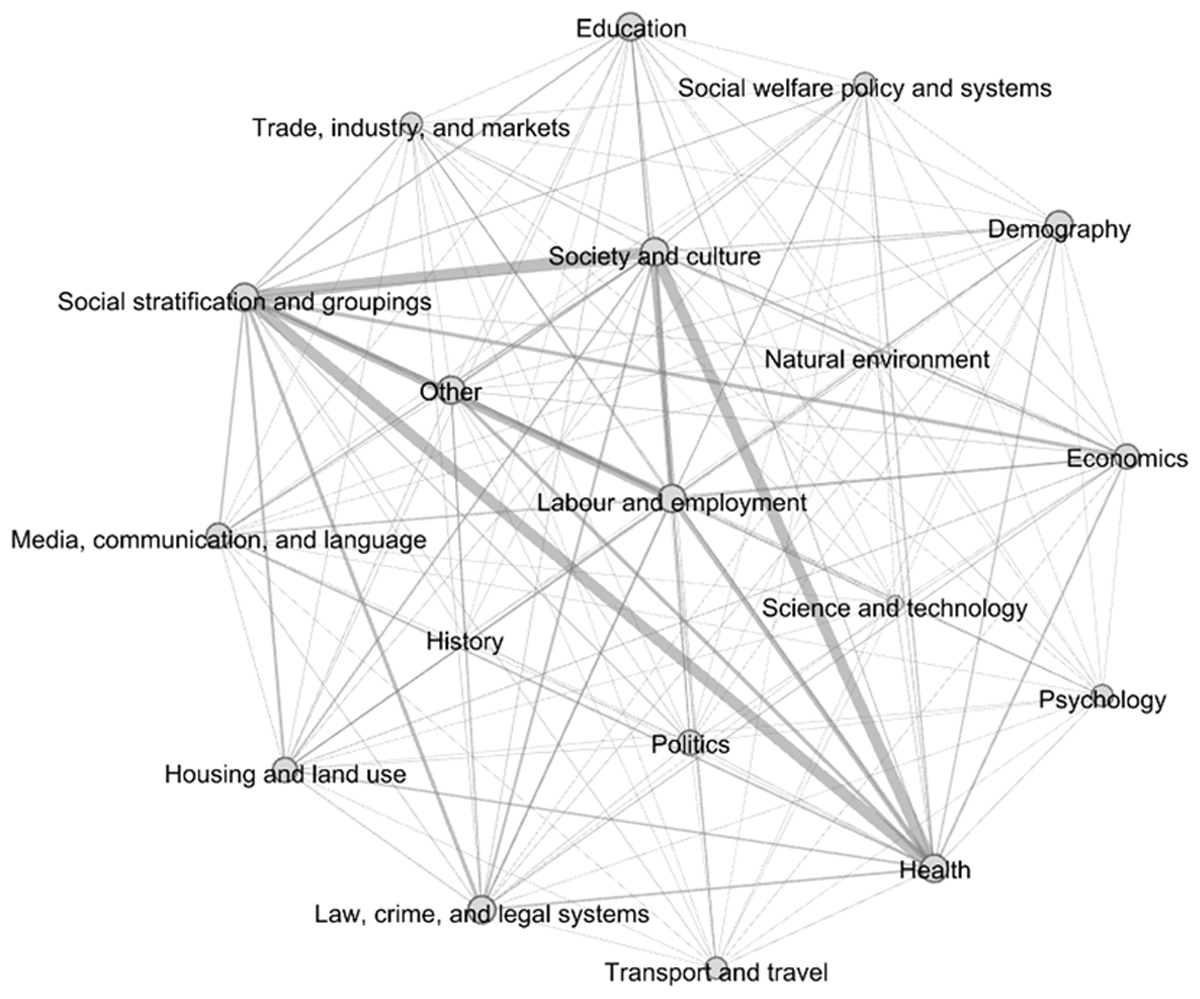
Figure 10
Topics co-occurrences, top level of the CESSDA Topic Classification 4.2.2 (English). Derived by classifying study keywords, network graph algorithm: Fruchterman and Reingold (1991), N = 970.
Topic gaps
Considering the distribution of keywords across the CESSDA Topic Classification main categories, four apparent topic gaps may warrant further, more detailed investigation. ‘PSYCHOLOGY’, ‘EDUCATION’, ‘SOCIAL WELFARE POLICY AND SYSTEMS’, and ‘POLITICS’ are among the categories with the lowest number of keywords (see Appendix: Table A4). Only two keywords matched the CESSDA main category ‘PSYCHOLOGY’ (no subcategories). Given the relative importance that this topic has for LGBTIQ+ individuals, the mentions of self-harm and suicide-related keywords (see below), and the role that psychology has played (and still plays) in pathologizing and delegitimizing LGBTIQ+ people and their lived experience (see, for example, Drescher, 2015; Kara, 2017), it seems that this topic is underrepresented in the LGBTIQ+ datasets analyzed here. However, as with the category ‘EDUCATION’, it is possible that such data is held in other, subject-specific repositories beyond the scope of this paper. Relatively few keywords in the categories ‘SOCIAL WELFARE POLICY AND SYSTEMS’ and ‘POLITICS’ were assigned to the LGBTIQ+ datasets studied here. Data with keywords falling into the former category may be of relevance for the study of poverty—an area that is currently considered a data gap (see European Commission, 2020, p. 9; Karsay, 2021, p. 9). Given the strong links between politics, law making (e.g., laws concerning gender recognition and marriage equality), and LGBTIQ+ discrimination, it is surprising that this topic is not represented in the sample more strongly.
In the following, we look at ‘topic gaps’ in the distribution of keywords among the CESSDA Topic Classification subcategories for ‘HEALTH’, ‘SOCIAL STRATIFICATION AND GROUPINGS’ and ‘SOCIETY AND CULTURE’, i.e., the main categories matched most often. For this purpose, we determine how many keywords were matched to a given subcategory. We consider something a ‘topic gap’ when a subcategory contains fewer than 1% of all keywords assigned to the LGBTIQ+ datasets identified (N = 970). A limitation of our approach is that our study only considers social science data archives, while relevant data may be held in subject repositories of neighboring disciplines, psychology and educational science in particular. Yet, our study may provide some initial pointers as to which data is available to researchers in the empirical social sciences.
When considering the identified gaps in the ‘HEALTH’ category, two subcategories stand out that may be of particular relevance in the context of LGBTIQ+ populations: ‘Reproductive health’ and ‘Wounds and injuries’ (see Table 2). Although the CESSDA Topic Classification does not allow for a distinction between general and mental health, the subcategory ‘Wounds and injuries’—assigned only five times across all LGBTIQ+ datasets studied here—exclusively contains keywords relating to self-harm and suicide, and can thus be considered relevant to mental health. In addition, 14 keywords in the ‘HEALTH’ category relate to mental health, bringing overall coverage of this topic up to 2% of all keywords. The keywords are applied to 5 of the 65 identified LGBTIQ+ datasets with keywords. ILGA Europe, an LGBTIQ+ advocacy group, points to the relevance of this topic—especially, in relation to minority stress—and the need for ‘disaggregating data on the grounds of SOGIESC’, that is, sexual orientation, gender identity, gender expression, and sex characteristics (ILGA Europe, n.d.). Pöge et al. (2020) report that data on reproductive health of LGBTIQ+ population, despite its importance, is scarce.
Table 2
‘HEALTH’ topic gaps. Absolute count per subcategory and percentage of all keywords, N = 970.
| 04. HEALTH | COUNT | % OF ALL KEYWORDS |
|---|---|---|
| Diet and nutrition | 4 | 0.4% |
| Drug abuse, alcohol and smoking | 20 | 2.1% |
| General health and well-being | 25 | 2.6% |
| Health care services and policies | 21 | 2.2% |
| Medication and treatment | 22 | 2.3% |
| Occupational health | 0 | 0.0% |
| Physical fitness and exercise | 9 | 0.9% |
| Public health | 2 | 0.2% |
| Reproductive health | 6 | 0.6% |
| Signs and symptoms; pathological conditions | 15 | 1.5% |
| Specific diseases, disorders and medical conditions | 17 | 1.7% |
| Wounds and injuries | 5 | 0.5% |
| Other | 2 | 0.2% |
The subcategories in the CESSDA topic ‘Social stratification and groupings’ are particularly relevant to research on intersecting dimensions of LGBTIQ+ identities. In its LGBTIQ Equality Strategy 2020–2025, the European Commission states that ‘[r]esearch on the intersectional experiences of LGBTIQ people, as those who are elderly or with disabilities, is often lacking’ (2020, p. 10). This seems to be confirmed by the keyword distribution shown in Table 3. As pointed out in the introduction, research on intersectional experiences requires data disaggregated along the relevant dimensions. While the presence or absence of certain keywords in Table 3 does not allow us to draw conclusions about whether information about these dimensions was collected, it may tell us something about the focus of the research. Thus, not a single study was assigned the CESSDA subcategory ‘Elderly’, and relatively few keywords were assigned to the subcategories ‘Migration’, ‘Youth’, and ‘Ethnic groups’. In addition, only a single dataset was assigned a keyword relating to disability (note that this was subsumed under the ‘Minorities’ subcategory.
Table 3
‘Social stratification and groupings’ topic gaps. Absolute count per subcategory and percentage of all keywords, N = 970.
| 14. SOCIAL STRATIFICATION AND GROUPINGS | COUNT | % OF ALL KEYWORDS |
|---|---|---|
| Adults | 1 | 0.1% |
| Children | 9 | 0.9% |
| Elderly | 0 | 0.0% |
| Elites and leadership | 0 | 0.0% |
| Equality, inequality and social exclusion | 43 | 4.4% |
| Ethnic groups | 9 | 0.9% |
| Family life and marriage | 63 | 6.5% |
| Gender and gender roles | 26 | 2.7% |
| Minorities | 33 | 3.4% |
| Sexuality and sexual identity | 138 | 14.2% |
| Social and occupational mobility | 0 | 0.0% |
| Youth | 7 | 0.7% |
| Other | 8 | 0.8% |
Data on the topics subsumed under ‘Society and culture’ allow us to learn more about LGBTIQ+ individuals’ connectedness with and embeddedness in society, including participation in cultural and leisure activities. As shown in Table 4, the LGBTIQ+ datasets analyzed in the current study were assigned keywords focusing almost exclusively on ‘Social behavior and attitudes’ and ‘Religion and values’, leaving aside topics such as ‘Leisure, tourism and sport’ or ‘Cultural activities and participation’. Data on these latter topics might lend itself to research to understand more about how LGBTIQ+ persons go about their day-to-day lives and build communities. In a similar manner, the subcategory ‘Identity’ may allow us to focus dimensions of identity and belonging beyond sexual or gender identity in that it covers ‘who people feel they are and where they feel they belong in terms of nationality, locality, social class, generation, ethnicity, religion or any other social/cultural grouping’ (CESSDA 2022). Therefore, data lending itself to research on this subtopic could allow us to consider the lived realities of LGBTIQ+ persons in a more ‘holistic’ manner instead of reducing them to their sexual orientation or gender identity. The same might be true for data on ‘Social conditions and indicators’ as this subcategory includes keywords on ‘all aspects of the quality of life and well-being of individuals and societies, as well as people’s perceptions thereof’ (CESSDA 2022). At the same time, however, of the 37 datasets which were assigned keywords from the category ‘SOCIETY AND CULTURE’, over 60%—24 studies—used these keywords in combination with ‘discrimination’, or another negatively connoted term such as ‘inequality and exclusion’, ‘prejudice’, or ‘bullying’. If we remove studies that only applied keywords from the most-used subcategories ‘Religion and values’ and ‘Social behavior and attitudes’, of the 29 studies that remain almost 80% –24 studies—use keywords from one of the remaining ‘SOCIETY AND CULTURE’ subcategories together with ‘discrimination’ or a similarly negative term.
Table 4
‘SOCIETY AND CULTURE’ topic gaps. Absolute count per subcategory and percentage of all keywords, N = 970.
| 16. SOCIETY AND CULTURE | COUNT | % OF ALL KEYWORDS |
|---|---|---|
| Community, urban and rural life | 6 | 0.6% |
| Cultural activities and participation | 1 | 0.1% |
| Identity | 6 | 0.6% |
| Leisure, tourism and sport | 8 | 0.8% |
| Religion and values | 20 | 2.1% |
| Social behavior and attitudes | 66 | 6.8% |
| Social change | 4 | 0.4% |
| Social conditions and indicators | 6 | 0.6% |
| Time use | 1 | 0.1% |
| Other | 4 | 0.4% |
Only few keywords assigned to the LGBTIQ+ datasets analyzed here fall in the subcategory ‘Social change’ (0.4%). This is surprising in that it is a topic which can be considered central to sociological research, and which is highly relevant to changes in LGBTIQ+ rights and lived experience, both in a historical and current perspective. This could indicate that social change is more often researched and described from the perspective of dominant groups, e.g., when cis/endosex persons are surveyed about their attitudes on LGBTIQ+ people, gay marriage, etc. However, more research is needed to test this hypothesis.
6. Discussion and Conclusion
Overall, we see that there is very little LGBTIQ+ data available in European Social Science Data Archives. Only 66 datasets out of approximately 45,600 datasets stored in CESSDA archives have LGBTIQ+ samples. This is a share of only 0.145%. For comparison, the share of LGB+ persons worldwide is 11%, that of trans persons 2% (Ipsos, 2021). In this context it is important to note that LGBTIQ+ data is not only held in research data infrastructure organizations such as the CESSDA archives but also in community-related organizations. With regard to survey data, LGBTIQ+ advocacy groups and queer or feminist research institutes are important actors in this landscape. However, these data tend to be not available for reuse by researchers not affiliated with these organizations.13
The data gap for intersex persons is especially large, as only 6 of the 66 datasets we identified include this group in their sample. Similarly, there are large spatial gaps in Europe, with a number of countries being covered by only the two waves of the EU LGBT(I) Surveys, and only by the second wave, when it comes to intersex persons. Aside from this large-scale EU survey, only very few Northern and Western European countries are covered by further data sources. We also have a large temporal gap between the 1950s and the 1970s, when homosexuality was still illegal in most countries.
The two waves of EU LGBT(I) Surveys from 2012 and 2019 play an important role in filling these gaps for the more recent years. The survey covers a large number of countries, ensuring spatial coverage throughout the EU, and of a number of topics, such as everyday life for LGBTI persons in the EU, satisfaction, same-sex relationships and marriage, and including a focus on discrimination, violence, and harassment. It also focuses on the situation of intersex persons (European Union Agency for Fundamental Rights, 2020a). For all EU countries except Finland, this is the only data source on the presence of intersex traits. For wide parts of the EU this is also the only data source on gender identity.
The scarceness of data on topics relevant to intersectional research is striking in the already scarce data we identified. In particular, the lack of any data in the subcategory ‘Elderly’ and the fact that only one dataset considers disability alongside LGBTIQ+ identity both stand out. Factoring in the apparent lack of data on specific ethnic groups and youth, this means that—at least judging by the keywords—data on some of the most vulnerable groups in the wider LGBTIQ+ population is not readily findable and available from Social Science data archives in Europe. This heightens the importance of the EU LGBTI+ Surveys even more, as they provide disaggregated data along a number of intersections (e.g., see ILGA Europe, 2022).
The fact that very few datasets covered in our study have keywords from the topic categories ‘ECONOMICS’—including the subtopics ‘Economic conditions and indicators’ and ‘Income, property and investment/saving’, and ‘SOCIAL WELFARE POLICY AND SYSTEMS’ (see Figure 8) suggest that overall, European Social Science data archives hold little data to study the economic situation of the LGBTIQ+ population.
The Corona virus (Covid-19) pandemic revealed drastic implications of such data gaps. For the US, it was reported that not only did LGBTIQ+ persons have higher prevalences of many underlying conditions associated with severe Covid-related illnesses (Heslin and Hall, 2021) but they also suffered from worse mental health, increased layoffs (with the resulting inability to meet basic needs), and worsening social connectedness compared to the majority group during the pandemic (Nowaskie and Roesler, 2022). Better knowledge about LGBTIQ+ persons’ physical and mental health statuses, job situations, and their social network could have improved the government’s and aid organizations’ response to these needs and their situation during the pandemic.
The keyword-led topic analysis in this paper enables an identification of potential data gaps. At the same time, it opens up future research avenues: A more in-depth analysis of actual study documents and related publications, including computational topic modeling, is needed to confirm (or disprove) that the identified topic gaps exist or whether certain topics are hidden in the archives (Bowker and Star, 2000). Similarly, further analysis will be needed to determine to what extent the datasets and the research associated with it feed into deficit- or damage-centered research, which—as Tuck argues—cause considerable harm to the studied communities (Tuck, 2009). As we have shown, the topics in the CESSDA top category ‘SOCIETY AND CULTURE’ would make it possible to document LGBTIQ+ individuals’ everyday lives and identities in a more holistic way than merely through the lens of their sexual and/or gender identities. With this, they bear a potential to shift the focus away from damage and deficit orientation. Yet the fact that subtopics such as ‘Community, urban and rural life’, ‘Cultural activities and participation’, ‘Identity’, or ‘Leisure, tourism and sport’ are almost exclusively paired with negatively connoted terms seems to suggest that this potential may not be realized—something that further research, including extending our queries to Scopus, will have to confirm. Finally, our dataset queries may be extended to other countries and to tools such as Dataverse. This will offer a comparison of Europe to other countries and regions, such as North America and Australia.
Data Accessibility Statement
Data supporting this study are openly available from GESIS—Leibniz Institute for the Social Sciences at https://doi.org/10.7802/2650.
Additional File
The additional file for this article can be found as follows:
Notes
[1] The concept of ‘intersectionality’ was famously introduced by Crenshaw ‘to contrast the multidimensionality of Black women’s experience with the single-axis analysis that distorts these experiences’ (Crenshaw, 1989, p. 139). Widely adopted in sociological research, ‘intersectionality’ helps to analyze and understand the ‘complex, cumulative way in which the effects of multiple forms of discrimination (such as racism, sexism, and classism) combine, overlap, or intersect especially in the experiences of marginalized individuals or groups’ (Merriam-Webster, n.d.).
[2] For example, Xafis et al. propose an ethics framework for the collection and use of big data in the context of health research (2019). The authors propose a set of sixteen substantive and procedural values and highlight three general issues that need to be considered in ethics decisions: ‘respect for persons, social license, and vulnerability and power’ (p. 250).
[3] CESSDA, the Consortium of European Social Science Data Archives, provides integrated and sustainable data services to the social sciences, including a common search interface over member archive holdings and controlled vocabulary and terminology services, as well as training and education for both social sciences researchers and archive staff.
[5] The only exception to this procedure was the GESIS data archive, as the authors had access to the internal query system, allowing us to search the field ‘universe’ directly.
[7] One mixed-method dataset at DANS contains original answers in Bengali. This is for clarity of expression and difficult-to-translate concepts.
[8] Of the 16 studies in the DANS data catalogue, 10 are individual interviews from the same studies; they are stored, however, as individual datasets.
[10] All datasets covering Europe cover sexual orientation. Therefore, the coverage displayed in Figure 4a is the same as for all LGBTIQ+ topics.
[13] Some examples of such organizations carrying out their own research in Europe are TGEU (https://tgeu.org), OII Europe (https://www.oiieurope.org), COFACE Families Europe (https://coface-eu.org), Scotland: Equality Network (https://www.equality-network.org), Germany: Diversity Institut (https://www.diversity-institut.info), Bundesstiftung Magnus Hirschfeld (https://mh-stiftung.de).
Acknowledgements
We thank our colleagues Lina Kapohl, for contributing to the data collection process, and Katrin Baum, for sharing her expertise with controlled vocabularies, the CESSDA Topic Classification in particular, with us during the process of writing. We are grateful to Christian Prinz for thorough checks of our data as part of the data publication process. In addition, we would like to thank our colleagues from the CESSDA archives for patiently responding to our queries.
Funding Information
The publication of this article was funded by the Open Access Fund of the German Leibniz Association.
Competing Interests
The authors have no competing interests to declare.
Author Contributions
J.R.: Conceptualization, Writing, Methodology, Data collection, Analyses, Visualization, Revision; A.P.: Writing, Data collection, Data management, Analyses, Visualization, Revision.