
Table 1
List of FAIR assessment tools analysed.
Table 2
Differentiation of analysed tools based on identified distinguishing characteristics. The term ‘enabled’ signifies that the configuration allows the addition of new metrics, allowing individuals to include metrics relevant to their discipline or community. The ‘any dig. obj.*’ value means that there is a large number of typologies supported yet this is specialised rather than actually supporting ‘any’.
| TOOL ID | TARGET | METHODOLOGY | ADAPTABILITY | DISCIPLINE SPECIFIC | COMMUNITY SPECIFIC | PROVISIONING |
|---|---|---|---|---|---|---|
| AUT | any dig. obj.* | automatic | no | bioinformatics | no | as-a-service |
| CHE | any dig. obj. | automatic | no | life sciences | no | as-a-service |
| DAT | dataset | manual | no | no | no | as-a-service |
| ENO | dataset | automatic | yes | enabled | enabled | as-a-service |
| EVA | dataset | automatic | no | no | yes | as-a-service |
| EVL | any dig. obj. | automatic | yes | enabled | enabled | as-a-service |
| FDB | dataset | manual | no | no | no | as-a-service |
| FES | repository | manual | no | no | no | on-premises |
| FOO | semantic artefact | automatic | no | no | no | as-a-service |
| FRO | any dig. obj.* | automatic | no | no | no | on-premises |
| FSH | any dig. obj. | hybrid | yes | enabled | enabled | as-a-service |
| FUJ | dataset | automatic | no | no | no | as-a-service |
| HFI | software | automatic | no | no | no | on-premises |
| MAT | repository | hybrid | no | yes | no | on-premises |
| OFA | semantic artefact | automatic | no | no | no | as-a-service |
| OPE | repository | automatic | no | no | yes | as-a-service |
| RDA | dataset | manual | no | no | no | on-premises |
| SAG | dataset | manual | no | no | no | on-premises |
| SAT | dataset | manual | no | no | yes | as-a-service |
| SET | dataset | manual | no | no | no | as-a-service |
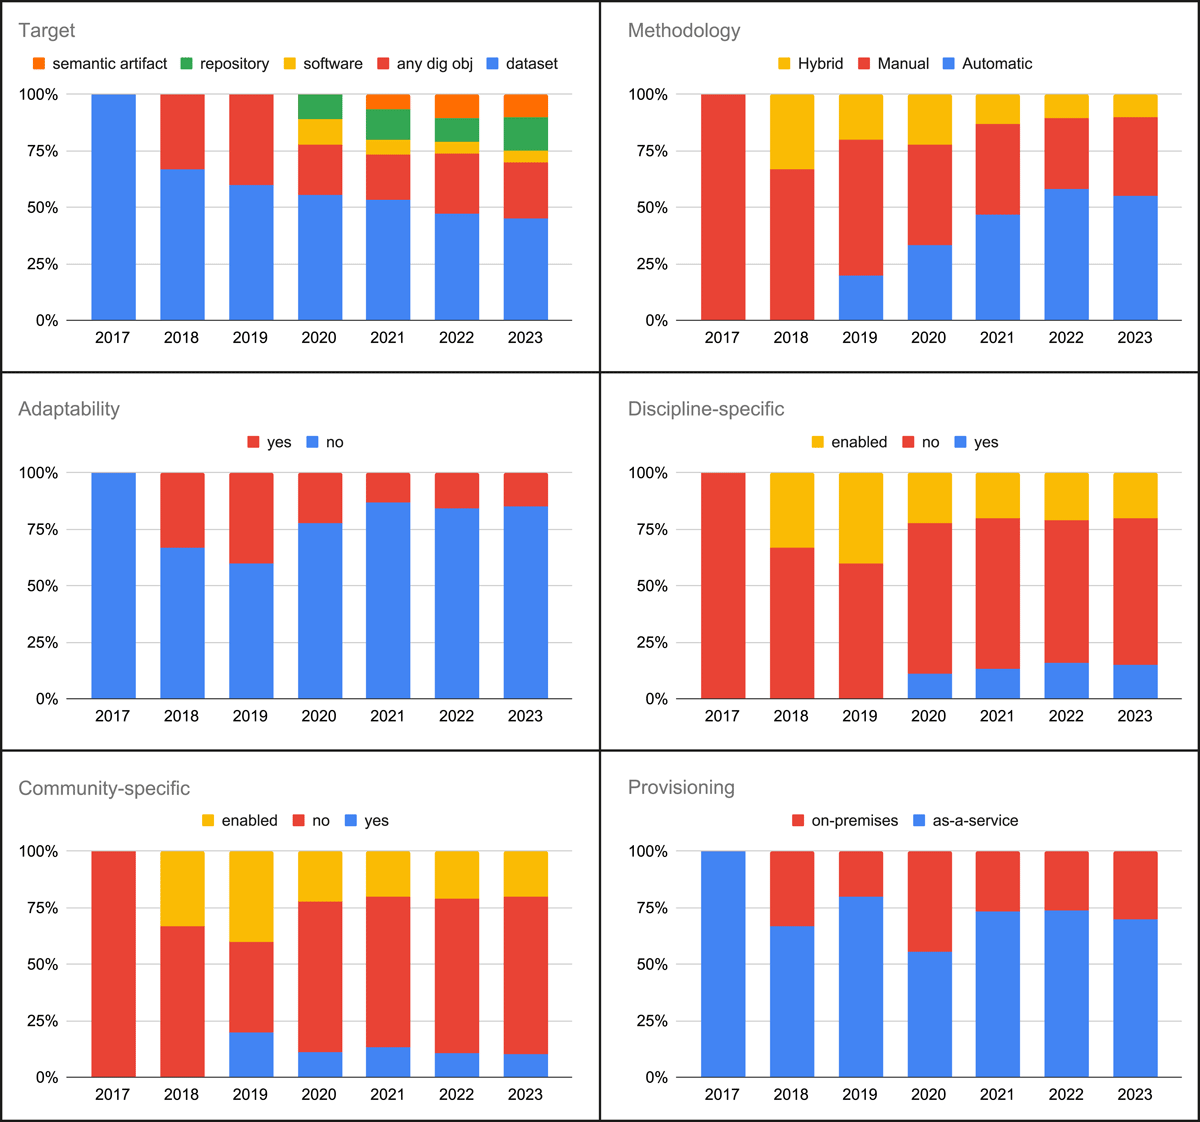
Figure 1
FAIR assessment tools trends.
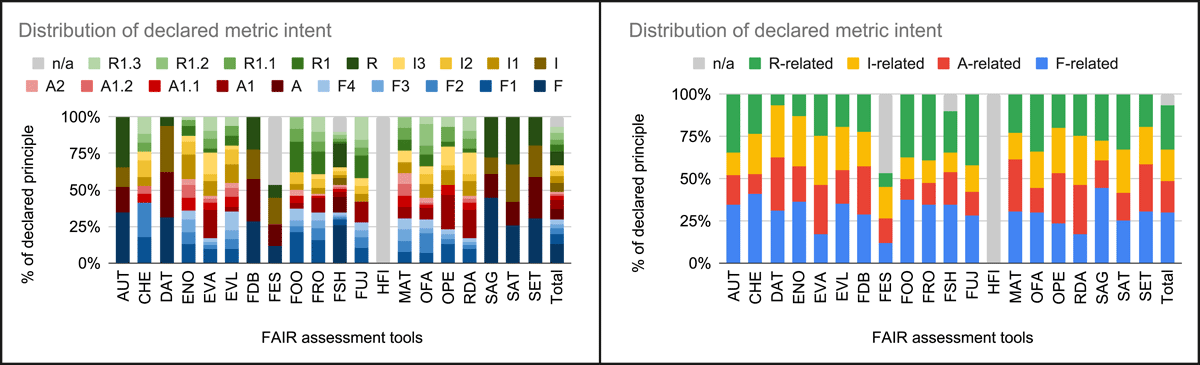
Figure 2
FAIR assessment tools’ declared metric intent distribution. In the left diagram, F, A, I, and R series refer to metrics with declared intent Findable, Accessible, Interoperable, and Reusable rather than a numbered/specific principle. The ‘n/a’ series is for metrics that do not declare an intent referring to a specific principle or even to a letter of the FAIR acronym. In the right diagram, the metrics are aggregated by class of principles, e.g. the F-related metrics include all the ones that in the left diagram are either F, F1, F2, F3 or F4.
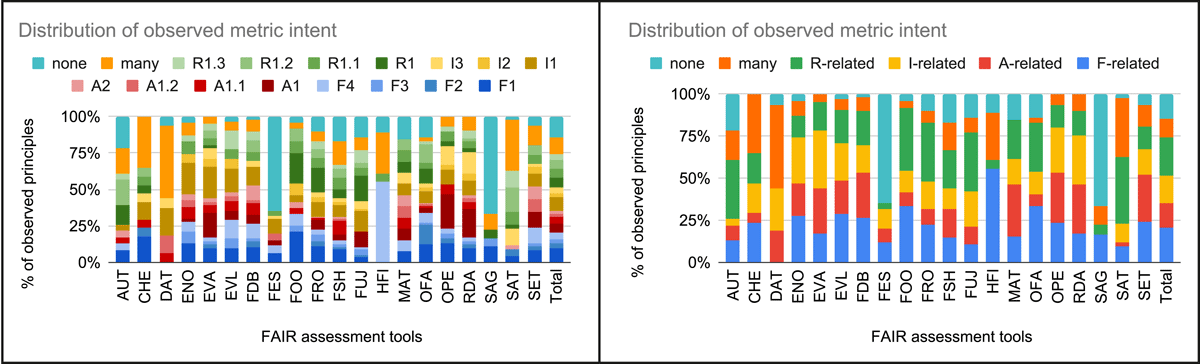
Figure 3
FAIR assessment tools’ observed metric goal distribution. In the left diagram, metrics are associated either with a specific principle, ‘many’ principles or ‘none’ principle. In the right diagram, the metrics associated with a specific principle are aggregated by class of principles, e.g. the R-related metrics include all the ones that in the left diagram are either F1, F2, F3 or F4.
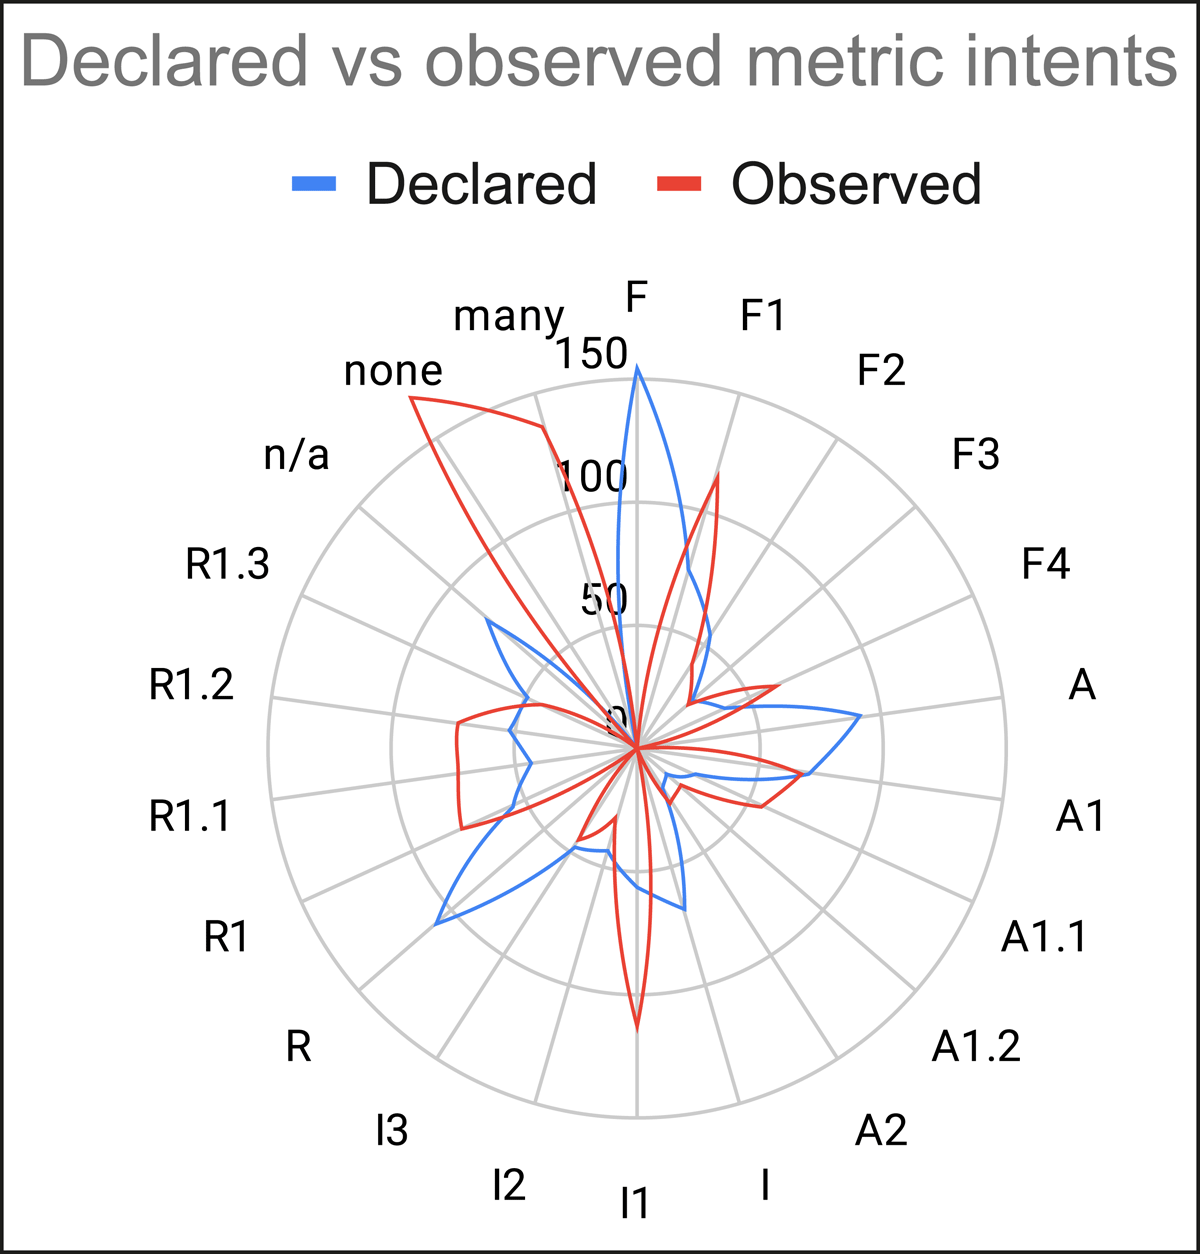
Figure 4
Comparison of the metrics distributions with regard to their declared and observed intent.
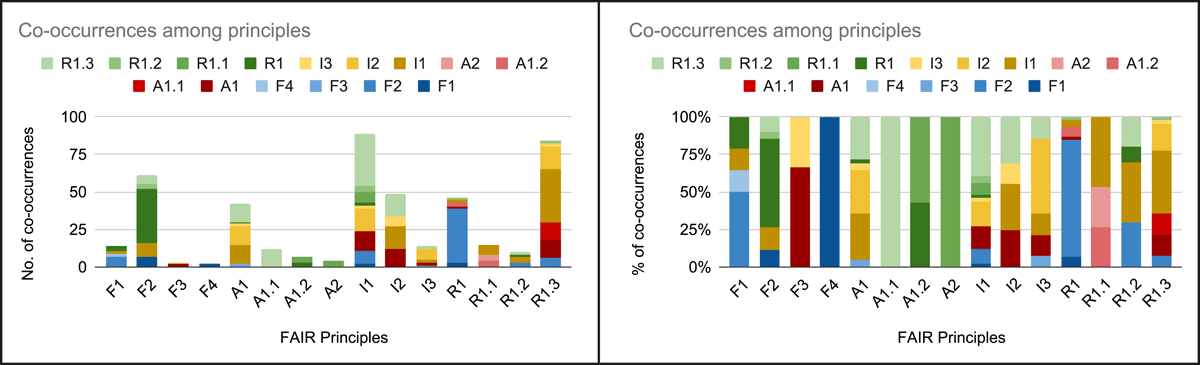
Figure 5
Co-occurrences among metrics observed FAIR principles in numbers and percentages.
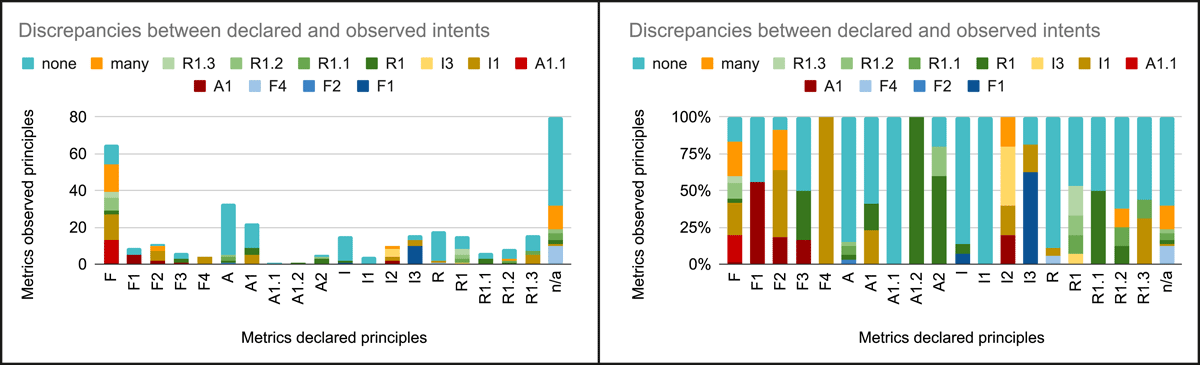
Figure 6
Discrepancies among metrics declared and observed FAIR principles in numbers and percentages.
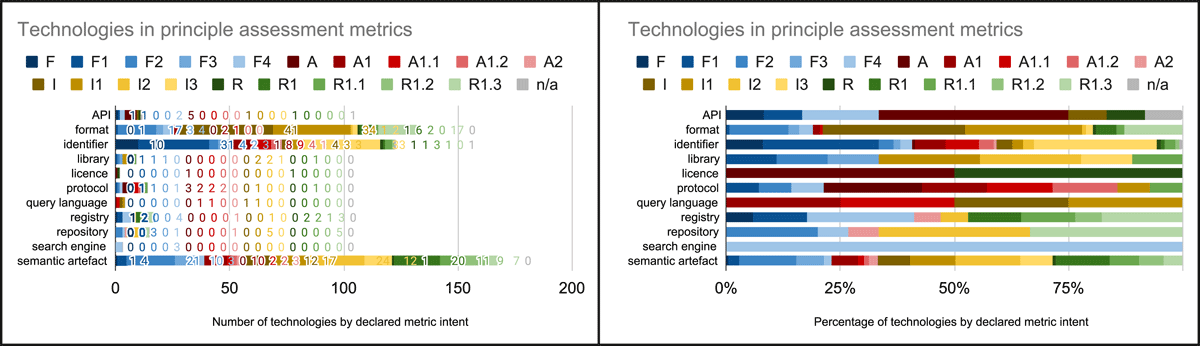
Figure 7
Technology types per declared metric intent.