
1 Introduction
Wilkinson et al. formulated the FAIR guiding principles to support data producers and publishers in dealing with four fundamental challenges in scientific data management and formal scholarly digital publishing, namely Findability, Accessibility, Interoperability, and Reusability (Wilkinson et al. 2016). The principles were minimally defined to keep, as low as possible, the barrier-to-entry for data producers, publishers, and stewards who wish to make their data holdings FAIR. Moreover, the intent was to formulate principles that apply not only to ‘data’ in the conventional sense but also to the algorithms, tools, and workflows that led to that data. All scholarly digital research objects were expected to benefit from applying these principles since all components of the research process must be available to ensure transparency, reusability and, whenever possible, reproducibility. Later, homologous principles were formulated to deal with specific typologies of research products (Goble et al. 2020; Katz, Gruenpeter & Honeyman 2021; Lamprecht et al. 2020).
Such principles were well received by several communities and are nowadays in the research agenda of almost any community dealing with research data despite the absence of concrete implementation details (Jacobsen et al. 2020; Mons et al. 2017). This situation is producing a proliferation of approaches and initiatives related to their interpretation and concrete implementation (Mangione, Candela & Castelli 2022; Thompson et al. 2020). It also requires evaluating the level of FAIRness achieved, which results in a multitude of maturity indicators, metrics, and assessment frameworks, e.g. (Bahim, Dekkers & Wyns 2019; De Miranda Azevedo & Dumontier 2020; Krans et al. 2022).
Having a clear and up-to-date understanding of FAIR assessment practices and approaches helps in perceiving the differences that characterise them, properly interpreting their results, and eventually envisaging new solutions to overcome the limitations affecting the current landscape. This paper analyses a comprehensive set of FAIR assessment tools and the metrics used by these tools for the assessment to highlight the challenges characterising this valuable task. In particular, the research questions this study focuses on are: (i) to highlight the characteristics and trends of the currently existing tools, and (ii) to identify the relationships that exist among the FAIR principles and the approaches exploited to assess them in practice thus to discuss whether the resulting assessment is practical or there are gaps to deal with. A comprehensive ensemble of tools and metrics is needed to respond to these questions. This ensemble was developed by carefully analysing the literature, the information on the web and the actual implementation of tools and metrics. The resulting data set is openly available (see Data Accessibility Statements).
The rest of the paper is organised as follows. Section 2 discusses the related works, namely the surveys and analysis of FAIR assessment tools performed before this study. Section 3 presents the research questions this study focuses on, and the methodology used to respond to them. Section 4 describes the results of the study. Section 5 critically discusses the results by analysing them and providing insights. Finally, Section 6 concludes the paper by summarising the study’s findings. An appendix mainly containing the tabular representation of the data underlying the findings complements the paper.
2 Related Work
Several comparative studies and surveys on the existing FAIR assessment tools can be found in the literature.
Bahim et al. (Bahim, Dekkers & Wyns 2019) conducted a landscape analysis to define FAIR indicators by assessing the approaches and the metrics developed until 2019. They produced a list of twelve tools (The twelve tools analysed were: the ANDS-NECTAR-RDS-FAIR data assessment tool, the DANS-Fairdat, the DANS-Fair enough?, the CSIRO 5-star Data Rating tool, the FAIR Metrics Questionnaire, the Stewardship Maturity Mix, the FAIR Evaluator, the Data Stewardship Wizard, the Checklist for Evaluation of Dataset Fitness for Use, the RDA-SHARC Evaluation, the WMO-Wide Stewardship Maturity Matrix for Climate Data, and the Data Use and Services Maturity Matrix.). They also produced a comparison of the different 148 metrics characterising the selected tools, ultimately presenting a classification of the metrics by FAIR principle and specifically by five dimensions: ‘Findable’, ‘Accessible’, ‘Interoperable’, ‘Reusable’, and ‘Beyond FAIR’.
Peters-von Gehlen et al. (2022) widened the FAIR assessment tool list originating from Bahim, Dekkers and Wyns (2019). By adopting a research data repository’s perspective, they shifted their attention to the different evaluation results obtained by employing five FAIR evaluation tools for assessing the same set of discipline-specific data resources. Their study showed that the evaluation results produced by the selected tools reliably reflected the curation status of the data resources assessed and that the scores, although consistent on the overall FAIRness level, were more likely to be similar among the tools that shared the same manual or automated methodology. They also concluded that even if manual approaches proved to be better suited for capturing contextual information, when focusing on assessing discipline-specific FAIRness there is no FAIR evaluation tool that meets the need, and promising solutions would be envisaging hybrid approaches.
Krans et al. (2022) classified and described ten assessment tools (selected through online searches in June 2020) to highlight the gaps between the FAIR data practices and the ones currently characterising the field of human risk assessment of microplastics and nanomaterials. The ten tools discussed were: FAIRdat, FAIRenough? (no longer available), ARDC FAIR self-assessment, FAIRshake, SATIFYD, FAIR maturity indicators for nanosafety, FAIR evaluator software, RDA-SHARC Simple Grids, GARDIAN (no longer available), and Data Stewardship Wizard. These tools were classified by type, namely ‘online survey’, ‘(semi-)automated’, ‘offline survey’, and ‘other’, and evaluated using two sets of criteria: developer-centred and user-centred. The first characterised the tools binarily based on their extensibility and degree of maturity; the latter distinguished nine user friendliness dimensions (‘expertise’, ‘guidance’, ‘ease of use’, ‘type of input’, ‘applicability’, ‘time investment’, ‘type of output’, ‘detail’, and ‘improvement’) grouped in three sets (‘prerequisites’, ‘use’, and ‘output’). Their study showed that the instruments based on human judgement could not guarantee the consistency of the results even if used by domain experts. In contrast, the (semi-)automated ones were more objective. Overall, they registered a lack of consensus in the score systems and on how FAIRness should be measured.
Sun et al. (2022) focused on comparing three automated FAIR evaluation tools (F-UJI, FAIR Evaluator, and FAIR checker) based on three dimensions: ‘usability’, ‘evaluation metrics’, and ‘metric test results’. They highlighted three significant differences among the tools, which heavily influenced the results: the different understanding of data and metadata identifiers, the different extent of information extraction, and the differences in the metrics implementation.
In this paper, we have extended the previous analyses by including more tools and, above all, by including a concrete study of the metrics that these tools use. The original contribution of the paper consists of a precise analysis of the metrics used for the assessment and what issues arise in FAIRness assessment processes. The aim is to examine the various implementation choices and the challenges that emerge in the FAIR assessment process related to them. These implementation choices are in fact necessary for transitioning from the principle level to the factual check level. Such checks are rule-based and depend on the selection of parameters and methods for verification. Our analysis shows the issues associated with the implementation choices that define the current FAIR assessment process.
3 Methodology
We defined the following research questions to drive the study:
Tool-related research questions
RQ1. What are the aspects characterising existing tools? What are the trends characterising these aspects?
Metric-related research questions
RQ2. Are there any gaps between the FAIR principles coverage and the metrics’ overall coverage emerging from the declared intents?
RQ3. Are there discrepancies between the declared intent of the metrics and the actual aspects assessed? What are the most recurring issues?
RQ4. Which approaches and technologies are the most cited and used by the metrics implementations for each principle?
To reply to these questions, we identified a suitable ensemble of existing tools and metrics. The starting point was the list provided by FAIRassist (https://fairassist.org/). To achieve an up-to-date ensemble of tools, we enriched the tool list by referring to Mangione et al. (2022), by snowballing, and, lastly, by web searching. From the overall resulting list of tools, we removed the no longer running ones and the ones not intended for the assessment of FAIR principles in the strict sense. In particular: the GARDIAN FAIR Metrics, the 5 Star Data Rating Tool, and the FAIR enough? were removed because they are no longer running; the FAIR-Aware, the Data Stewardship Wizard, the Do I-PASS for FAIR, the TRIPLE Training Toolkit, and the CLARIN Metadata Curation Dashboard were removed because they were considered out of scope. Table 1 reports the resulting list of the 20 tools identified and surveyed.
Table 1
List of FAIR assessment tools analysed.
We used several sources to collect the list of existing metrics. In particular, we carefully analysed the specific websites, papers, and any additional documentation characterising the selected tools, including the source code and information deriving from the use of the tools themselves. For the tools that enable users to define their specific metrics, we considered all documented metrics, except those created by users for testing purposes or written in a language other than English. In the case of metrics structured as questions with multiple answers (not just binary), each answer was considered a different metric as the different checks cannot be put into a single formulation. This approach was necessary for capturing the different degrees of FAIRness that the tool creators conceived. The selection process resulted in a data set of 1180 metrics.
Some tools associate each metric with specific principles. To observe the distribution of the metrics and the gaps concerning the FAIR principles, we considered the FAIR principle (or the letter of the FAIR acronym) which were designed to assess, as declared in the papers describing the tools, but also in the source code, and the results of the assessments performed by the tools themselves.
To analyse the metrics for the identification of discrepancies between the declared intent of the metrics and the actual aspects assessed, we adopted a classification approach based on a close reading of the FAIR principles, assigning one or more principles to each metric. This approach was preferred to one envisaging the development of our list of checks, as any such list would merely constitute an additional FAIR interpretation. This process was applied to both the tools that already had principles associated with the metrics and those that did not. We classified each metric under the FAIR principle we deemed the closest, depending on the metric formulation or implementation. We relied on the metrics implementation source code, when available, to better understand the checks performed. The classification is provided in the accompanying data set and it is summarised in Figure 3.
The analysis of the approaches and technologies used by the metrics is based on the metric formulation, their source code, and the results of the assessments performed by the tools. With regard to the approaches, we classified the approach of each metric linked to a specific FAIR principle, as declared by the metric authors, following a bottom to top process. We grouped the metrics by specific FAIR principle and then we created a taxonomy of approaches based on the ones observed in each group (App. A.5). For the technologies, we annotated each metric with the technologies mentioned in the metric formulation, in the results of the assessments performed by the tools, and as observed through a source code review.
4 Results
This section reports the study findings concerning the tool-related and metric-related research questions. Findings are discussed and analysed in Section 5.
4.1 Assessment tools
Table 1 enumerates the 20 FAIR Assessment tools analysed by reporting their name, URL, and the year the tool was initially proposed.
The tools were analysed through the following characteristics: (i) the target, i.e. the digital object the tool focuses on (e.g., dataset, software); (ii) the methodology, i.e. whether the assessment process is manual or automatic; (iii) the adaptability, i.e. whether the assessment process is fixed or can be adapted (specific methods and metrics can be added); (iv) the discipline-specificity, i.e. whether the assessment method is tailored for a specific discipline (or conceived to be) or discipline-agnostic; (v) the community-specificity, i.e. whether the assessment method is tailored for a specific community (or conceived to be) or community-agnostic; (vi) the provisioning, i.e. whether the tool is made available as-a-service or on-premises.
Table 2 shows the differentiation of the analysed tools based on the identified distinguishing characteristics.
Table 2
Differentiation of analysed tools based on identified distinguishing characteristics. The term ‘enabled’ signifies that the configuration allows the addition of new metrics, allowing individuals to include metrics relevant to their discipline or community. The ‘any dig. obj.*’ value means that there is a large number of typologies supported yet this is specialised rather than actually supporting ‘any’.
| TOOL ID | TARGET | METHODOLOGY | ADAPTABILITY | DISCIPLINE SPECIFIC | COMMUNITY SPECIFIC | PROVISIONING |
|---|---|---|---|---|---|---|
| AUT | any dig. obj.* | automatic | no | bioinformatics | no | as-a-service |
| CHE | any dig. obj. | automatic | no | life sciences | no | as-a-service |
| DAT | dataset | manual | no | no | no | as-a-service |
| ENO | dataset | automatic | yes | enabled | enabled | as-a-service |
| EVA | dataset | automatic | no | no | yes | as-a-service |
| EVL | any dig. obj. | automatic | yes | enabled | enabled | as-a-service |
| FDB | dataset | manual | no | no | no | as-a-service |
| FES | repository | manual | no | no | no | on-premises |
| FOO | semantic artefact | automatic | no | no | no | as-a-service |
| FRO | any dig. obj.* | automatic | no | no | no | on-premises |
| FSH | any dig. obj. | hybrid | yes | enabled | enabled | as-a-service |
| FUJ | dataset | automatic | no | no | no | as-a-service |
| HFI | software | automatic | no | no | no | on-premises |
| MAT | repository | hybrid | no | yes | no | on-premises |
| OFA | semantic artefact | automatic | no | no | no | as-a-service |
| OPE | repository | automatic | no | no | yes | as-a-service |
| RDA | dataset | manual | no | no | no | on-premises |
| SAG | dataset | manual | no | no | no | on-premises |
| SAT | dataset | manual | no | no | yes | as-a-service |
| SET | dataset | manual | no | no | no | as-a-service |
By observing the emergence of the identified characteristics over time, from 2017 to 2023, it is possible to highlight trends in the development of tools created for FAIR assessment purposes. Figure 1 depicts these trends.
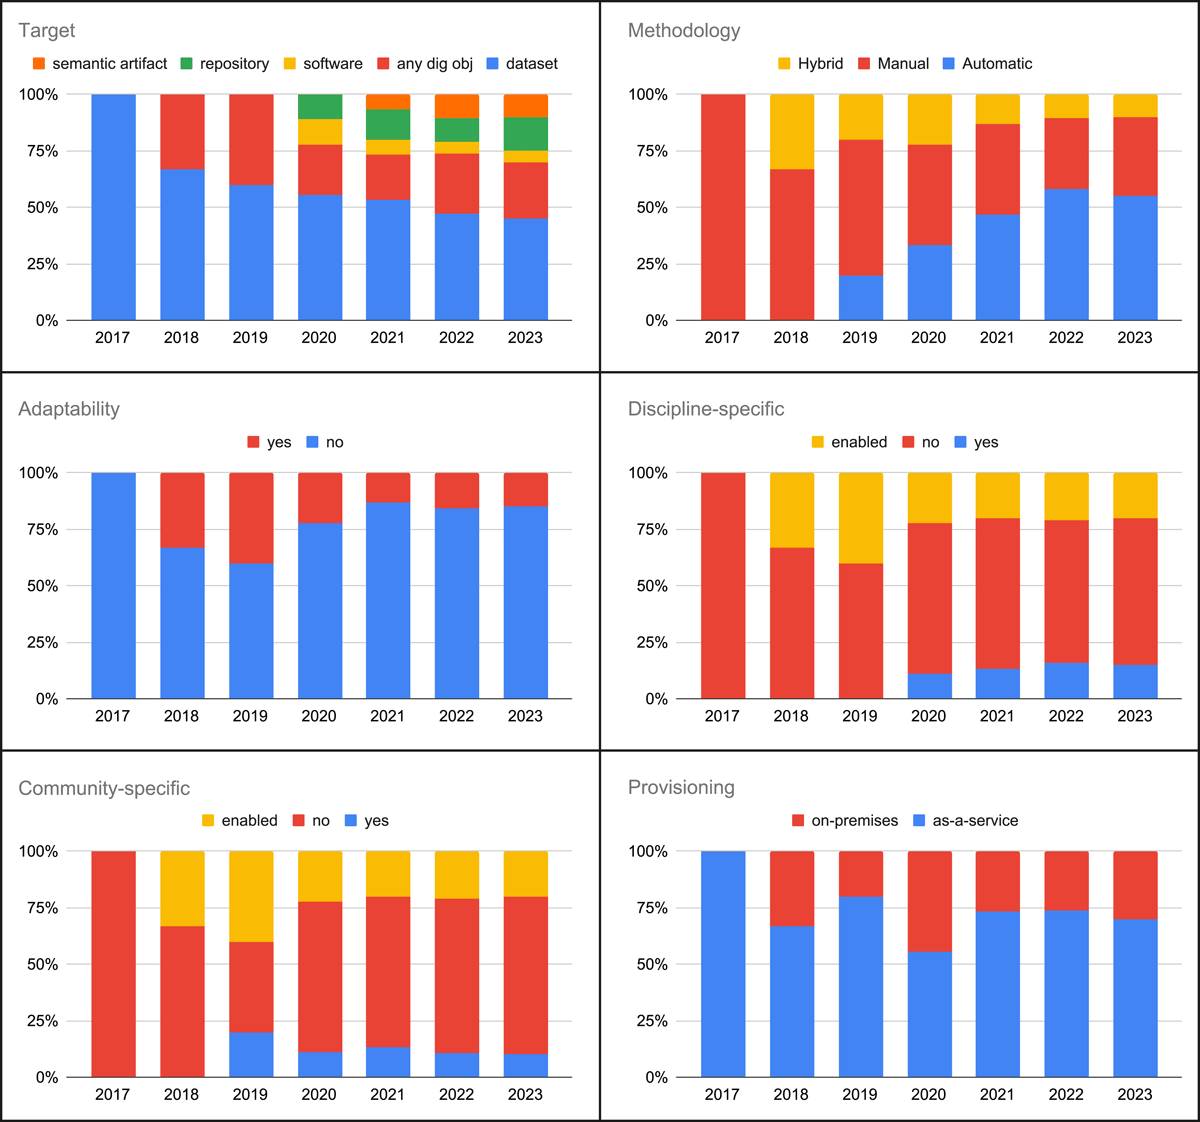
Figure 1
FAIR assessment tools trends.
Target. We observed an increasing variety of digital objects (Figure 1 Target), reflecting the growing awareness of the specificities of different research products stemming from the debates that followed the publication of the FAIR guiding principles. However, 45% of the tools deal with datasets. We assigned the label any dig. obj. (any digital object) to the tools that allow the creation of user-defined metrics, but also when the checks performed are generic enough to be applied notwithstanding the digital object type, e.g., evaluations based on the existence of a persistent identifier such as a DOI and the use of a generic metadata schema, such as the Dublin Core, for describing a digital object. The asterisk that follows the label ‘any dig. obj.’ in Table 2 indicates that, although many types of objects are supported, the tools specifically assess some of them. In particular: (a) AUT deals with datasets, tools, and a combination of them in workflows, and (b) FRO is intended for assessing a specific format of digital objects, namely RO-Crate (Soiland-Reyes et al. 2022), which can package any type of digital object.
Methodology. The tools implement three modes of operation: (i) manual, i.e. if the assessment is performed manually by the user; (ii) automatic, i.e. if it does not require user judgement; (iii) hybrid, i.e. a combination of manual and automated approaches. Manual and hybrid approaches were the first implemented, but over time, automatic approaches were preferred due to the high subjectivity characterising the first two methodologies (Figure 1. Assessment methodology). Fifty-five per cent of the tools implement automatic assessments. Notable exceptions are MAT (2020 – hybrid) and FES (2023 – manual), assessing the FAIRness of a repository and requiring metrics that include organisational aspects, which are not easily measured and whose automation still poses difficulties.
Adaptability. We distinguished tools between (i) non-adaptable (whose metrics are predefined and cannot be extended) and (ii) adaptable (when it is possible to add user-defined metrics). Only three tools of the ensemble are adaptable, namely FSH, EVL, and ENO. EVA was considered a ‘fixed’ tool, although it supports the implementation of plug-ins that specialise the actual checks performed by a given metric. Despite their limitations, the preference for non-adaptable tools is observed to persist over time (Figure 1. Assessment method).
Discipline-specific. A further feature is whether a tool is conceived to assess the FAIRness of discipline-specific research outputs or is discipline agnostic. We grouped three tools as discipline-specific: AUT, CHE, and MAT. While the adaptable tools (FSH, EVL, and ENO) may not include discipline-specific metrics at the moment, they enable such possibility, as well as EVA, since it allows defining custom configurations for the existing assessments. The trend observed is a preference for discipline-agnostic tools (Figure 1. Discipline-specific nature).
Community-specific. Among the tools, some include checks related to community-specific standards (e.g. the OpenAIRE Guidelines) or that allow the possibility of defining community-relevant evaluations. As for the case of discipline-specific tools, the adaptable tools (FSH, EVL, and ENO) also enable community-specific evaluations, as well as EVA. Figure 1. Community-specific nature shows that, in general, community-agnostic solutions were preferred.
Provisioning. The tools are offered following the as-a-service model or as an on-premises application (we included in the latter category the self-assessment questionnaires in a PDF format). While on-premises solutions are still being developed (e.g. python notebooks and libraries), the observed trend is a preference for the as-a-service model (Figure 1. Provisioning).
4.2 Assessment metrics
Existing assessment metrics are analysed to (i) identify gaps between the FAIR principles’ coverage and the metrics’ overall coverage emerging from the declared intents (cf. Section 4.2.1), (ii) highlight discrepancies among metrics intent and observed behaviour concerning FAIR principles and distil the issues leading to the mismatch (cf. Section 4.2.2), and (iii) determine frequent approaches and technologies considered in metrics implementations (cf. Section 4.2.3).
4.2.1 Assessment metrics: gaps with respect to FAIR principles
To identify possible gaps in the FAIR assessment process we observed the distributions of the selected metrics grouped according to the FAIR principle they were designed to assess. Such information was taken from different sources, including the papers describing the tools, other available documentation, the source code, and the use of the tools themselves.
Figure 2 reports the distribution of metrics with respect to the declared target principle, if any, for each tool. Appendix A.1 reports a table with the detailed data. In the left diagram, a metric falls in the F, A, I, and R when it refers only to Findable, Accessible, Interoperable, and Reusable and not to a numbered/specific principle. The ‘n/a’ series is used for counting the metrics that do not declare a reference to a specific principle or even to a letter of the FAIR acronym. In the right diagram, the metrics are aggregated by class of principles, e.g. the F-related metrics include all the ones that in the left diagram are either F, F1, F2, F3 or F4.
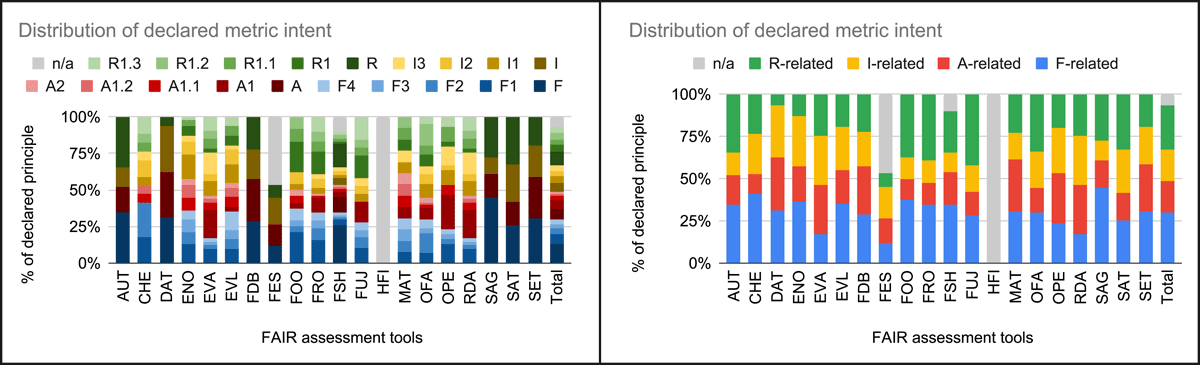
Figure 2
FAIR assessment tools’ declared metric intent distribution. In the left diagram, F, A, I, and R series refer to metrics with declared intent Findable, Accessible, Interoperable, and Reusable rather than a numbered/specific principle. The ‘n/a’ series is for metrics that do not declare an intent referring to a specific principle or even to a letter of the FAIR acronym. In the right diagram, the metrics are aggregated by class of principles, e.g. the F-related metrics include all the ones that in the left diagram are either F, F1, F2, F3 or F4.
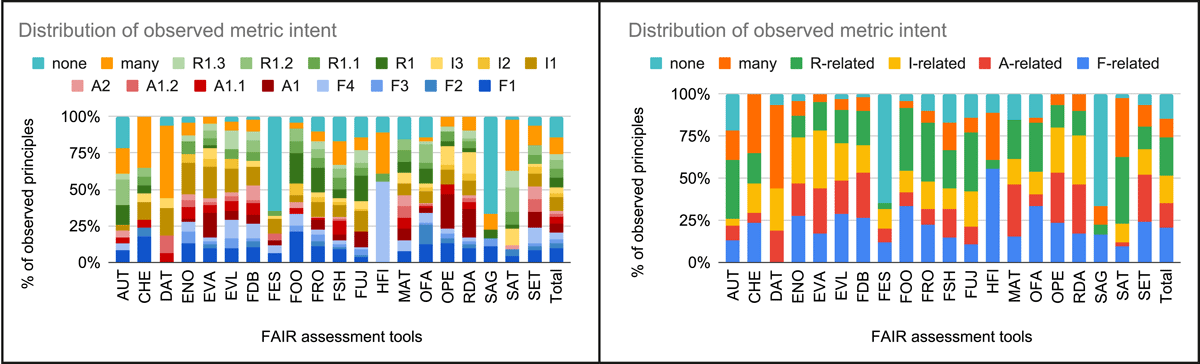
Figure 3
FAIR assessment tools’ observed metric goal distribution. In the left diagram, metrics are associated either with a specific principle, ‘many’ principles or ‘none’ principle. In the right diagram, the metrics associated with a specific principle are aggregated by class of principles, e.g. the R-related metrics include all the ones that in the left diagram are either F1, F2, F3 or F4.
Only 12 tools (CHE, ENO, EVA, EVL, FOO, FRO, FSH, FUJ, MAT, OFA, OPE, RDA) out of 20 identify a specific principle linked to the metrics. The rest either refer only to Findable, Accessible, Interoperable, or Reusable to annotate their metrics (namely, AUT, DAT, FDB, FES, SAG, SAT, SET) or do not refer to specific principles nor letters of the acronym for annotating their metrics (namely, HFI). Even among those tools that make explicit connections, some metrics remain detached from any particular FAIR principle or acronym letter, as indicated with ‘n/a’ in Figure 2 and Table A.1.
The figures also document that assessment metrics exist for each FAIR principle, but not every principle is equally covered, and not all the tools implement metrics for all the principles.
When focusing on the 12 tools explicitly referring to principles in metrics declared intents and considering the total amount of metrics exploited by a given tool to perform the assessment, it is easy to observe that some tools use a larger set of metrics than others. For instance, FSH uses 339 distinct metrics, while MAT uses only 13 distinct metrics. The tools having a lower number of metrics tend to overlook some principles.
The distribution of metrics with respect to their target highlights that, for each principle, some kind of check has been conceived, even though with different numbers. They, in fact, range from the A1.2 minimum (covered by 16 metrics) to the F1 maximum (covered by 76 metrics). It is also to be noted that for each group of principles linked to a letter of the FAIR acronym, the largest number of metrics is concentrated on the first of them. In particular, this is evident for the A group, with 71 metrics focusing on A1 and around 20 for the others.
Four principles are somehow considered by all the tools, namely F1, F2, I1, and R1.1. While for F1, F2, and I1, the tools use many metrics for their assessment, for R1.1, few metrics were exploited.
Four principles experience relatively lower emphasis, namely A1.2, F3, A1.1, and A2, with fewer metrics dedicated to their assessment. While at the tool level, A1.2, A2, R1.2, and R1.3 are principles that remain unexplored by several of them. A1.2 is not assessed at all by four tools out of 12; A2 is not assessed at all by three tools out of 12; R1.2 is not assessed at all by three tools out of 12; R1.3 is not assessed at all by two tools out of 12.
4.2.2 Assessment metrics: observed behaviours and FAIR principles discrepancies
In addition to the metrics not linked to a specific FAIR principle, we noticed that the implementation of some metrics was misaligned with the principle it declared to target. The implementation term is used with a comprehensive meaning thus including metrics from manual tools and metrics from automatic tools. By analysing the implementation of the metrics, we assigned to each the FAIR principle or set of principles sounding closer.
We identified three discrepancy cases: (i) from a FAIR principle to another, (ii) from a letter of the FAIR acronym to a FAIR principle of a different letter of the acronym (e.g. from A to R1.1), and (iii) from any declared or undeclared FAIR principle to a formulation that we consider beyond FAIRness (‘none’ in Figure 3).
An example of a metric with a discrepancy from one FAIR principle to another is ‘Data access information is machine readable’ declared for the assessment of A1, but rather attributable to I1. Likewise, the metric ‘Metadata is given in a way major search engines can ingest it for their catalogues (JSON-LD, Dublin Core, RDFa)’, declared for F4, can be rather linked to I1, as it leverages a serialisation point of view.
The metric ‘Which of the usage licenses provided by EASY did you choose in order to comply with the access rights attached to the data? Open access (CC0)’ with only the letter ‘A’ declared is instead a case in which the assessment concerns a different principle (i.e. R1.1).
Regarding the discrepancies from any declared or undeclared FAIR principle to a formulation that we consider beyond FAIRness, examples are the metrics ‘Tutorials for the tool are available on the tools homepage’ and ‘The tool’s compatibility information is provided’.
In addition to the three identified types of discrepancies, we also encountered metrics that were not initially assigned a FAIR principle or corresponding letter. However, we mapped these metrics to one of the FAIR principles. An example is the metric ‘Available in a standard machine-readable format’, attributable to I1. The latter case is indicative of how wide the implementation spectrum of the FAIRness assessment can be, to the point of distancing particularly far from the formulation of the principles themselves. These metrics that we have called ‘beyond FAIRness’ do not necessarily betray the objective of the principles, but for sure they ask for technologies or solutions which cannot be strictly considered related to FAIR principles.
Figure 3 shows the distribution of all the metrics in our sample resulting from the analysis and assignment to FAIR principles activity. Appendix A.2 reports the table with the detailed data.
This figure confirms that (a) all the principles are somehow assessed, (b) few tools assess all the principles (namely, EVA, FSH, OFA, and RDA), (c) there is a significant amount of metrics (136 out of 1180) that refer to more than one principle at the same time (the ‘many’), and (d) there is a significant amount of metrics (170 out of 1180) that sounds far from the FAIR principles at all (the ‘none’).
Figure 4 depicts the distribution of declared (Figure 2, detailed data in Appendix A.1) and observed (Figure 3, detailed data in Appendix A.2) metrics intent with respect to FAIR principles. Apart from the absence of metrics referring to one of the overall areas of FAIR, the distribution of the metrics’ observed intents highlights the great number of metrics that either refer to many FAIR principles or any. Concerning the principles, the graph shows a significant growth in the number of metrics assessing F1 (from 76 to 114), F4 (from 39 to 62), A1.1 (from 26 to 56), I1 (from 56 to 113), R1 (from 56 to 79), R1.1 (from 44 to 73), and R1.2 (from 52 to 74). All in all, for 835 metrics out of the 1180 analysed, the declared metric intent and the observed metric intent correspond (i.e. if (i) the referred principle corresponds, or (ii) the declared intent is either F, A, I, or R while the observed intent is a specific principle of the same class). The cases of misalignment are carefully discussed in the remainder of the section.
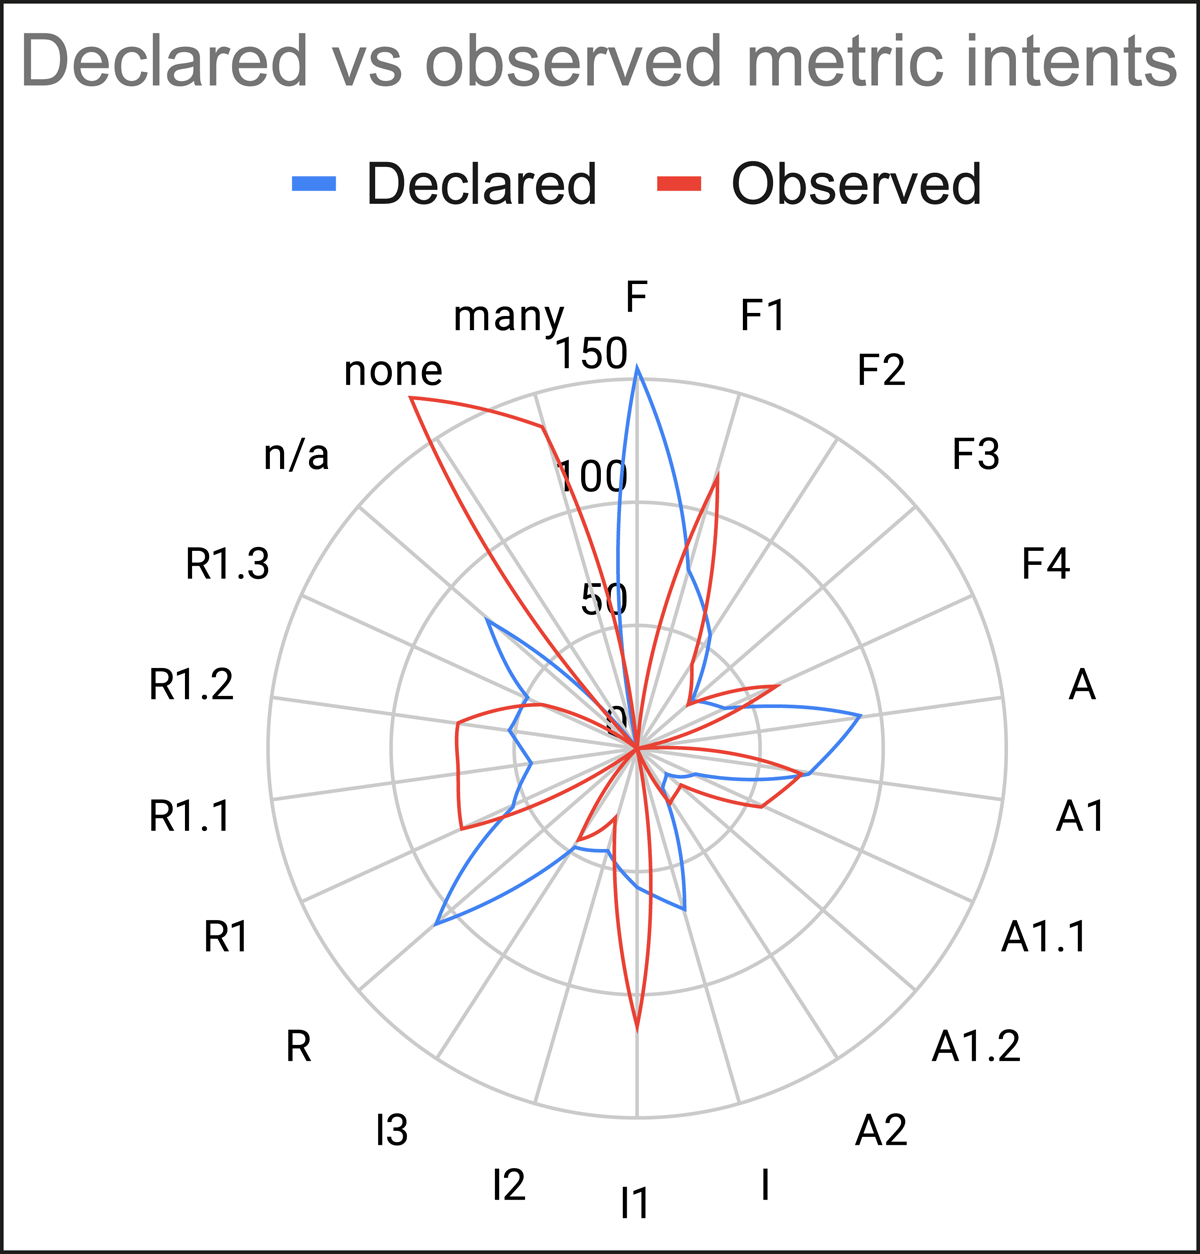
Figure 4
Comparison of the metrics distributions with regard to their declared and observed intent.
While the declared metrics intent is always linked to one principle only – or even to only one letter of the FAIR acronym – we noted that 136 metrics can be related to more than one FAIR principle at once. These correspond to the ‘many’ series in Figure 4 counting the number of times we associated more than one FAIR principle to a metric of a tool (see also Table A.2, column ‘many’).
Figure 5 shows the distribution of these co-occurrences among the FAIR principles we observed (see also Table A.3 in Section A.3).
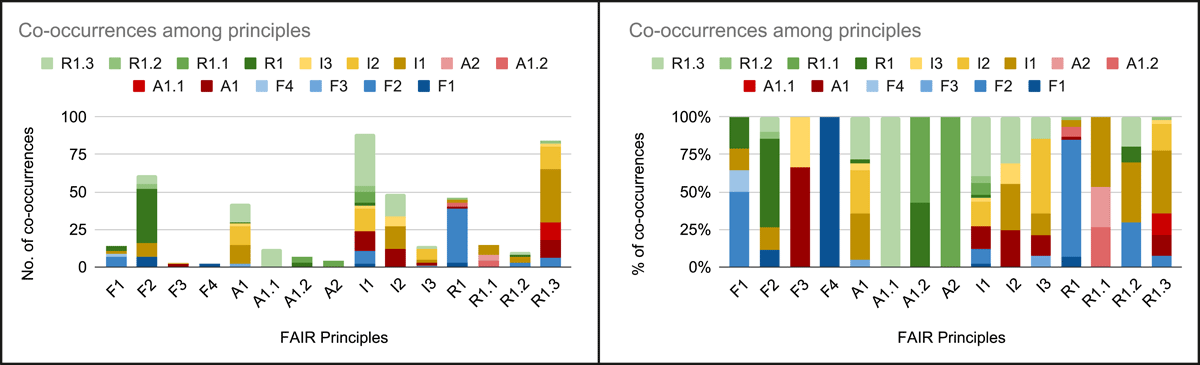
Figure 5
Co-occurrences among metrics observed FAIR principles in numbers and percentages.
Such co-occurrences involve all FAIR principles. In some cases, assessment metrics on a specific principle are also considered to be about many diverse principles, notably: (i) metrics dealing with I1 also deal with either F1, F2, A1, I2, I3, or a Reproducibility-related principle, (ii) metrics dealing with R1.3 also deal with either F2, A1, A1.1, an Interoperability principle or R1.2. The number of different principles we found co-occurring with I1 hints at the importance given to the machine-readability of metadata, which is a recurrent parameter in the assessments, particularly for automated ones, so that it can be considered an implementation prerequisite notwithstanding the FAIR guidelines. The fact that R1.3 is the second principle for the number of co-occurrences with other principles is an indicator of the role of the communities in shaping actual practices and workflows.
In some cases, there is a significant number of co-occurrences between two principles, e.g. we observed that many metrics deal with both F2 and R1 (36) or I1 and R1.3 (35). The co-occurrences between F2 and R1 are strictly connected to the formulation of the principles and symptomatic of a missing clear demarcation between the two. The case of metrics with both I1 and R1.3 is ascribable to the overlapping of the ubiquitous machine-readable requirement and the actual implementation of machine-readable solutions by communities of practice.
We also observed metrics that we could not link to any FAIR principle (Figure 3 ‘none’ series) because of the parameters used in the assessment. Examples of metrics we considered not matching any FAIR principle include (a) those focusing on the openness of the object since ‘FAIR is not equal to open’ (Mons et al. 2017), (b) those focusing on the downloadability of the object, (c) those focusing on the long-term availability of the object since A2 only requires that the metadata of the object must be preserved, (d) those relying on the concept of data or metadata validity, e.g. a metric verifying that the contact information given is valid, (e) those focusing on trustworthiness (for repositories), and (f) those focusing on multilingualism of the digital object.
To identify the discrepancies between declared intents and observed behaviour, we considered misaligned the metrics with a different FAIR principle declared than the one we observed. In addition, all the metrics counted as none in Figure 3 are discrepancies since they include concepts beyond FAIRness assessment. For the metrics that are referred only to a letter of the FAIR acronym, we based the misalignments on the discordance with the FAIR principle letter. Concerning the metrics linked to more than one FAIR principle, we considered as discrepancies only the cases where the principle or letter declared does not match any of the observed possibilities. Figure 6 documents these discrepancies (detailed data are in Appendix A.4).
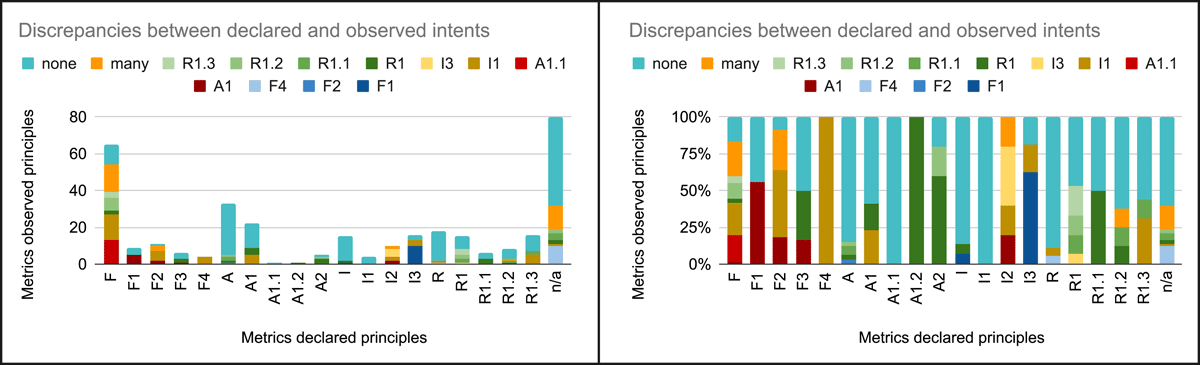
Figure 6
Discrepancies among metrics declared and observed FAIR principles in numbers and percentages.
When looking at the observed intent, including the metrics in the ‘many’ column, all FAIR principles are in the codomain of the mismatches, except for A1.2 and A2 (in fact, there is no column for that in Figure 6). Moreover, misaligned metrics for Findability and Accessibility are always relocated to other letters of the acronym, implying a higher tendency to confusion in the assessment of F and A principles.
While it is possible to observe misalignments in metrics implementations that we linked to more than one principle, no such cases involve accessibility-oriented declared metrics. For metrics pertaining to the other FAIR areas, there are a few cases, mainly involving findability and metrics with no declared intent. No metrics that we could not link to a FAIR principle were found for F4, A1.2, and I2 principles, indicating that the checks on indexing (F4), authentication and authorisation (A1.2), and use of vocabularies (I2) tend to be more unambiguous.
Concerning metrics with findability-oriented declared intents, we did not observe misalignments with any findability principle. Still, we found misalignments with accessibility, interoperability, and reusability principles, including metrics that can be linked with more than one principle and metrics that we could not associate with any principle. Accessibility-related misalignments concern A1 (9), with references to the use of standard protocols to access metadata and to the resolvability of an identifier, and A1.1 (12), because of references to free accessibility to a digital object. Interoperability-related misalignment concern I1 (23) and are linked to references to machine-readability (e.g. the presence of machine-readable metadata, such as the JSON-LD format, or structured metadata in general) and semantic resources (e.g. the use of controlled vocabularies or knowledge representation languages like RDF). Reusability-related misalignments concern R1 (4), because of references to metadata that cannot be easily linked to a findability aim (e.g. the size of a digital object), R1.2 (7), as we observed references to versioning and provenance information, and R1.3 (3), for references to community standards (e.g. community accepted terminologies). Concerning the findability-oriented metrics we classify as ‘many’ (18), we observed they intertwine concepts pertaining to A1, A1.1, I1, I2, or R1.3. About the metrics we could not link to a principle (19), they include references to parameters such as free downloadability and the existence of a landing page.
Concerning metrics with accessibility-oriented declared intents, we did not observe misalignments with an accessibility principle. There is one misalignment with F2, regarding the existence of a title associated with a digital object, and few with I1 (5) because of references to the machine-readability (e.g. machine-readable access information) and semantic artefacts (e.g. controlled vocabularies for access terms). The majority of misalignments are observed with reusability, as we observed metrics involving R1 (9), with references to metadata elements related to access conditions (e.g. dc:rights) and to the current status of a digital object (e.g. owl:deprecated), R1.1 (2), because of mentions to the presence of a licence (e.g. creative commons licence), and R1.2 (2), since there are references to versioning information (e.g. if metadata on versioning information is provided). There are also metrics (43) that we cannot link to any principle, which refer to parameters such as the availability of tutorials, long-term preservation of digital objects, and free downloadability.
Concerning metrics with interoperability-oriented declared intents mismatches concern F1 (11) with references to the use of identifiers (e.g. URI), A1 (2) because of references to the resolvability of a metadata element identifier, I1 (5) for checks limited to the scope of I1 even if declared for assessing I2 or I3 (e.g. metadata represented in an RDF serialisation), and I3 (4) because of checks only aimed at verifying that other semantic resources are used even if declared to assess I2. We also observed metrics declared to assess I2 (2) linked to multiple principles; they intertwine aspects pertaining to F2, I1, and R1.3. Except for I2, there are 20 interoperability-oriented metrics that we could not link to any principle (e.g. citing the availability of source code in the case of software).
Concerning metrics with reusability-oriented declared intents, mismatches regard F4 (1) because of a reference to software hosted in a repository, I1 (6) with references to machine-readability, specific semantic artefacts (e.g. Schema.org), or to lists of formats, and I3 (1) as there is a reference to ontology elements defined through a property restriction or an equivalent class, but they mainly involve reusability principles. Looking at reusability to reusability mismatches: (i) for R1 declared metrics, we observed mismatches with R1.1 (2) concerning licences, R1.2 (2) because of references to provenance information, and R1.3 (3) since there are references to community-specific or domain-specific semantic artefacts (e.g. Human Phenotype Ontology); (ii) for R1.1 declared metrics, there are mismatches concerning R1 (3) since there are references to access rights metadata elements (e.g. cc:morePermissions); (iii) for R1.2 declared metrics, we observed mismatches concerning R1 (1) and R1.1 (1) because of references to contact and licence information respectively; (iv) for R1.3 declared metrics mismatches concern R1.1 (2) since there are references to licences. Only in the case of one R1.2 declared metric we observed a link with more than one FAIR principle, F2 and R1, because of references to citation information. The reusability declared metrics we could not link to any principle (40) concern references such as the availability of helpdesk support or the existence of a rationale among the documentation provided for a digital object.
Concerning the metrics whose intent was not declared (80), we observed that 40% (32) are linked to at least one principle, while the remaining 60% (48) are beyond FAIRness. In this set of metrics we found metrics concerning F4 (10), e.g. verifying if a software source code is in a registry; I1 (1) a metric verifying the availability of a standard machine-readable format; R1 (2), e.g. for a reference to terms of service; R1.1 (4), because of references to licences; R1.2 (2), e.g. a metric verifies if all the steps to reproduce the data are provided. Some metrics can be linked to more than one principle (13); these metrics intertwin aspects pertaining to F2, F3, I1, I2, I3, R1, and R1.2. An example is a reference to citation information, which can be linked to F2 and R1.
4.2.3 Assessment metrics: approaches and technologies
Having observed that assessment metrics have been proposed for each FAIR principle, it is important to understand how these metrics have been formulated in practice in terms of approaches and technologies with respect to the specific principles they target.
Analysing the metrics explicitly having one of the FAIR principles as a target of their declared intent (cf. Section 4.2.1), it emerged that some (101 out of 677) are simply implemented by repeating the principle formulation or part of it. These metrics do not give any help or indication to the specific assessment task that remains as generic and open to diverse interpretations as the principle formulation is. The rest of the implementations are summarised in Appendix A.5 together with concrete examples to offer an overview of the wealth of approaches proposed for implementing FAIR assessment rules. These approaches include identifier-centred ones (e.g. checking whether the identifier is compliant with a given format, belongs to a list of controlled values or can be successfully resolved), metadata-element centred ones (e.g. verifying the presence of a specific metadata element), metadata-value centred ones (e.g. verify if a specific value or string is used for compiling a given metadata element), service-based ones (e.g. checking whether an object can be found by a search engine or a registry). All approaches involve more than one FAIR area, except for: (a) policy-centred approaches (i.e. looking for the existence of a policy regarding the identifier persistency) for F1, (b) documentation-centred approaches (i.e. an URL to a document describing the required assessment feature), only used for A1.1, A1.2, and A2 verifications, (c) service-centred approaches (i.e. the presence of a given feature in a registry or in a repository), only used for F4, and (d) metadata schema-centred approaches (i.e. verify that a schema rather than an element of it is used), used for R1.3.
Approaches based on the label of the metadata element employed to describe an object, and those based on an identifier, assigned to the object or identifying a metadata element, are the most prevalent. The former is utilised for assessing 14 out of 15 principles (with the exception of A2), while the latter is applied in the assessment of 13 out of 15 principles (excluding F4 and A2).
By analysing the metrics and, when possible, their implementation, we identified 535 metrics mentioning or using technologies for the specific assessment purpose, with four of them referring only to the generic use of linked data. Of the 535 metrics, 174 declare to assess findability, 92 accessibility, 120 interoperability, 147 reusability, and two are not explicitly linked with any FAIR principle or area. Overall, these metrics refer to 215 distinct technologies (the term ‘technology’ is used in its widest acceptation thus including very diverse typologies ranging from (meta)data formats to standards, semantic technologies, protocols, and services). These do not include a generic reference to the IANA media types mentioned by one metric, which alone are 2007. Selected technologies can be categorised as (i) application programming interfaces (referred by 19 metrics), (ii) formats (referred by 91 metrics), (iii) identifiers (referred by 184 metrics), (iv) software libraries (referred by 22 metrics), (v) licences (referred by two metrics), (vi) semantic artefacts (referred by 291 metrics), (vii) protocols (referred by 29 metrics), (viii) query languages (referred by 5 metrics), (ix) registries (referred by 28 metrics), (x) repositories (referred by 14 metrics), and (xi) search engines (referred by 5 metrics). When referring to the number of metrics per technology class, it should be noted that each metric can mention or use one or more technologies.
Figure 7 depicts how these technologies are exploited across the principles using the metric’s declared intent for classifying the technology.
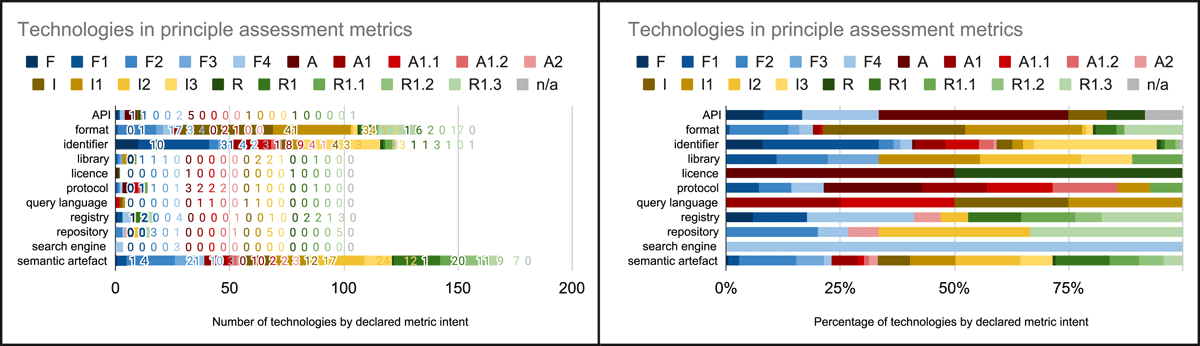
Figure 7
Technology types per declared metric intent.
The most cited or used technologies in the metrics or their implementations are semantic artefacts and identifiers. In particular, Dublin Core and Schema.org are the most mentioned, followed by standards related to knowledge representation languages (Web Ontology Language and Resource Description Framework) and ontologies (Ontology Metadata Vocabulary and Metadata for Ontology Description). The most cited identifier is the uniform resource locator (URL), followed by mentions of uniform resource identifiers (even if technically all URLs are URIs) and, among persistent identifiers, digital object identifiers (DOI).
Semantic artefacts are among the most cited for findability assessments (e.g., Dublin Core, Schema.org, Web Ontology Language, Metadata for Ontology Description, Ontology Metadata Vocabulary, Friend of a Friend, and Vann), followed by identifiers (URL, DOI, URI).
Identifiers are the most cited technologies for accessibility assessments (URL, URI, Handle, DOI, InChi key), followed by protocols (HTTP, OAI-PMH), semantic artefacts (Web Ontology Language, Dublin Core), and formats (XML).
The most mentioned technologies for interoperability assessments are semantic artefacts (Ontology Metadata Vocabulary, Dublin Core, Friend of a Friend, Web Ontology Language) and formats (JSON-LD, XML, RDF/XML, turtle), followed by identifiers (URI, DOI, Handle).
For reusability assessments, besides Dublin Core, Schema.org, Metadata for Ontology Description (MOD), Datacite metadata schema, and Open Graph, also figure semantic artefacts that are specific for provenance (Provenance Ontology and Provenance, Authoring and Versioning) and licensing (Creative Commons Rights Expression Language). Identifiers (URLs) and formats (XML) are also among the most used technologies for reusability purposes.
Ultimately, HTTP-based and linked data technologies are the most used technologies in the metrics, either if considering all metrics at once or just focusing on a single dimension of the FAIR principles.
5 Discussion
The current state of FAIR assessment practices is characterised by different issues, linked to the way the assessment is performed both at a tool and metric level. In the remainder of this section, we critically discuss what emerged in Section 4 concerning assessment tools and assessment metrics.
5.1 Assessment tools
The variety of the tools and their characteristics discussed in Section 4.1 demonstrates the various flavours of solutions that can be envisaged for FAIR assessment. This variety is due to several factors, namely (a) the willingness to assess diverse objects (from any digital object to software), (b) the need to rely on either automatic, manual or hybrid approaches, (c) the necessity to respond to specific settings by adaptability or by being natively designed to be discipline-specific or community-specific. This denotes a certain discretionality in the interpretation and application of the principles themselves, in addition to producing different results and scores for the same product (Krans et al. 2022). In other words, the aspirational formulation of the FAIR principles is hardly reconcilable with punctual measurement.
The characteristics of the tools and their assessment approaches impact assessment tasks and results. Manual assessment tools rely on the assessor’s knowledge, so they do not typically need to be as specific as the automated ones, e.g. when citing a specific technology expected to be exploited to implement a principle, they do not have to clarify how that technology is expected to be used thus catering for diverse interpretations from different assessors. Manual assessment practices tend to be subjective, making it challenging to achieve a unanimous consensus on results. Automatic assessment tools require that (meta)data are machine-readable and only apparently solve the subjectivity issue. While it is true that automatic assessments have to rely on a defined and granular process, which does not leave space for interpretations, every automated tool actually proposes its own FAIRness implementation by defining the granular process itself, especially those tools that do not allow the creation and integration of user-defined metrics. Consequently, the assessment process is objective, but the results are still subjective and biassed by the specific FAIR principles interpretation implemented by the tool developer.
Although the trends observed for tools characteristics in Section 4.1 seems to suggest some tendencies (namely, in the last years more automatic tools than manual ones were developed, more non-adaptable tools than adaptable ones were released, and discipline-agnostic and community-agnostic were emerging over the others) it is almost impossible to figure out whether tools with these characteristics are actually better serving the needs of communities than others. The specific nature of FAIRness assessment is likely to promote the development of tools where community-specific FAIR implementation choices can be easily and immediately vehiculated into assessment pipelines, no matter the tool design decisions regarding methodology, adaptability, etc.
5.2 Assessment metrics
The following three subsections retrace the analysis of assessment metrics as discussed in Section 4.2 subsections to give some reasoning about them. In particular, they elaborate on the findings stemming from the analysis of the gaps between declared metrics intents and the FAIR principles, the discrepancies between declared intents and observed behaviours, and the set of technologies cited for assessing FAIRness, respectively.
5.2.1 Assessment approaches: gaps with respect to FAIR principles
The results reported in Section 4.2.1 highlighted the apparently comprehensive coverage of proposed metrics with respect to principles, the fuzziness of some metrics as well as the variety of metrics implementations for assessing the same principle.
Regarding the coverage, the fact that there exist metrics to assess any principle while the number of metrics per principle and per tool is diverse depends on the principle and tool characteristics. It does not guarantee that all principles are equally assessed. Some principles are multifaceted by formulation, which might lead to many metrics to assess them. This is the case of F1 requiring uniqueness and persistence of identifiers; the number of metrics dedicated to assessing it was the highest we found (Table A.3). However, F1 also has the ‘(Meta)data’ multifaceted formulation that is occurring in many other principles without leading to a proliferation of assessment metrics. R1.1 is similar to F1 since it has the (meta)data aspect as well as the accessibility and intelligibility of the licence, yet this is not causing the proliferation of metrics. In contrast with these two principles that are explicitly assessed by all the tools declaring an association among metrics and principles (together with F2 and I1), there are multifaceted principles, like A1.2 and R1.2, that were not explicitly assessed by some tools, actually by automatic tools that are probably facing issues in assessing them programmatically. This diversity of approaches for assessing the same principle further demonstrates the gaps among the principles and their many implementations, thus making any attempt to assess FAIRness in absolute terms almost impossible and meaningless.
Regarding the fuzziness, we observed metrics that either replicate or rephrase the principle itself, thus remaining as generic as the principles are. The effectiveness of these metrics is also limited in the case of manual assessment tools. In practice, using these metrics, the actual assessment check remains hidden either in the assessor’s understanding or in the tool implementation.
Regarding the variety of implementations, every implementation of a metric inevitably comes with implementation choices impacting the scope of cases passing the assessment check. In fact, it is not feasible to implement metrics capturing all the different real-world cases that can be considered suitable for a positive assessment of a given principle. Consequently, even if ‘FAIR is not equal to RDF, Linked Data, or the Semantic Web’ (Mons et al. 2017), linked data technologies are understandably among the main adopted solutions for creating assessment metric implementations. However, the reuse of common implementations across tools is not promoted or facilitated; FAIR Implementation Profiles (FIP) (Schultes et al. 2020) and metadata templates (Musen et al. 2022) could facilitate this by identifying sets of community standards and requirements to be then exploited by various tools. The availability of ‘implementation profiles’ could help to deal with the principles requiring ‘rich metadata’ (namely F2 and R1), whose dedicated metrics seem quite poor for both discoverability and reusability aspects.
5.2.2 Assessment metrics: observed behaviours and FAIR principles discrepancies
The results reported in Section 4.2.2 revealed 345 misaligned metrics (Figure 6, Table A.4). Overall, we found metrics that seemed to be very discretionary and not immediately adhering to the FAIR principles, also injecting in assessment pipelines checks going beyond FAIRness. Although these misalignments result from our reading of the FAIR principles, they reveal the following recurring issues characterising metrics implementations realising surprising/unexpected interpretations of FAIR principles aspects.
Access rights. Checks verifying the existence of access rights or access condition metadata are used for assessing accessibility, in particular, the A1 principle. This is problematic because (a) the accessibility principles focus on something different, e.g. the protocols used and the long-term availability of (meta)data, and (b) they overlook the equal treatment A1 envisages for both data and metadata.
Long-term preservation. It is used to assess digital objects rather than just metadata (as requested by A2). In particular, long-term preservation-oriented metrics were proposed for assessing accessibility and reusability (R1.3), thus introducing an extensive interpretation of principles requiring (domain-oriented and community-oriented) standardised way for accessing the metadata.
Openness and free downloadability. These recur among the metrics and are also used contextually for assessing adherence to community standards (R1.3). When used alone, we observed that openness-related metrics are employed for assessing reusability, while free-download-related metrics are used for assessing findability and accessibility (in particular for A1.1). Strictly speaking, it was already clarified that none of the FAIR principles necessitate data being ‘open’ or ‘free’ (Mons et al. 2017). Nonetheless, there is a tendency to give a positive, or more positive, assessment when the object is open. While this is in line with the general intentions of the principles (increasing reusability and re-use of data or other research products), this may be at odds with the need to protect certain types of data (e.g. sensitive data, commercial data, etc.).
Machine-readability. This metadata characteristic is found in metrics assessing findability (F2, F4), accessibility (A1), and reusability (R1.3). As the FAIR principles were conceived for lowering the barriers of data discovery and reuse for both humans and machines, machine-readability is at the very core of the requirements for the FAIRification of a research object. While it is understandably emphasised across the assessment metrics, the concept is frequently used as an additional assessment parameter in metrics assessing other principles rather than the ones defined for interoperability.
Resolvability of identifiers. This aspect characterises metrics assessing findability (specifically for F1, F2, and F3) and interoperability (I2). While resolvability is widely associated with persistent and unique identifiers and is indeed a desirable characteristic, we argue that it is not inherently connected to an identifier itself. URNs are a typical example of this. In the context of the FAIR principles, resolvability should be considered an aspect of accessibility, specifically related to A1, which concerns retrievability through an identifier and the use of a standardised communication protocol.
Validity. Metadata or information validity is used for assessing findability, accessibility, interoperability (specifically I3), and reusability (in particular R1), i.e. FAIR aspects that call for ‘rich’ metadata or metadata suitable for a certain scope. However, although metadata is indeed expected to be ‘valid’ to play their envisaged role, in reality, FAIR advocates and requires a plurality of metadata to facilitate the exploitation of the objects in a wider variety of contexts, without tackling data quality issues.
Versions. The availability of version information or different versions of a digital object is used for assessing findability and accessibility (specifically the A2 principle).
5.2.3 Assessment metrics: approaches and technologies
The fact that the vast majority of approaches encompass more than one FAIR area (Section 4.2.3) is indicative of an assessment that is inherently metadata-oriented. It is indeed the metadata, rather than the object itself, that are used in the verifications. This also explains why there are metrics developed for data assessment tools that are applicable for evaluating any digital object.
Challenges arise when evaluating accessibility principles (namely, A1.1, A1.2, and A2), which are the only ones for which an approach based on the availability of documentation pertaining to an assessment criterion (e.g. a metadata retention policy) is found. This approach further highlights the persistent obstacles in developing automated solutions that address all the FAIR principles comprehensively.
The results reported in Section 4.2.3 about the technologies referred in metrics implementations suggest there is an evident gap between the willingness to provide communities with FAIR assessment tools and metrics and the specific decisions and needs characterising the processes of FAIRification and FAIRness assessment in community settings. There is no single technology that is globally considered suitable for implementing any of the FAIR principles, and each community is entitled to pick any technology they deem suitable for implementing a FAIR principle by the formulation of the principle. The fact that some tools cater for injecting community-specific assessment metrics into their assessment pipelines aims at compensating this gap by bringing the risk of ‘implicit knowledge’, i.e. when a given technology is a de-facto standard in a context or for a community, it is likely that this technology is taken for granted and disappear from the assessment practices produced by the community itself.
5.3 FAIR assessment prospects
The findings and discussions reported so far allow us to envisage some potential enhancements that might make future FAIR assessments more effective. It is desirable for forthcoming FAIR assessment tools to perform their assessment by (a) making the assessment process as automatic as possible, (b) making openly available the assessment process specification, including details on the metrics exploited, (c) allowing assessors to inject context-specific assessment specifications and metrics, (d) providing assessors with concrete suggestions (eventually AI-based) aiming at augmenting the FAIRness of the assessed objects. All in all, assessment tools should contribute to refrain from the diffusion of the feeling that FAIRness is a ‘yes’ or ‘no’ feature; every FAIR assessment exercise or FAIRness indicator associated with the object should always be accompanied with context-related documentation clarifying the settings leading to it.
It is also desirable to gradually reduce the need for FAIR assessment tools by developing data production and publication pipelines that are FAIR ‘by design’. Although any of such pipelines will indeed implement a specific interpretation of the FAIR principles, the one deemed suitable for the specific context, it will certainly result in a new generation of datasets, more generally resources, that are born with a flavour of FAIRness. These datasets should be accompanied by metadata clarifying the specification implemented by the pipeline to make them FAIR (this was already envisaged in R1.2). The richer and wider in scope the specification driving the FAIR by design pipelines is, the larger will be the set of contexts benefitting from the FAIRification. Data Management Plans might play a crucial role (David et al. 2023; Salazar et al. 2023; Specht et al. 2023) in promoting the development of documented FAIR by design management pipelines. The FIP2DMP pipeline can be used to automatically inform Data Management Plans about the decisions taken by a community regarding the use of FAIR Enabling Resources (Hettne et al. 2023). This can facilitate easier adoption of community standards by the members of that community and promote FAIR by design data management practices.
In the development of FAIR by design pipelines, community involvement is pivotal. Indeed, it is within each community that the requirements for a FAIR implementation profile to be followed can be established. Since it is ultimately the end-user who verifies the FAIRness of a digital object, particularly in terms of reusability, it is essential for each community to foster initiatives that define actual FAIR implementations through a bottom to top process, aiming to achieve an informed consensus on machine-actionable specifics. An example in this direction is NASA, which, as a community, has committed to establishing interpretative boundaries and actions to achieve and measure the FAIRness of their research products in the context of their data infrastructures (SMD Data Repository Standards and Guidelines Working Group 2024).
Community-tailored FAIR by design pipelines would, on one hand, overcome the constraints of a top-down defined FAIRness, which may not suit the broad spectrum of existing scenarios. One of these constraints is exemplified by the number of technologies that a rule-based assessment tool ought to incorporate. While a community may establish reference technologies, it is far more challenging for a checklist to suffice for the needs of diverse communities. On the other hand, community-tailored FAIR by design pipelines can aid in establishing a concept of minimum requirements for absolute FAIRness, derived from the intersection of different specifications, or, on the contrary, in proving its unfeasibility.
Instead of attempting to devise a tool for a generic FAIR assessment within a rule-based control context, which cannot cover the different scenarios in which research outputs are produced, it may be more advantageous to focus on community-specific assessment tools. Even in this scenario, the modularity of the tools and the granularity of the assessments performed would be essential for creating an adaptable instrument that changes with the ever-evolving technologies and standards.
For examining the FAIRness of an object from a broad standpoint, large language models (LLMs) could serve as an initial benchmark for a preliminary FAIR evaluation. Such an approach would have the advantage of not being bound to a rule-based verification, since the model would be based on a comprehensive training set, allowing it to identify a wide range of possibilities, while managing to provide a consistent and close interpretation of the FAIR principles through different scenarios.
6 Conclusion
This study analysed 20 FAIR assessment tools and their related 1180 metrics to answer four research questions to develop a comprehensive and up-to-date view of the FAIR assessment.
The tools were analysed along seven axes (assessment unit, assessment methodology, adaptability, discipline specificity, community specificity, and provisioning mode), highlighting the emergence of trends over time: the increasing variety in the assessment units and the preference for automatic assessment methodologies, non-adaptable assessment methods, discipline and community generality, and the as-a-Service provisioning model. The inherent subjectivity in interpreting and applying the FAIR principles leads to a spectrum of assessment solutions, underscoring the challenge of reconciling the aspirational nature of the FAIR principles with precise measurement. Manual assessment practices fail to yield consistent results for the same reason that they constitute a valuable resource, that is, they facilitate the adaptability to the variety of assessment contexts by avoiding extensional formulations. Automated tools, although objective in their processes, are not immune to subjectivity as they reflect the biases and interpretations of their developers. This is particularly evident in tools that do not support user-defined metrics, which could otherwise allow for a more nuanced FAIR assessment.
The metrics were analysed with respect to the FAIR principles’ coverage, the discrepancies between the declared intent of the metrics and the actual aspects assessed, and the approaches and technologies employed for the assessment. This revealed gaps, discrepancies, and high heterogeneity among the existing metrics and the principles. This was quite expected and depended on the difference of intents among a set of aspirational principles by design that was oriented to allow many different approaches to rendering the target items FAIR and metrics called to assess in practice concrete implementations of FAIR principles. Principles do not represent a standard to adhere to (Mons et al. 2017) and some of them are multifaceted, while metrics have to be implemented by making decisions on principles implementations to make the assessment useful or remain at the same level of genericity of the principle, thus leaving room for interpretation from the assessor and making the assessment exposed to personal biases. Multifaceted principles are not uniformly assessed, with tools, especially automated ones, struggling to evaluate them programmatically. Accessibility principles, in particular, are not consistently addressed. The controls envisaged for assessing FAIRness also encompass aspects that extend beyond the original intentions of the principles’ authors. Concepts such as open, free, and valid are in fact employed within the context of FAIR assessment, reflecting a shifting awareness of the interconnected yet distinct issues associated with data management practices. Just as closed digital objects can be FAIR, data and metadata that are not valid may comply with the principles as well, depending on the context they were produced. The diversity of assessment approaches for the same principle and the absence of a universally accepted technology for implementing FAIR principles, reflecting the diverse needs and preferences of scientific communities, further highlights the variability in interpretation, ultimately rendering absolute assessments of FAIRness impractical and, arguably, nonsensical.
Forthcoming FAIR assessment tools should include among their features the possibility of implementing new checks and allow user-defined assessment profiles. The ‘publication’ of metrics will allow the development of a repository or a registry for FAIR assessment implementations, fostering their peer review process and the reuse or repurposing of them by different assessment tools, ultimately being an effective solution for enabling and promoting the awareness of the available solutions without depending on a specific tool. The recently proposed FAIR Cookbook (Life Science) (Rocca-Serra et al. 2023) goes in this direction. In addition, the need for assessment tools will likely be limited if FAIR-by-design data production and publication pipelines are developed, thus leading to FAIR-born items. Of course, the FAIR-born items are not universally FAIR, they are simply compliant with the specific implementation choices decided by the data publishing community in their FAIR-by-design pipeline. Rather than trying to define a FAIRness that can fit all purposes, shifting the focus from generic FAIR assessment solutions to community-specific FAIR assessment solutions would bring better results in the long run. A bottom-up approach would yield greater benefits, both short-term and long-term, as it would enable the immediate production of results that are informed by the specific needs of each community, thus ensuring immediate reusability. Furthermore, it would facilitate the identification of commonalities, thereby allowing for a shared definition of a broader FAIRness. LLMs could bring advantages to FAIR assessment processes by untying them from rule-based constraints and by ensuring a consistent interpretation of the FAIR principles amidst the variety characterising scientific settings and outputs.
All in all, we argue that FAIRness is a valuable concept yet FAIR is by design far from being a standard or a concrete specification whose compliance can be univocally assessed and measured. FAIR principles were proposed to guide data producers and publishers; thus FAIRness assessment tools are expected to help these key players to identify possible limitations in their data management practices with respect to good data management and stewardship.
Data Accessibility Statements
The data that support the findings of this study are openly available on Zenodo at https://doi.org/10.5281/zenodo.10082195.
Additional File
The additional file for this article can be found as follows:
Acknowledgements
We really thank D. Castelli (CNR-ISTI) for her valuable support and the many helpful comments she gave during the preparation of the manuscript. We sincerely thank the anonymous reviewers for their valuable feedback.
Funding information
This work has received funding from the European Union’s Horizon 2020 and Horizon Europe research and innovation programmes under the Blue Cloud project (grant agreement No. 862409), the Blue-Cloud 2026 project (grant agreement No. 101094227), the Skills4EOSC project (grant agreement No. 101058527), and the SoBigData-PlusPlus project (grant agreement No. 871042).
Competing Interests
The authors have no competing interests to declare.
Author Contributions
LC: Conceptualization, Funding acquisition, Methodology, Supervision, Validation, Visualization, Writing.
DM: Data curation, Formal Analysis, Investigation, Writing.
GP: Data curation, Formal Analysis, Investigation, Writing.