
Table I
Summary of terminology used.
| TERMINOLOGY | DEFINITION |
|---|---|
| ARIMA | Autoregressive Integrated Moving Average |
| AUC | Area under the ROC Curve. |
| CAV | Connected and Autonomous Vehicle |
| COPOD | Copula-Based Outlier Detection |
| CPOD | Core Point-based Outlier Detection |
| DAGMM | Deep Autoencoding Gaussian Mixture Model |
| DTAAD | Dual Tcn-Attention Networks for Anomaly Detection in Multivariate Time Series Data |
| ECG | Electrocardiography |
| EVT | Extreme Value Theory |
| FFN | Feedforward Neural Network |
| GAN | Generative Adversarial Network |
| GDN | Graph Deviation Networks |
| GHL | Gas-oil Plant Heating Loop |
| GPD | Generalized Pareto Distribution |
| GRU | Gated Recurrent Unit |
| GTA | Graph Learning with Transformer for Anomaly Detection |
| HBOS | Histogram-Based Outlier Score |
| IoT | Internet of Things |
| KBJNet | Kinematic Bi-Joint Temporal Convolutional Network Attention for Anomaly Detection |
| KDD | Knowledge Discovery and Data Mining |
| KNN | k-Nearest Neighbor |
| LDCOF | Local Density Cluster-based Outlier Factor |
| LOF | Local Outlier Factor |
| LSTM | Long Short-Term Memory Networks |
| LSTM-VAE | Long Short-Term Memory Networks and Variational Autoencoder |
| MAD-GAN | Multivariate Anomaly Detection for Time Series Data with Generative Adversarial Networks |
| MAML | Model-Agnostic and Meta-Learning |
| MBA | MIT-BIH Supraventricular Arrhythmia Database |
| MSCRED | Multi-Scale Convolutional Recurrent Encoder-Decoder |
| MSDS | Material Safety Data Sheet |
| MSE | Mean Squared Error |
| MSL | Mars Science Laboratory |
| MTAD-GAT | Multivariate Time-Series Anomaly Detection via Graph Attention Networks |
| MTS | Multivariate Time Series |
| NAB | Numenta Anomaly Benchmark |
| NSIBF | Neural System Identification and Bayesian Filtering |
| PCA | Principal Component Analysis |
| POT | Peaks Over Threshold |
| ReLU | Rectified Linear Unit |
| RNN | Recurrent Neural Network |
| SMAP | Soil Moisture Active Passive |
| SMD | Server Machine Dataset |
| SoTa | State of the Art |
| SVD | Support Vector Data |
| SVDD | Support Vector Data Description |
| SVM | Support Vector Machine |
| SWaT | Secure Water Treatment |
| TCN | Temporal Convolutional Network |
| TranAD | Deep Transformer Networks for Anomaly Detection in Multivariate Time Series Data |
| TWSVM | Twin Support Vector Machine |
| USAD | Unsupervised Anomaly Detection |
| UTRAD | Anomaly Detection and Localization with U-Transformer |
| WADI | Water Distribution |
Table II
Summary of literature review multivariate time series.
| METHOD | APPROACH | MAIN ARCHITECTURE | SUPERVISED/UNSUPERVISED | ABLE TO HANDLE LIMITED DATA | INTERPRETABILITY |
|---|---|---|---|---|---|
| DAGMM (Zong et al. 2018) | Forecasting | AE | Unsupervised | × | × |
| HitAnomaly (Huang et al. 2020) | Forecasting | Transformer | Supervised | × | × |
| TCN-AE (Thill et al. 2021) | Reconstruction | AE | Unsupervised | × | × |
| OmniAnomaly (Su et al. 2019) | Reconstruction | VAE | Unsupervised | × | × |
| LSTM-VAE (Park et al. 2018) | Reconstruction | VAE | Semi | × | × |
| GTA (Chen et al. 2022) | Reconstruction | GNN | Semi | × | × |
| MSCRED (Zhang et al. 2019) | Reconstruction | AE | Unsupervised | × | ✓ |
| MAD-GAN (Li et al. 2019) | Reconstruction | GAN | Unsupervised | × | × |
| USAD (Li et al. 2019) | Reconstruction | AE | Unsupervised | × | × |
| MTAD-GAT (Zhao et al. 2020) | Hybrid | GNN | Supervised | × | ✓ |
| CAE-M (Zhang et al. 2021) | Hybrid | AE | Unsupervised | × | × |
| GDN (Deng & Hooi 2021) | Forecasting | GNN | Unsupervised | × | ✓ |
| TranAD (Tuli et al. 2022) | Reconstruction | Transformer | Unsupervised | ✓ | ✓ |
| DTAAD (Yu etal. 2023) | Reconstruction | Transformer | Unsupervised | ✓ | ✓ |
| KBJNet | Reconstruction | Transformer | Unsupervised | ✓ | ✓ |
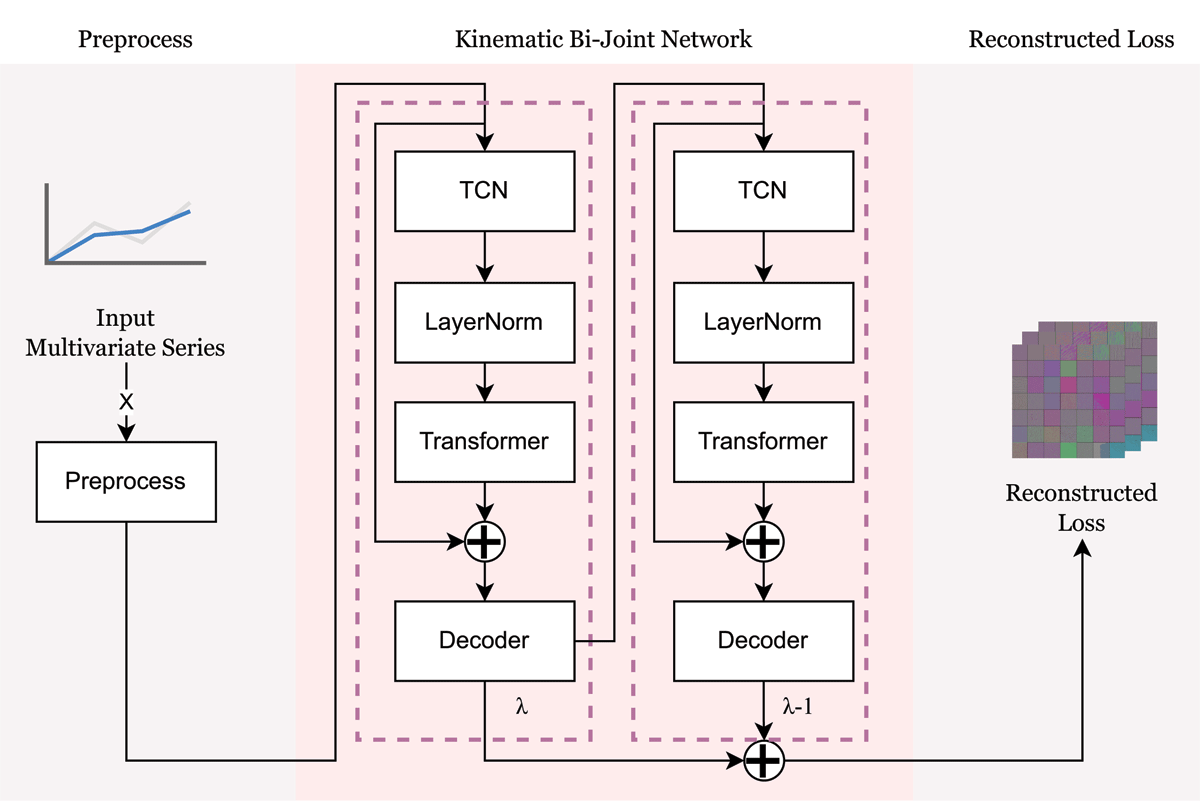
Figure 1
Kinematic bi-joint network architecture for anomaly detection.
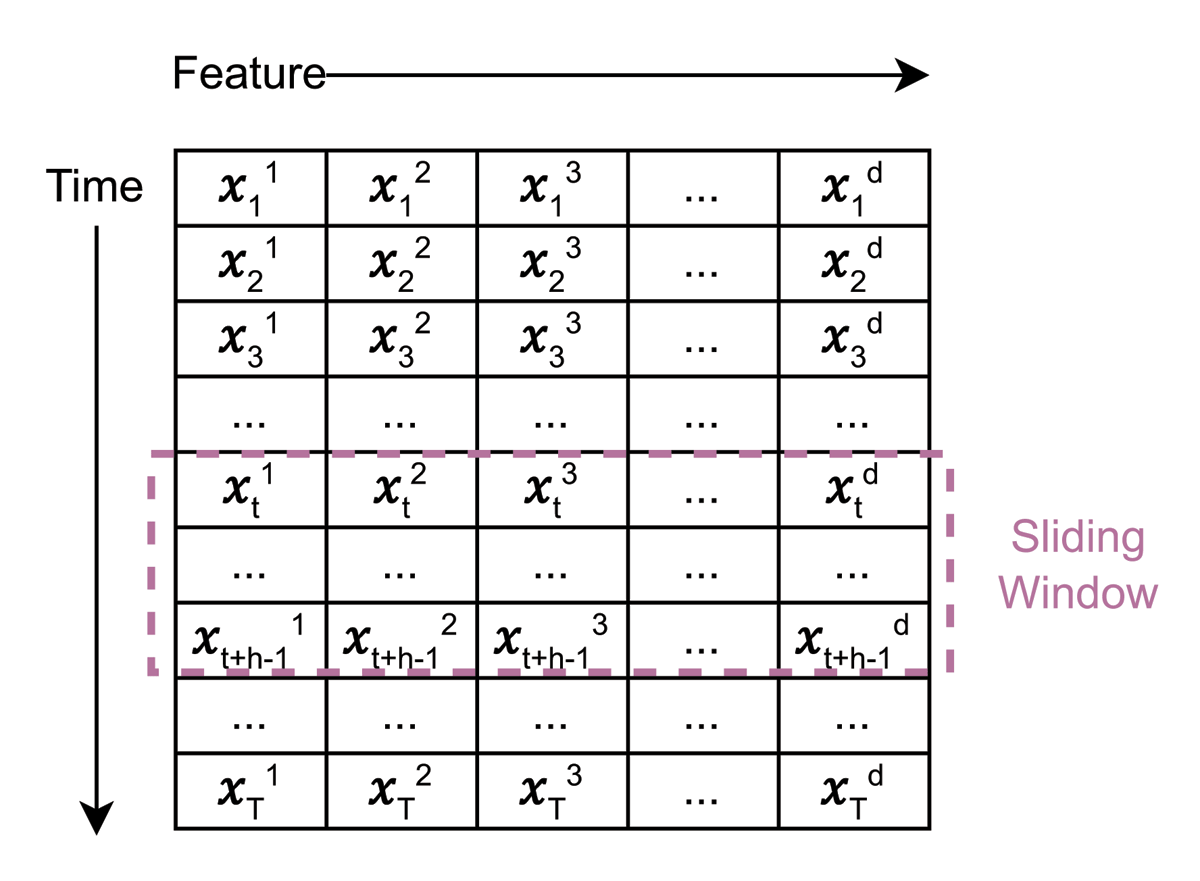
Figure 2
An illustration or depiction of data that involves multiple variables and occurs over a period of time.
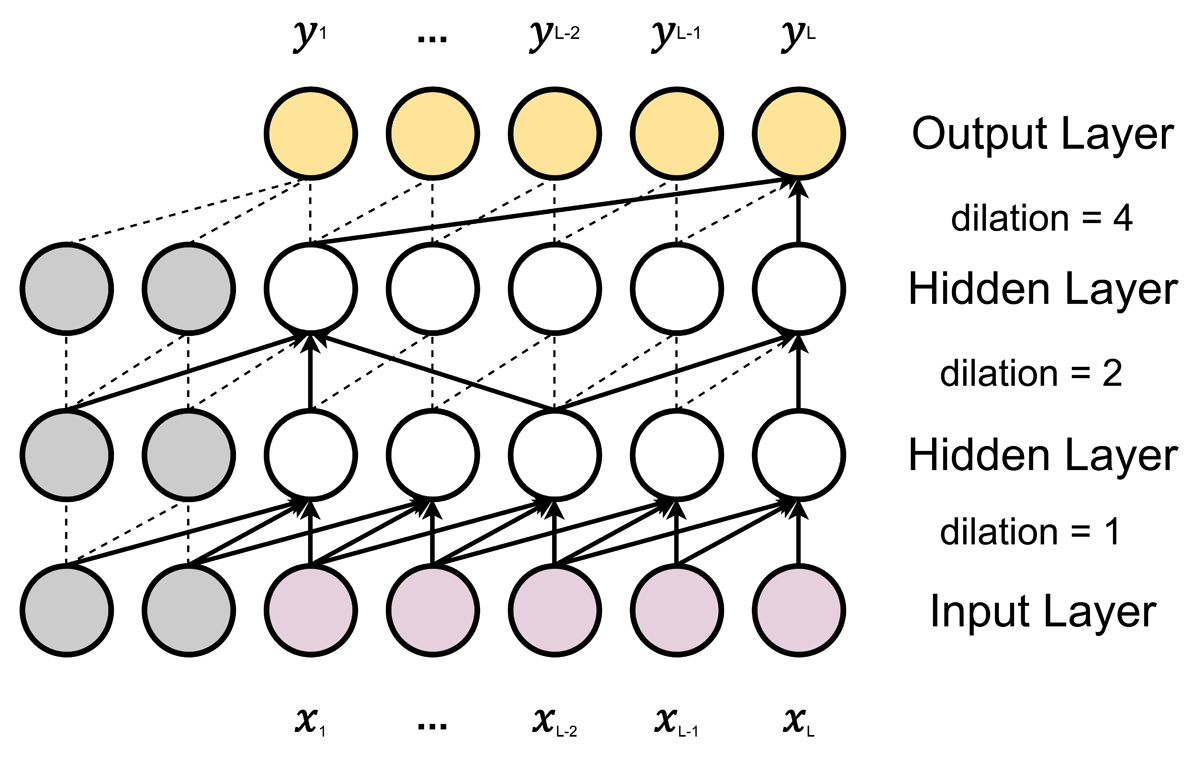
Figure 3
The convolution has specific dilation factors of 1, 2, and 4 and a kernel size of 3. The input is represented as x, and the output is represented as y.
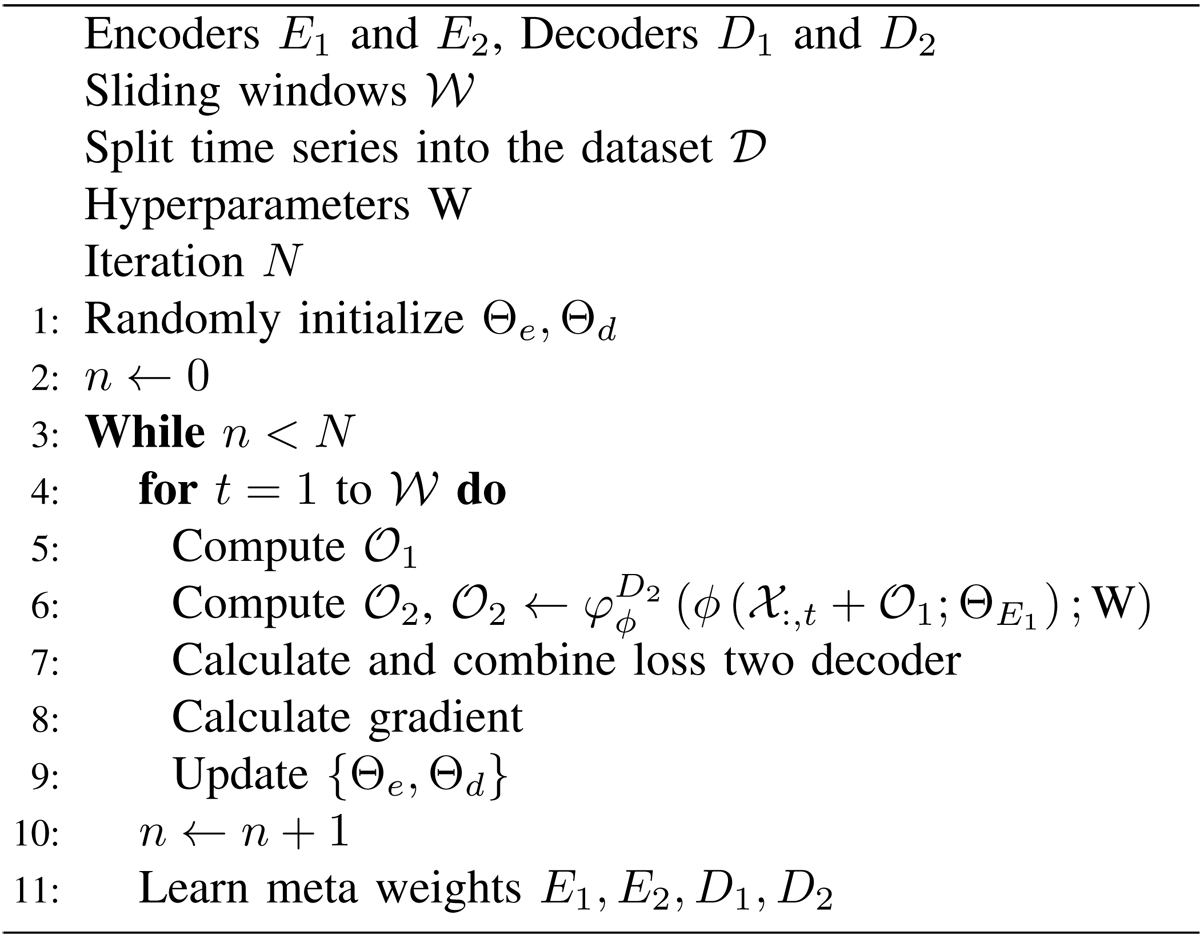
Algorithm 1
The KBJNet Training Algorithm.
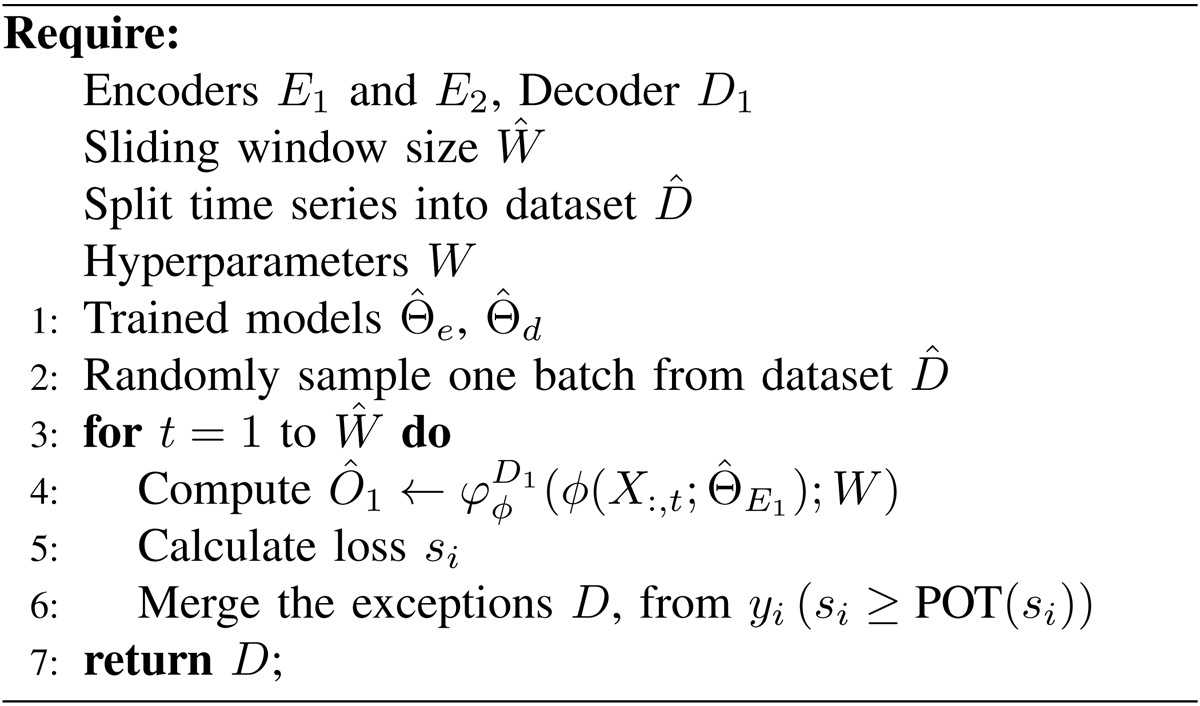
Algorithm 2
The KBJNet Testing Algorithm.
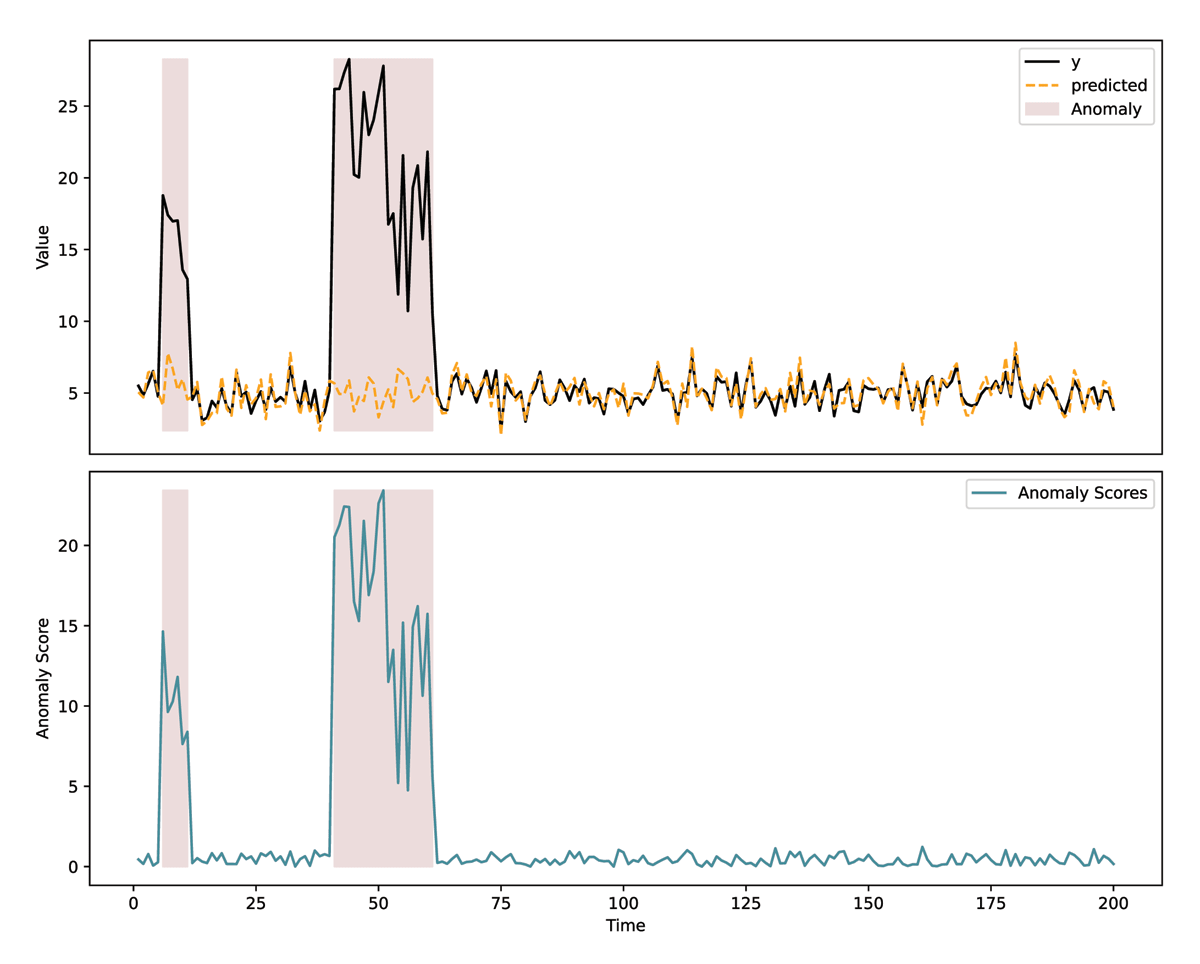
Figure 4
Visualization of anomaly prediction.
Table III
Dataset characteristics.
| TYPE | DIMENSIONS | TRAIN | VALIDATION | ANOMALIES RATE (%) |
|---|---|---|---|---|
| MSDS | 10 (1) | 146430 | 146430 | 5.37 |
| SMD | 38 (4) | 708420 | 708420 | 4.16 |
| SWaT | 51 (1) | 496800 | 449919 | 11.98 |
| MSL | 55 (3) | 58317 | 73729 | 10.72 |
| SMAP | 25 (55) | 135183 | 427617 | 13.13 |
| MBA | 2 (8) | 100000 | 100000 | 0.14 |
| UCR | 1 (4) | 1600 | 5900 | 1.88 |
| NAB | 1 (6) | 4033 | 4033 | 0.92 |
| WADI | 123 (1) | 1048571 | 172801 | 5.99 |
Table V
Comparison of KBJNet model with baseline methods with 20% of anomalies dataset.
| METHOD | NAB | UCR | MBA | SMAP | MSL | SWAT | SMD | MSDS | WADI | |||||||||
|---|---|---|---|---|---|---|---|---|---|---|---|---|---|---|---|---|---|---|
| AUC* | F1* | AUC* | F1* | AUC* | F1* | AUC* | F1* | AUC* | F1* | AUC* | F1* | AUC* | F1* | AUC* | F1* | AUC* | F1* | |
| MSCRED | 0.8298 | 0.7012 | 0.9636 | 0.4928 | 0.9498 | 0.9107 | 0.9810 | 0.8049 | 0.9796 | 0.8231 | 0.8384 | 0.7921 | 0.9767 | 0.8003 | 0.7715 | 0.8282 | 0.6028 | 0.0412 |
| MAD-GAN | 0.8193 | 0.7108 | 0.9958 | 0.8215 | 0.9549 | 0.9191 | 0.9876 | 0.8467 | 0.9648 | 0.8189 | 0.8455 | 0.8011 | 0.8634 | 0.9317 | 0.5001 | 0.7389 | 0.5382 | 0.0936 |
| USAD | 0.7268 | 0.6782 | 0.9968 | 0.8539 | 0.9698 | 0.9426 | 0.9884 | 0.8380 | 0.9650 | 0.8191 | 0.8439 | 0.8088 | 0.9855 | 0.9214 | 0.7614 | 0.8390 | 0.7012 | 0.0734 |
| MTAD-GAT | 0.6957 | 0.7012 | 0.9975 | 0.8672 | 0.9689 | 0.9426 | 0.9815 | 0.8226 | 0.9783 | 0.8025 | 0.8460 | 0.8080 | 0.9799 | 0.6662 | 0.6123 | 0.8249 | 0.6268 | 0.0521 |
| CAE-M | 0.7313 | 0.7127 | 0.9927 | 0.7526 | 0.9617 | 0.9003 | 0.9893 | 0.8313 | 0.9837 | 0.7304 | 0.8459 | 0.7842 | 0.9570 | 0.9319 | 0.6002 | 0.8390 | 0.6110 | 0.0782 |
| GDN | 0.8300 | 0.7014 | 0.9938 | 0.8030 | 0.9672 | 0.9317 | 0.9888 | 0.8412 | 0.9415 | 0.8960 | 0.8391 | 0.8073 | 0.9812 | 0.7108 | 0.6820 | 0.8390 | 0.6122 | 0.0413 |
| TranAD | 0.9216 | 0.8420 | 0.9983 | 0.9211 | 0.9946 | 0.9897 | 0.9884 | 0.8936 | 0.9856 | 0.9171 | 0.8461 | 0.8093 | 0.9847 | 0.8794 | 0.8112 | 0.8389 | 0.6852 | 0.0698 |
| DTAAD | 0.9330 | 0.9057 | 0.9984 | 0.9220 | 0.9955 | 0.9912 | 0.9894 | 0.8996 | 0.9864 | 0.9212 | 0.8460 | 0.8087 | 0.9866 | 0.8941 | 0.8115 | 0.8390 | 0.7818 | 0.0977 |
| KBJNet | 0.9999 | 0.9231 | 0.9999 | 0.9328 | 0.9932 | 0.9869 | 0.9894 | 0.9007 | 0.9907 | 0.9451 | 0.8460 | 0.8087 | 0.9986 | 0.9983 | 0.9829 | 0.9107 | 0.8453 | 0.1511 |
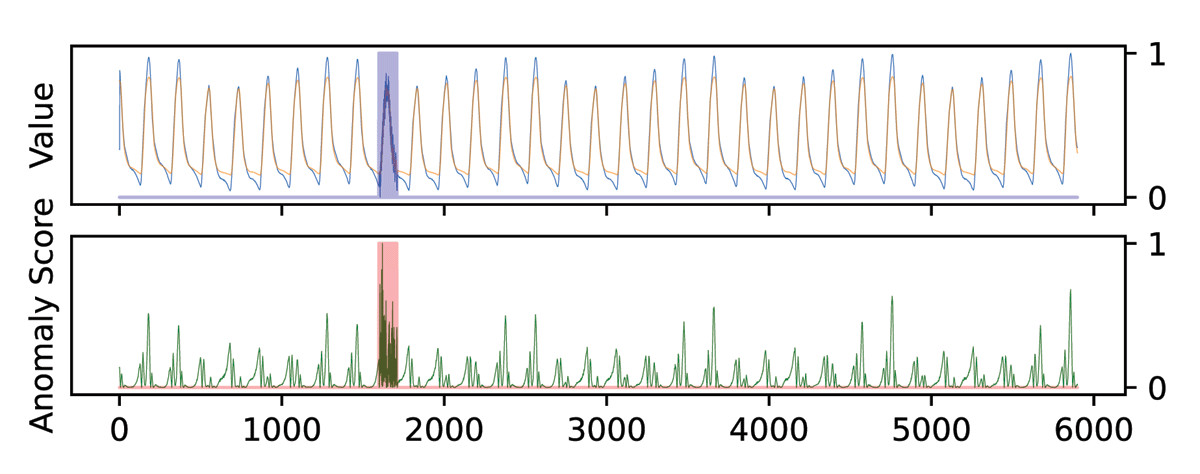
Figure 5
Results in UCR.
Table IV
Comparison of KBJNet model with baseline methods with 80% of the training dataset.
| METHOD | NAB | UCR | MBA | SMAP | SWaT | ||||||||||||||||
|---|---|---|---|---|---|---|---|---|---|---|---|---|---|---|---|---|---|---|---|---|---|
| P | R | AUC | F1 | P | R | AUC | F1 | P | R | AUC | F1 | P | R | AUC | F1 | P | R | AUC | F1 | ||
| MSCRED | 0.8521 | 0.6700 | 0.8400 | 0.7501 | 0.5440 | 0.9717 | 0.9919 | 0.6975 | 0.9271 | 1.0000 | 0.9798 | 0.9622 | 0.8174 | 0.9215 | 0.9820 | 0.8663 | 0.9991 | 0.6769 | 0.8432 | 0.8071 | |
| MAD-GAN | 0.8665 | 0.7011 | 0.8477 | 0.7751 | 0.8537 | 0.9890 | 0.9983 | 0.9164 | 0.9395 | 1.0000 | 0.9835 | 0.9688 | 0.8156 | 0.9215 | 0.9890 | 0.8653 | 0.9592 | 0.6956 | 0.8462 | 0.8064 | |
| USAD | 0.8421 | 0.6667 | 0.8332 | 0.7443 | 0.8953 | 1.0000 | 0.9990 | 0.8953 | 0.8954 | 0.9990 | 0.9702 | 0.9444 | 0.7481 | 0.9628 | 0.9890 | 0.8419 | 0.9977 | 0.6879 | 0.8460 | 0.8143 | |
| MTAD-GAT | 0.8422 | 0.7273 | 0.8222 | 0.7803 | 0.7813 | 0.9973 | 0.9979 | 0.8762 | 0.9019 | 1.0000 | 0.9720 | 0.9483 | 0.7992 | 0.9992 | 0.9846 | 0.8882 | 0.9719 | 0.6958 | 0.8465 | 0.8110 | |
| CAE-M | 0.7919 | 0.8020 | 0.8020 | 0.7969 | 0.6982 | 1.0000 | 0.9958 | 0.8223 | 0.8443 | 0.9998 | 0.9662 | 0.9155 | 0.8194 | 0.9568 | 0.9902 | 0.8828 | 0.9698 | 0.6958 | 0.8465 | 0.8102 | |
| GDN | 0.8130 | 0.7873 | 0.8543 | 0.7999 | 0.6895 | 0.9989 | 0.9960 | 0.8159 | 0.8833 | 0.9893 | 0.9529 | 0.9333 | 0.7481 | 0.9892 | 0.9865 | 0.8519 | 0.9698 | 0.6958 | 0.8463 | 0.8102 | |
| TranAD | 0.8889 | 0.9892 | 0.9541 | 0.9364 | 0.9407 | 1.0000 | 0.9994 | 0.9694 | 0.9576 | 1.0000 | 0.9886 | 0.9783 | 0.8104 | 0.9998 | 0.9887 | 0.8953 | 0.9977 | 0.6879 | 0.8438 | 0.8143 | |
| DTAAD | 0.8889 | 0.9999 | 0.9996 | 0.9412 | 0.8880 | 1.0000 | 0.9988 | 0.9407 | 0.9608 | 1.0000 | 0.9896 | 0.9800 | 0.8220 | 0.9999 | 0.9911 | 0.9023 | 0.9697 | 0.6957 | 0.8462 | 0.8101 | |
| KBJNet | 0.8889 | 0.9999 | 0.9996 | 0.9412 | 0.9999 | 1.0000 | 0.9999 | 0.9999 | 0.9805 | 1.0000 | 0.9898 | 0.9805 | 0.8302 | 0.9999 | 0.9901 | 0.9072 | 0.9718 | 0.6957 | 0.8463 | 0.8109 | |
| METHOD | SMD | MSL | MSDS | WADI | |||||||||||||||||
| P | R | AUC | F1 | P | R | AUC | F1 | P | R | AUC | F1 | P | R | AUC | F1 | ||||||
| MSCRED | 0.7275 | 0.9973 | 0.9920 | 0.8413 | 0.8911 | 0.9861 | 0.9806 | 0.9362 | 0.9998 | 0.7982 | 0.8942 | 0.8878 | 0.2512 | 0.7318 | 0.8411 | 0.3740 | |||||
| MAD-GAN | 0.9990 | 0.8439 | 0.9932 | 0.9149 | 0.8515 | 0.9929 | 0.9861 | 0.9168 | 0.9981 | 0.6106 | 0.8053 | 0.7578 | 0.2232 | 0.9123 | 0.8025 | 0.3587 | |||||
| USAD | 0.9061 | 0.9975 | 0.9934 | 0.9496 | 0.7949 | 0.9912 | 0.9795 | 0.8822 | 0.9913 | 0.7960 | 0.8980 | 0.8829 | 0.1874 | 0.8297 | 0.8724 | 0.3057 | |||||
| MTAD-GAT | 0.8211 | 0.9216 | 0.9922 | 0.8684 | 0.7918 | 0.9825 | 0.9890 | 0.8769 | 0.9920 | 0.7965 | 0.8983 | 0.8835 | 0.2819 | 0.8013 | 0.8822 | 0.4170 | |||||
| CAE-M | 0.9081 | 0.9670 | 0.9782 | 0.9368 | 0.7752 | 1.0000 | 0.9904 | 0.8734 | 0.9909 | 0.8440 | 0.9014 | 0.9115 | 0.2783 | 0.7917 | 0.8727 | 0.4118 | |||||
| GDN | 0.7171 | 0.9975 | 0.9925 | 0.8343 | 0.9309 | 0.9893 | 0.9815 | 0.9592 | 0.9990 | 0.8027 | 0.9106 | 0.8900 | 0.2913 | 0.7932 | 0.8778 | 0.4261 | |||||
| TranAD | 0.9051 | 0.9973 | 0.9933 | 0.9490 | 0.9037 | 0.9999 | 0.9915 | 0.9493 | 0.9998 | 0.8625 | 0.9012 | 0.8904 | 0.3959 | 0.8295 | 0.8998 | 0.5360 | |||||
| DTAAD | 0.8463 | 0.9974 | 0.9892 | 0.9147 | 0.9038 | 0.9999 | 0.9918 | 0.9495 | 0.9999 | 0.8026 | 0.9013 | 0.8905 | 0.9017 | 0.3910 | 0.6950 | 0.5455 | |||||
| KBJNet | 0.9985 | 0.9974 | 0.9987 | 0.9985 | 0.9038 | 0.9999 | 0.9916 | 0.9496 | 0.9592 | 0.9554 | 0.9248 | 0.9573 | 0.8465 | 0.8296 | 0.9130 | 0.8379 | |||||
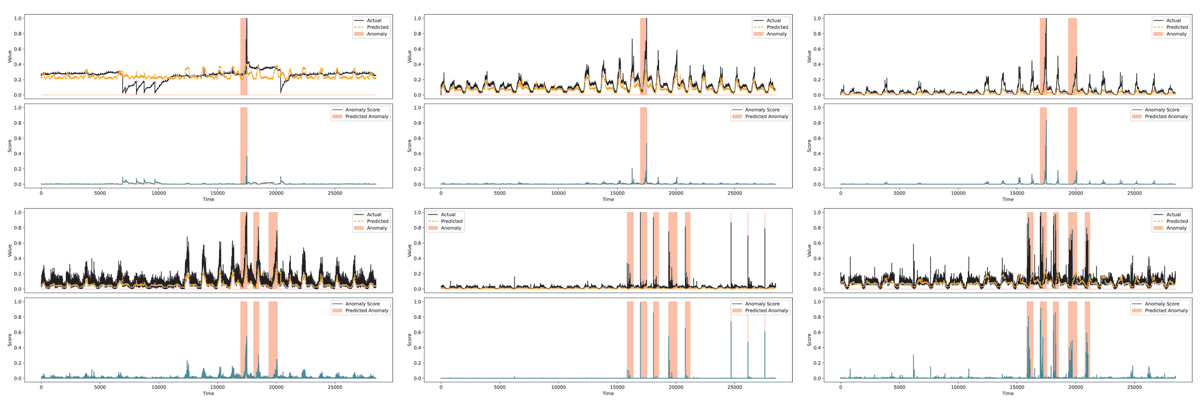
Figure 10
Ground truth and predicted for the SMD using the KBJNet.
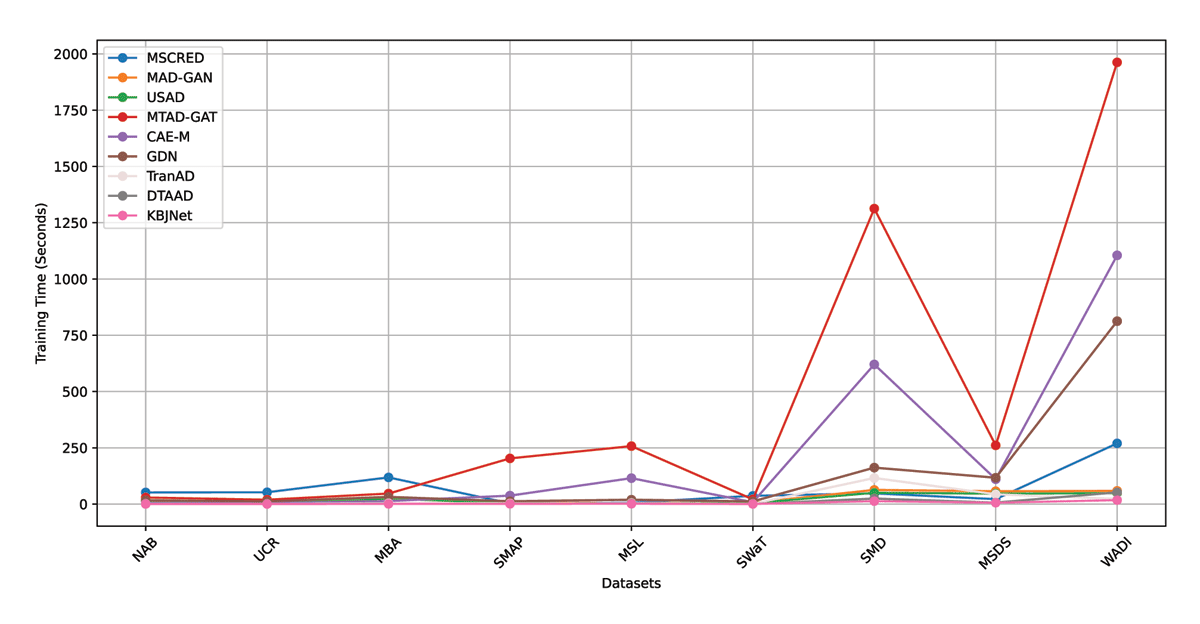
Figure 6
Training time in all datasets.
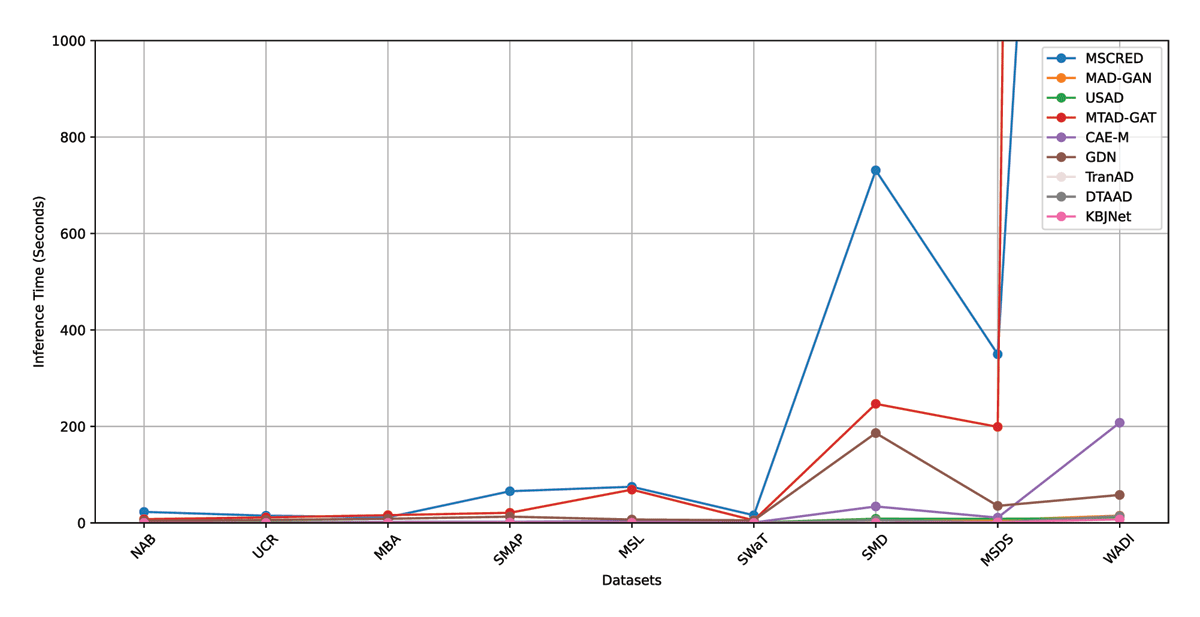
Figure 7
Inference time in all datasets.
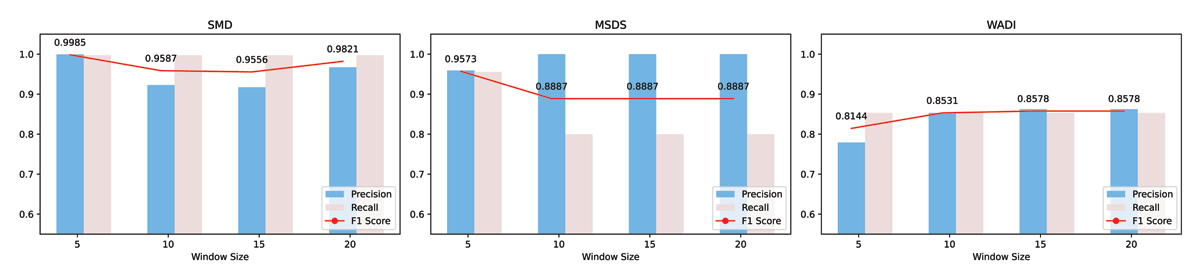
Figure 8
Sensitivity to window size.
Table VI
The connection epochs and the performance on SMD datasets.
| EPOCH | PRECISION | RECALL | AUC | F1-SCORE |
|---|---|---|---|---|
| 1 | 0.9567 | 0.8440 | 0.9200 | 0.8968 |
| 2 | 0.8876 | 0.9974 | 0.9922 | 0.9393 |
| 3 | 0.8831 | 0.9974 | 0.9919 | 0.9368 |
| 4 | 0.8996 | 0.9974 | 0.9929 | 0.9460 |
| 5 | 0.9662 | 0.9974 | 0.9969 | 0.9815 |
| 6 | 0.9985 | 0.9974 | 0.9986 | 0.9979 |
| 7 | 0.9996 | 0.9974 | 0.9987 | 0.9985 |
| 8 | 0.9992 | 0.9974 | 0.9986 | 0.9983 |
| 9 | 0.9985 | 0.9974 | 0.9986 | 0.9979 |
| 10 | 0.9970 | 0.9974 | 0.9985 | 0.9972 |
Table VII
Sensitivity KBJNet to MAML 20% datasets according to meta step-size.
| METHODS | 5 | 10 | 15 | 20 |
|---|---|---|---|---|
| NAB | 0.9231 | 0.9057 | 0.9057 | 0.9231 |
| UCR | 0.9328 | 0.9328 | 0.9328 | 0.9328 |
| MBA | 0.9869 | 0.9871 | 0.9867 | 0.9871 |
| SMAP | 0.9007 | 0.8926 | 0.8926 | 0.9338 |
| MSL | 0.9451 | 0.8998 | 0.8998 | 0.8998 |
| SWaT | 0.8087 | 0.8087 | 0.8094 | 0.8087 |
| SMD | 0.9983 | 0.9970 | 0.9820 | 0.9983 |
| MSDS | 0.9107 | 0.9107 | 0.9107 | 0.9107 |
| WADI | 0.1511 | 0.1104 | 0.1208 | 0.1071 |
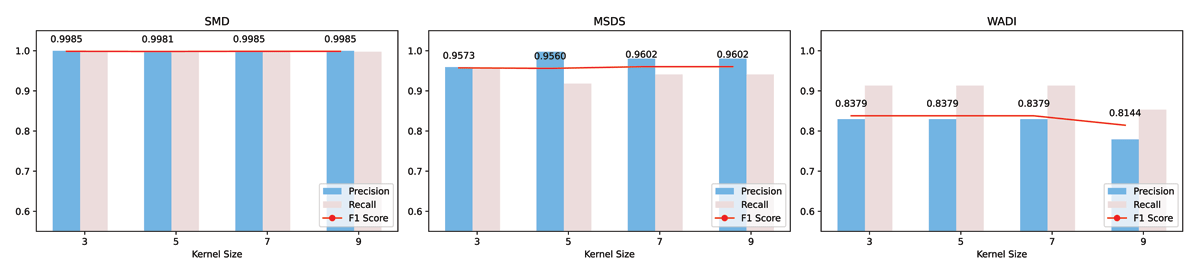
Figure 9
Sensitivity to kernel size.
Table VIII
F1 scores and AUC for KBJNet with 80% of the training datasets.
| Component | NAB | UCR | MBA | |||
|---|---|---|---|---|---|---|
| AUC | F1 | AUC | F1 | AUC | F1 | |
| KBJNet | 0.9996 | 0.9412 | 0.9999 | 0.9999 | 0.9898 | 0.9805 |
| (-)Bi-Joint TCN | 0.9996 | 0.9411 | 0.9986 | 0.9327 | 0.9898 | 0.9787 |
| (-)MAML | 0.9996 | 0.9412 | 0.9990 | 0.9527 | 0.9889 | 0.9787 |
| (-)Transformer | 0.9325 | 0.9050 | 0.9980 | 0.9188 | 0.9926 | 0.9858 |
| COMPONENT | SMAP | MSL | SWAT | |||
| AUC | F1 | AUC | F1 | AUC | F1 | |
| KBJNet | 0.9901 | 0.9072 | 0.9916 | 0.9496 | 0.8463 | 0.8109 |
| (-)Bi-Joint TCN | 0.9903 | 0.9083 | 0.9565 | 0.7848 | 0.8462 | 0.8101 |
| (-)MAML | 0.9890 | 0.8974 | 0.9573 | 0.7878 | 0.8462 | 0.8101 |
| (-)Transformer | 0.9853 | 0.8682 | 0.9700 | 0.8412 | 0.8459 | 0.8086 |
| COMPONENT | SMD | MSDS | ||||
| AUC | F1 | AUC | F1 | |||
| KBJNet | 0.9987 | 0.9985 | 0.9248 | 0.9573 | ||
| (-)Bi-Joint TCN | 0.9911 | 0.8732 | 0.9809 | 0.8991 | ||
| (-)MAML | 0.9923 | 0.8790 | 0.9784 | 0.8872 | ||
| (-)Transformer | 0.9852 | 0.8582 | 0.9789 | 0.8937 | ||