
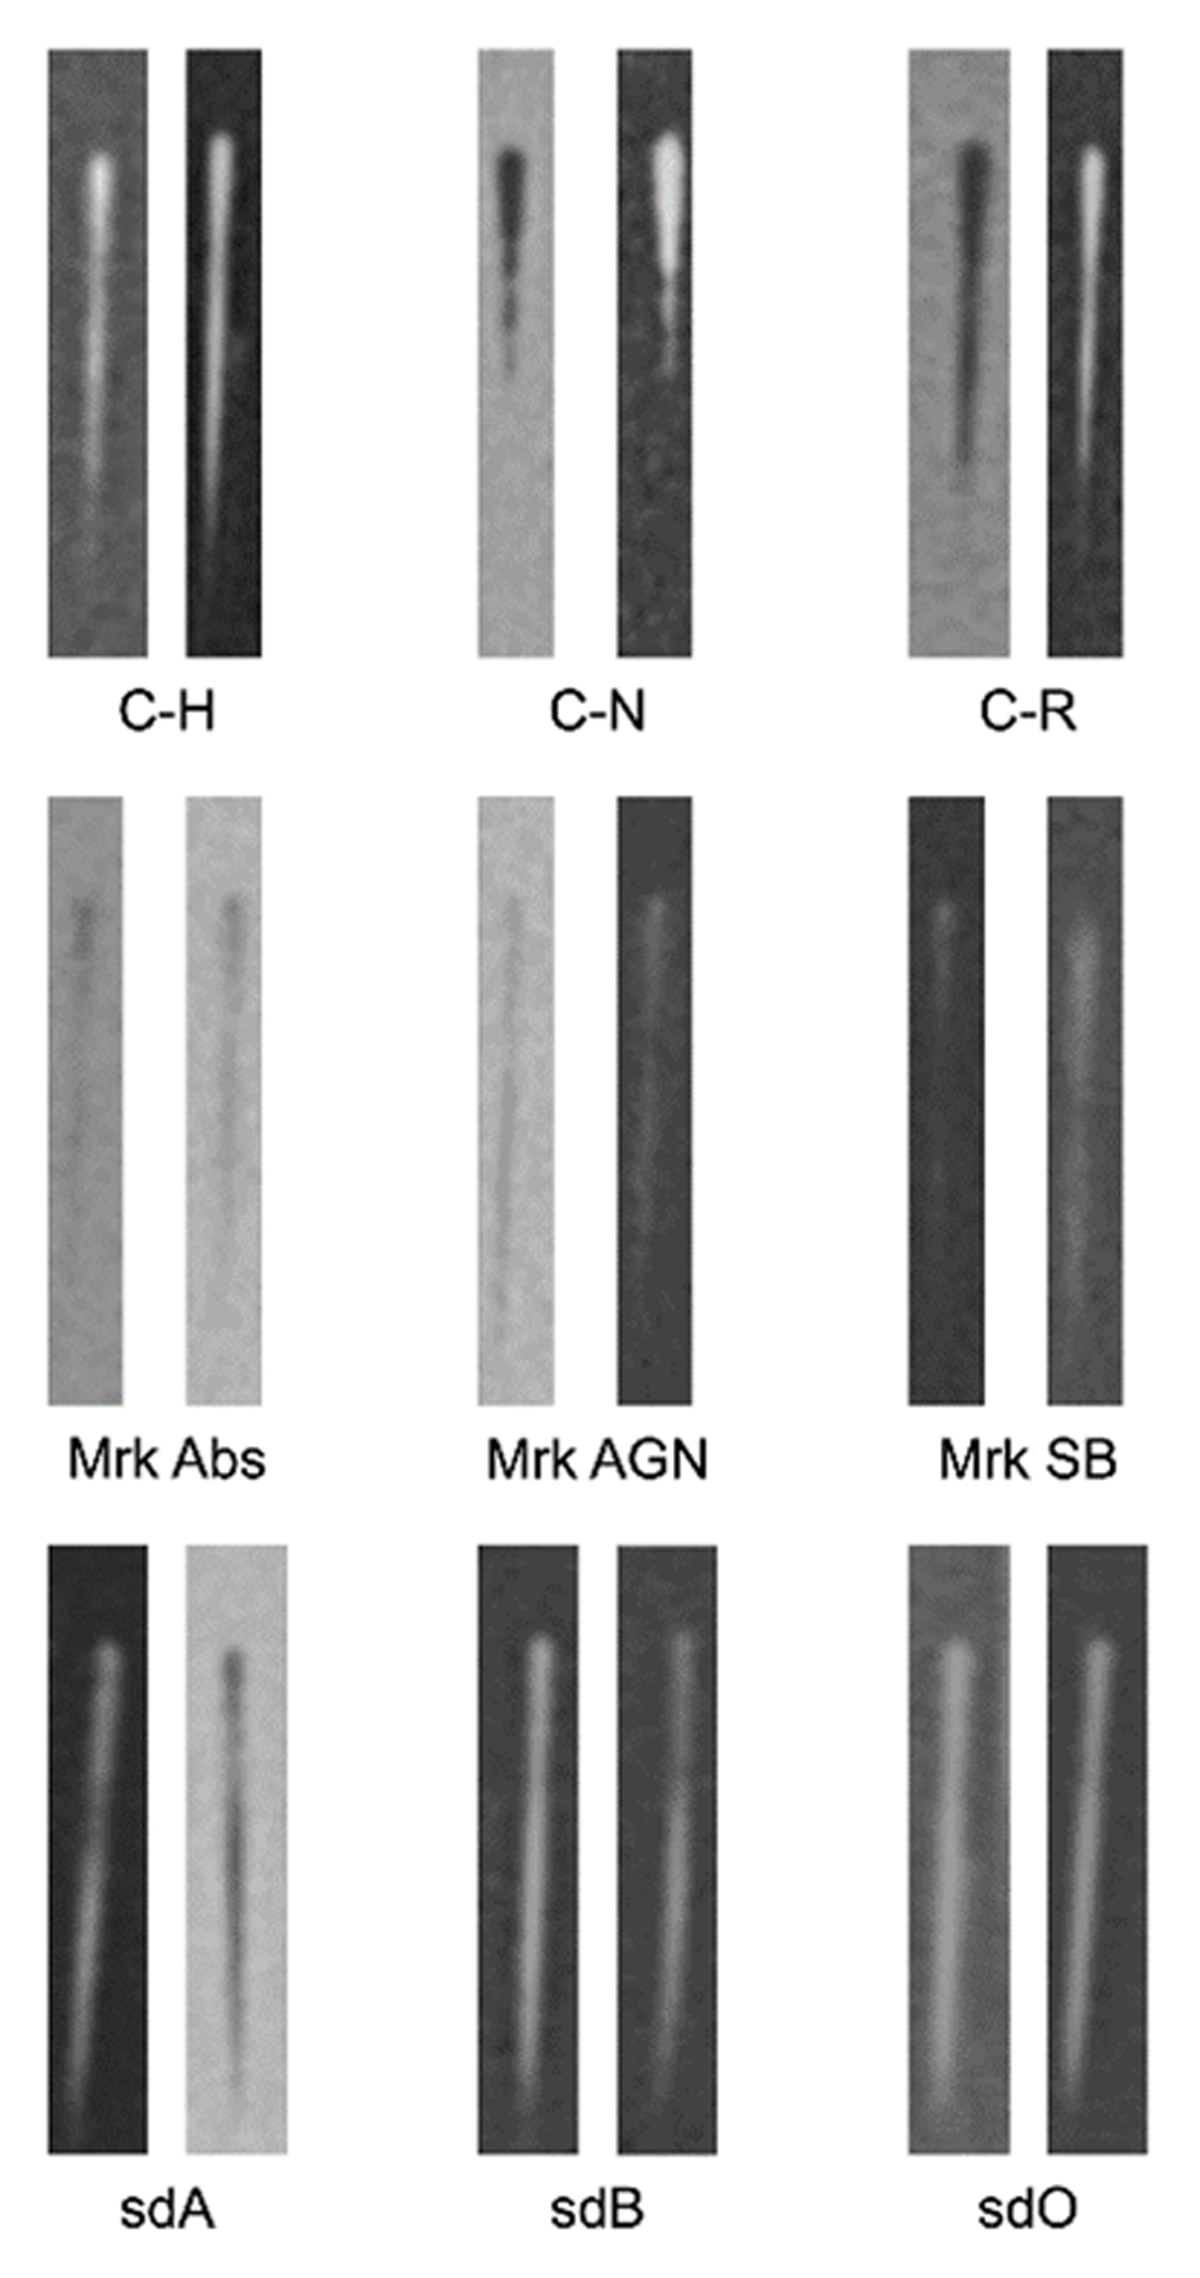
Figure 1
Examples of the subtypes of objects from the three most common object groups in the DFBS.
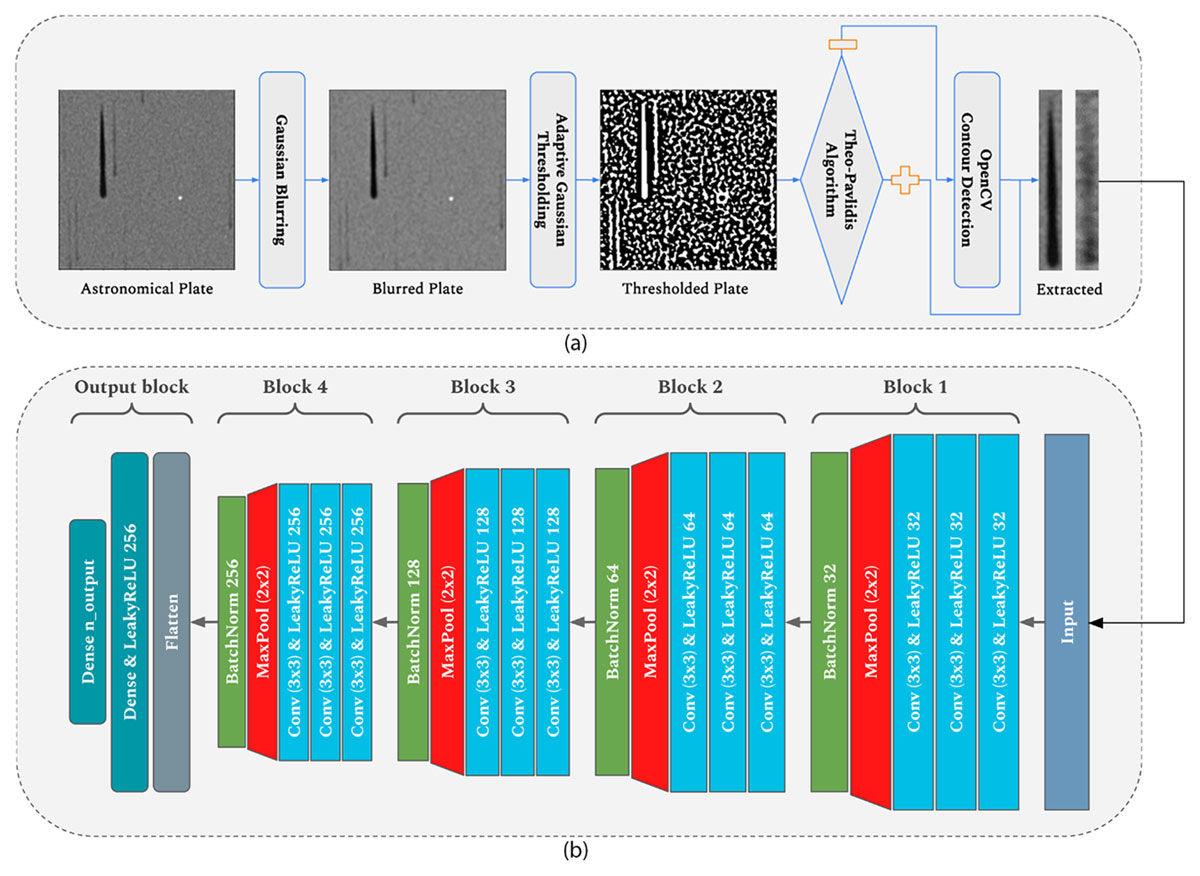
Figure 2
The workflow chart: (a) four-step image processing, (b) the proposed CNN architecture.
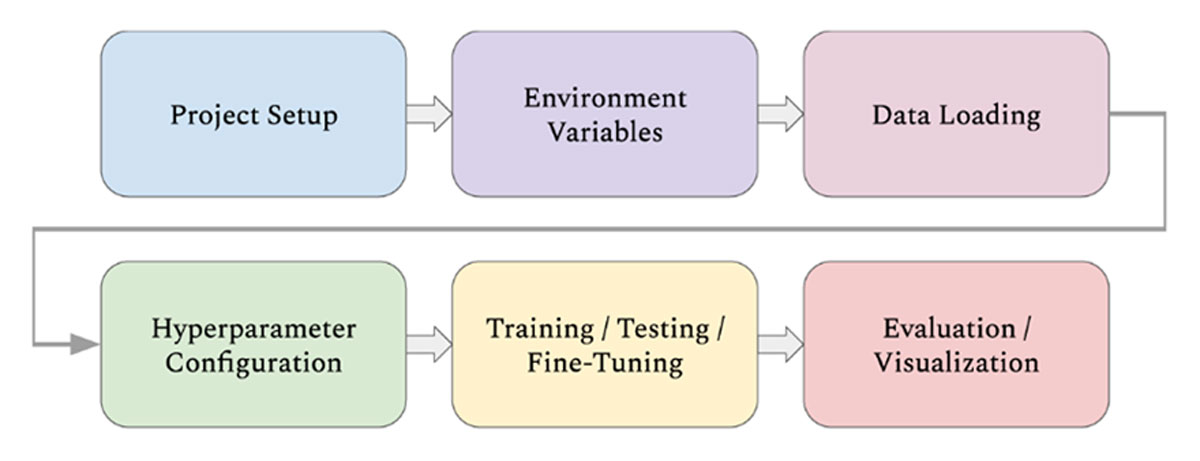
Figure 3
The flowchart of the cloud-based service.
Table 1
Comparison of classification reports for two frameworks proposed by the authors on the sub-objects’ dataset. Support denotes the number of samples in the corresponding class (train + test), blue color denotes the better score.
| SUPPORT | PRECISION | RECALL | F1-SCORE | |
|---|---|---|---|---|
| C-H | 626 + 117 | 0.89 / 0.93 | 0.91 / 0.97 | 0.90 / 0.95 |
| Mrk SB | 664 + 132 | 0.94 / 0.95 | 0.89 / 0.95 | 0.91 / 0.95 |
| sdB | 817 + 156 | 0.94 / 0.98 | 0.96 / 0.96 | 0.95 / 0.97 |
| Accuracy | 2107 + 405 | 0.93 / 0.96 | ||
| Macro avg | 2107 + 405 | 0.92 / 0.96 | 0.92 / 0.96 | 0.92 / 0.96 |
| Weighted avg | 2107 + 405 | 0.93 / 0.96 | 0.93 / 0.96 | 0.93 / 0.96 |
Table 2
Comparison of classification reports for two frameworks proposed by the authors on the group classification dataset.
| SUPPORT | PRECISION | RECALL | F1-SCORE | |
|---|---|---|---|---|
| C | 362 + 63 | 0.82 / 0.87 | 0.89 / 0.87 | 0.85 / 0.87 |
| M | 169 + 29 | 0.70 / 0.74 | 0.48 / 0.69 | 0.57 / 0.71 |
| Mrk | 333 + 58 | 0.91 / 0.94 | 0.88 / 1.00 | 0.89 / 0.97 |
| PN | 13 + 2 | 1.00 / 1.00 | 1.00 / 1.00 | 1.00 / 1.00 |
| sd | 601 + 106 | 0.93 / 1.00 | 0.98 / 0.98 | 0.95 / 0.99 |
| Accuracy | 1478 + 258 | 0.88 / 0.93 | ||
| Macro avg | 1478 + 258 | 0.87 / 0.91 | 0.85 / 0.91 | 0.86 / 0.91 |
| Weighted avg | 1478 + 258 | 0.87 / 0.93 | 0.88 / 0.93 | 0.87 / 0.93 |
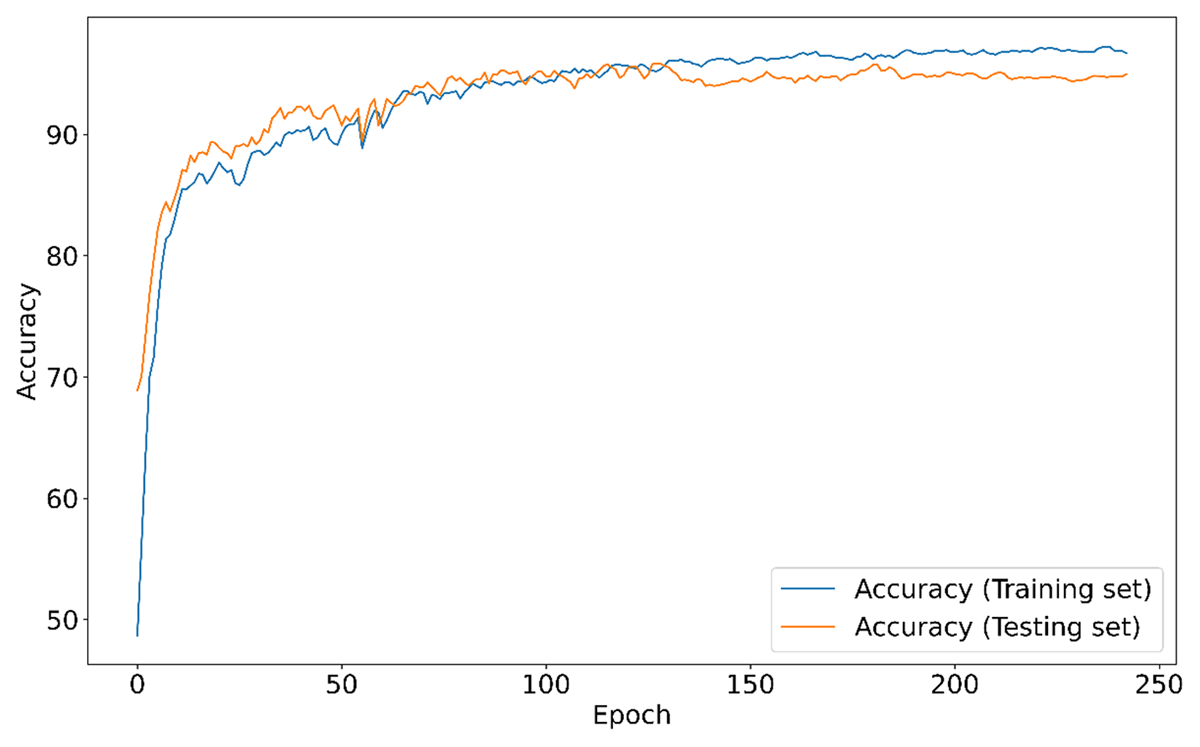
Figure 4
The accuracy of training and testing sets for the sub-object classification dataset.
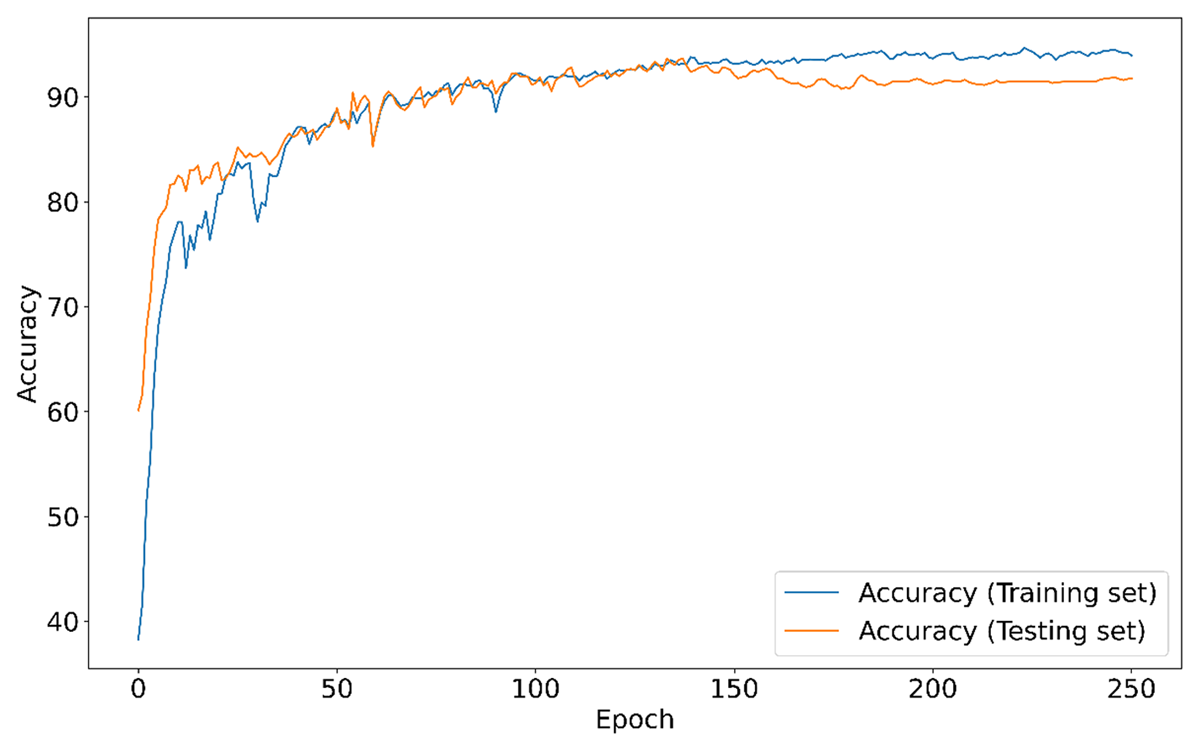
Figure 5
The accuracy of training and testing sets for the group classification dataset.