
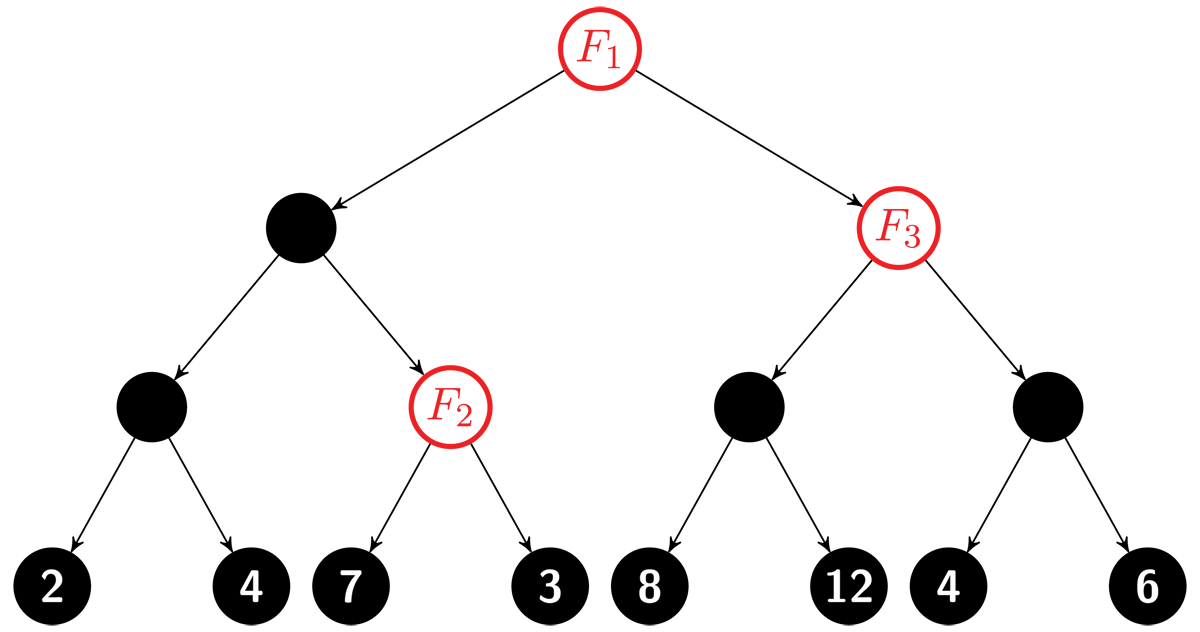
Figure 1
Each occurrence of feature F splits the dataset into two parts. In the example, F1 creates partition classes L1 = {2, 4, 7, 3} and R1 = {8, 12, 4, 6}. The split at F2 creates classes L2 = {7} and R2 = {3}, whereas the split at F3 defines L3 = {8, 12} and R3 = {4, 6}. The model is agnostic to any features other than F.
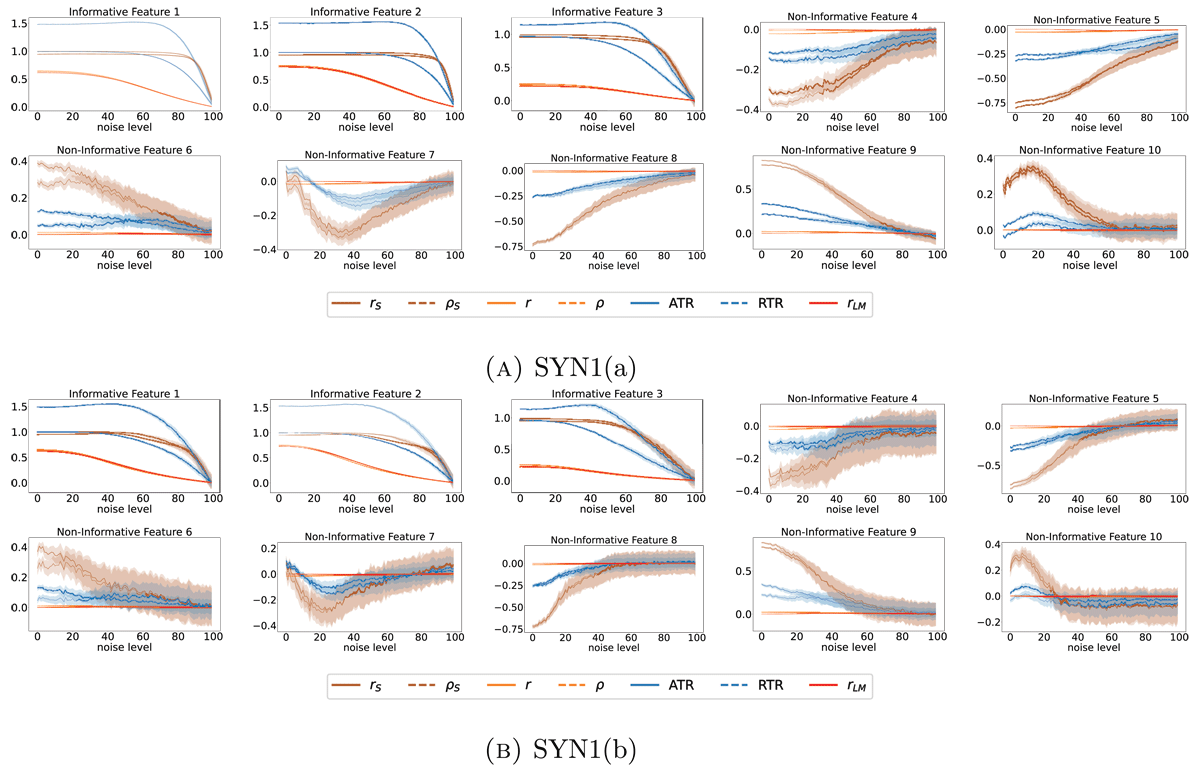
Figure 2
Mean and 95% confidence interval for the different trend estimators on SYN1(a) and SYN(b) for 250 independent trials each. On the x-axis, the proportion of noise is reported. Features 1–3 are informative, whereas features 4–10 are non-informative.
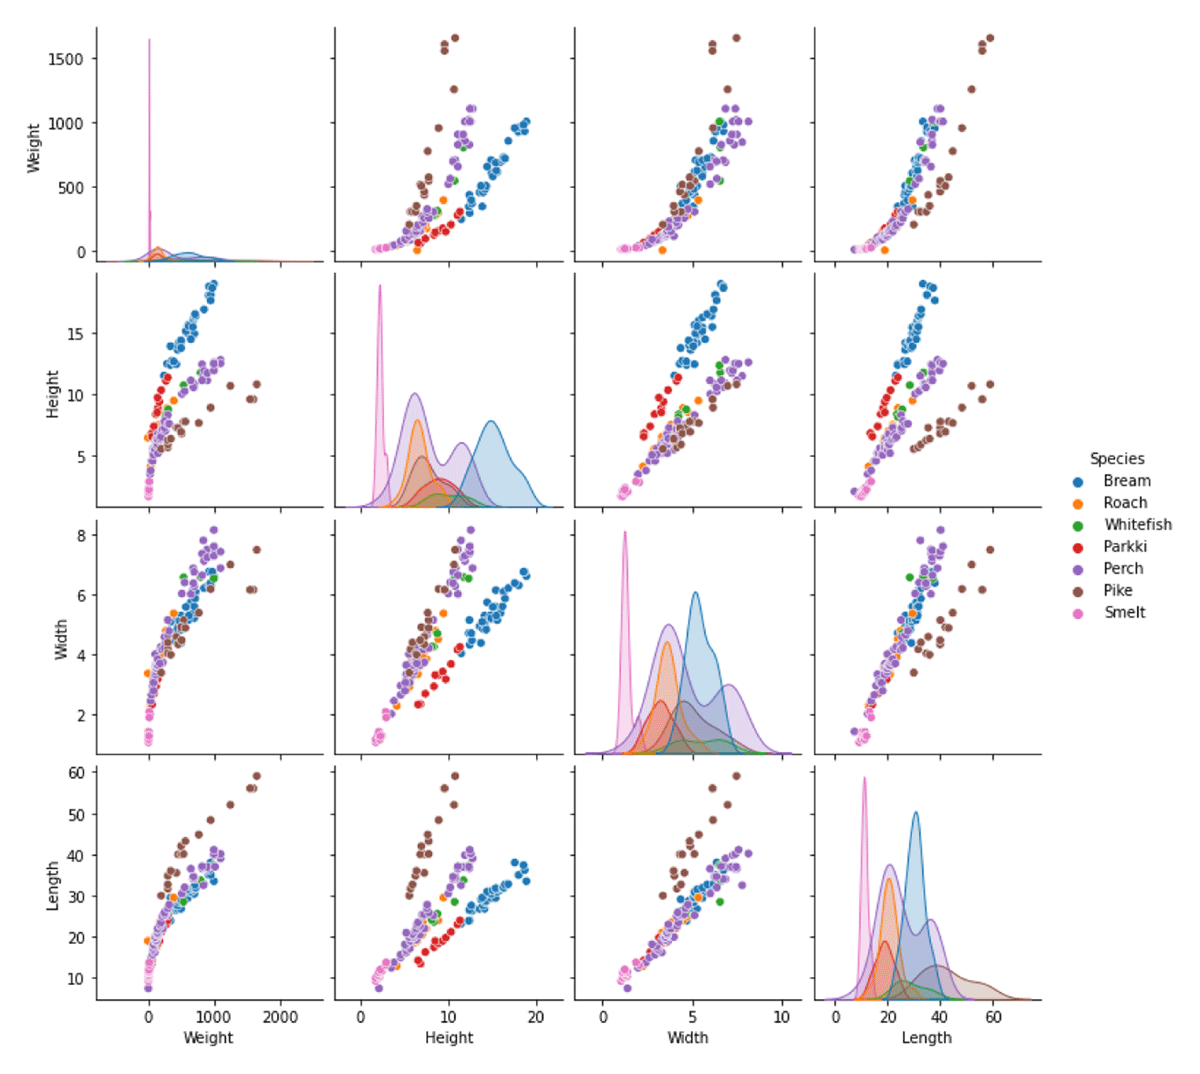
Figure 3
Pairplot of the used fish market dataset features (weight, height and width) and the predicted variable (Length).
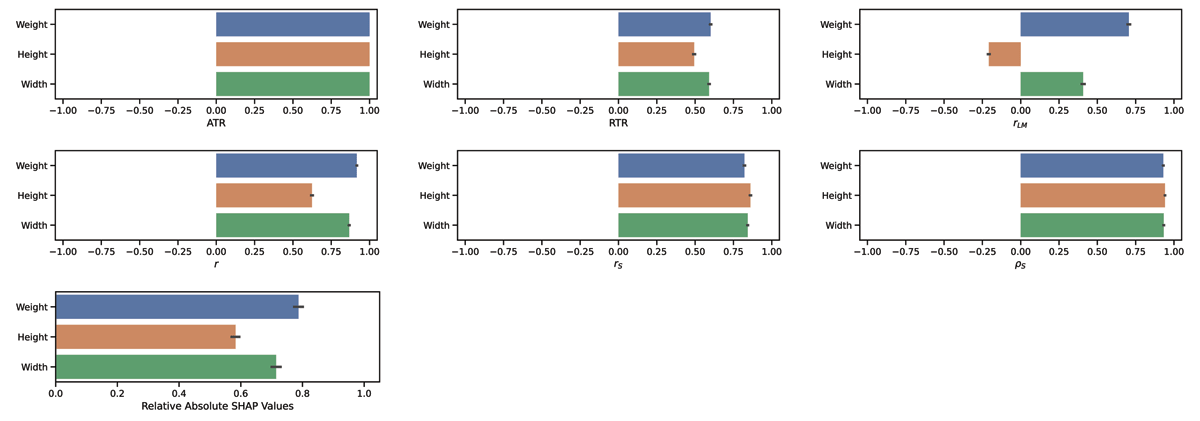
Figure 4
Comparison of the trend estimators for FISH. We report the mean and the standard deviation of the different trend estimators over 100 bootstrap iterations, each containing 70% of the data. Relative absolute SHAP values shows the absolute sum of the SHAP values for each run, divided by the highest respective sum.
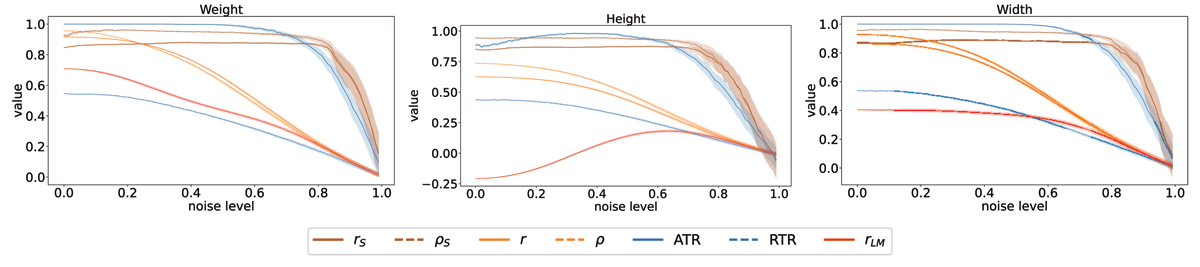
Figure 5
Mean and 95% confidence interval w.r.t. 100 independent iterations over noise on FISH. The x-axis reports the proportion of noise mixed to the real data.
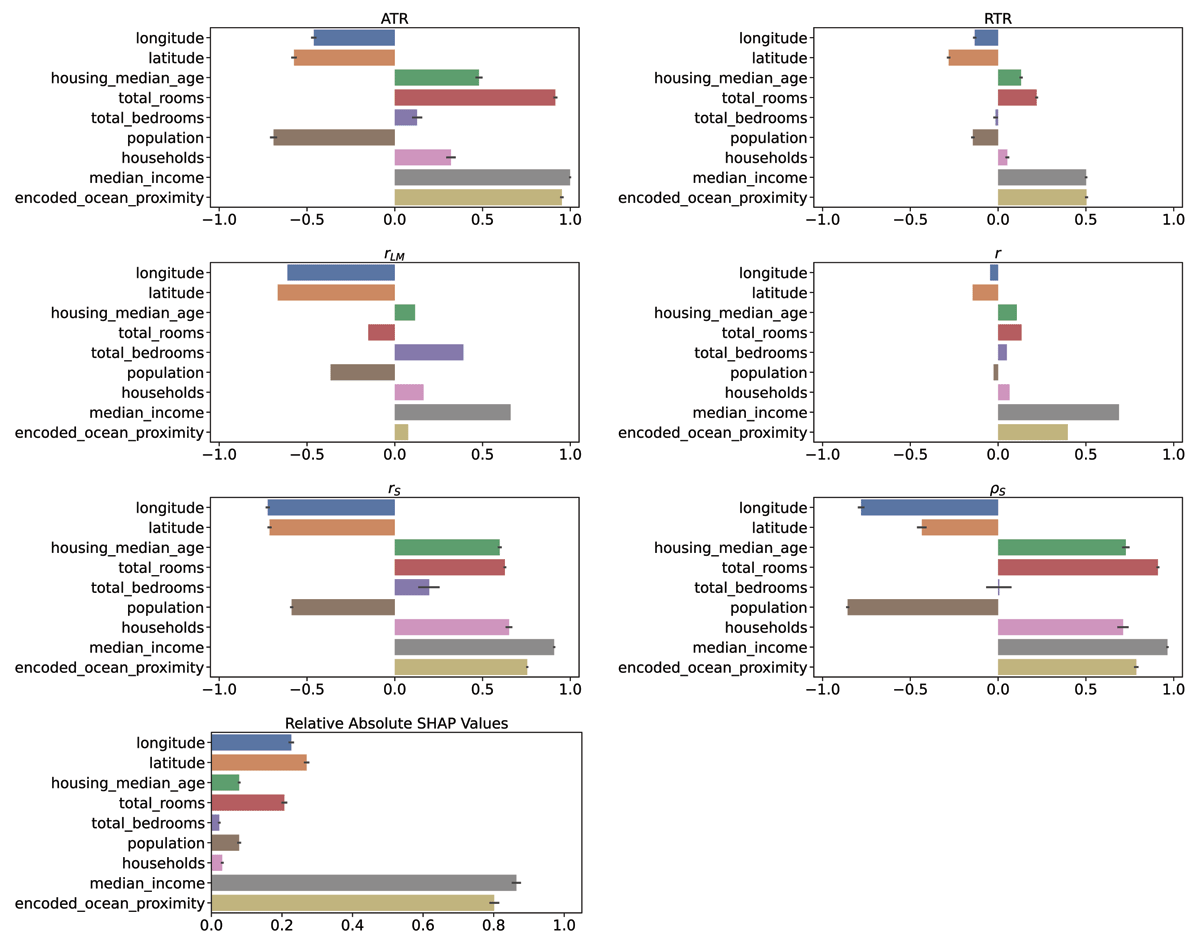
Figure 6
Comparison of the trend estimators on HOUSING. The linear model assigns a negative coefficient to the total number of rooms feature, even though the feature itself is positively correlated to the target.
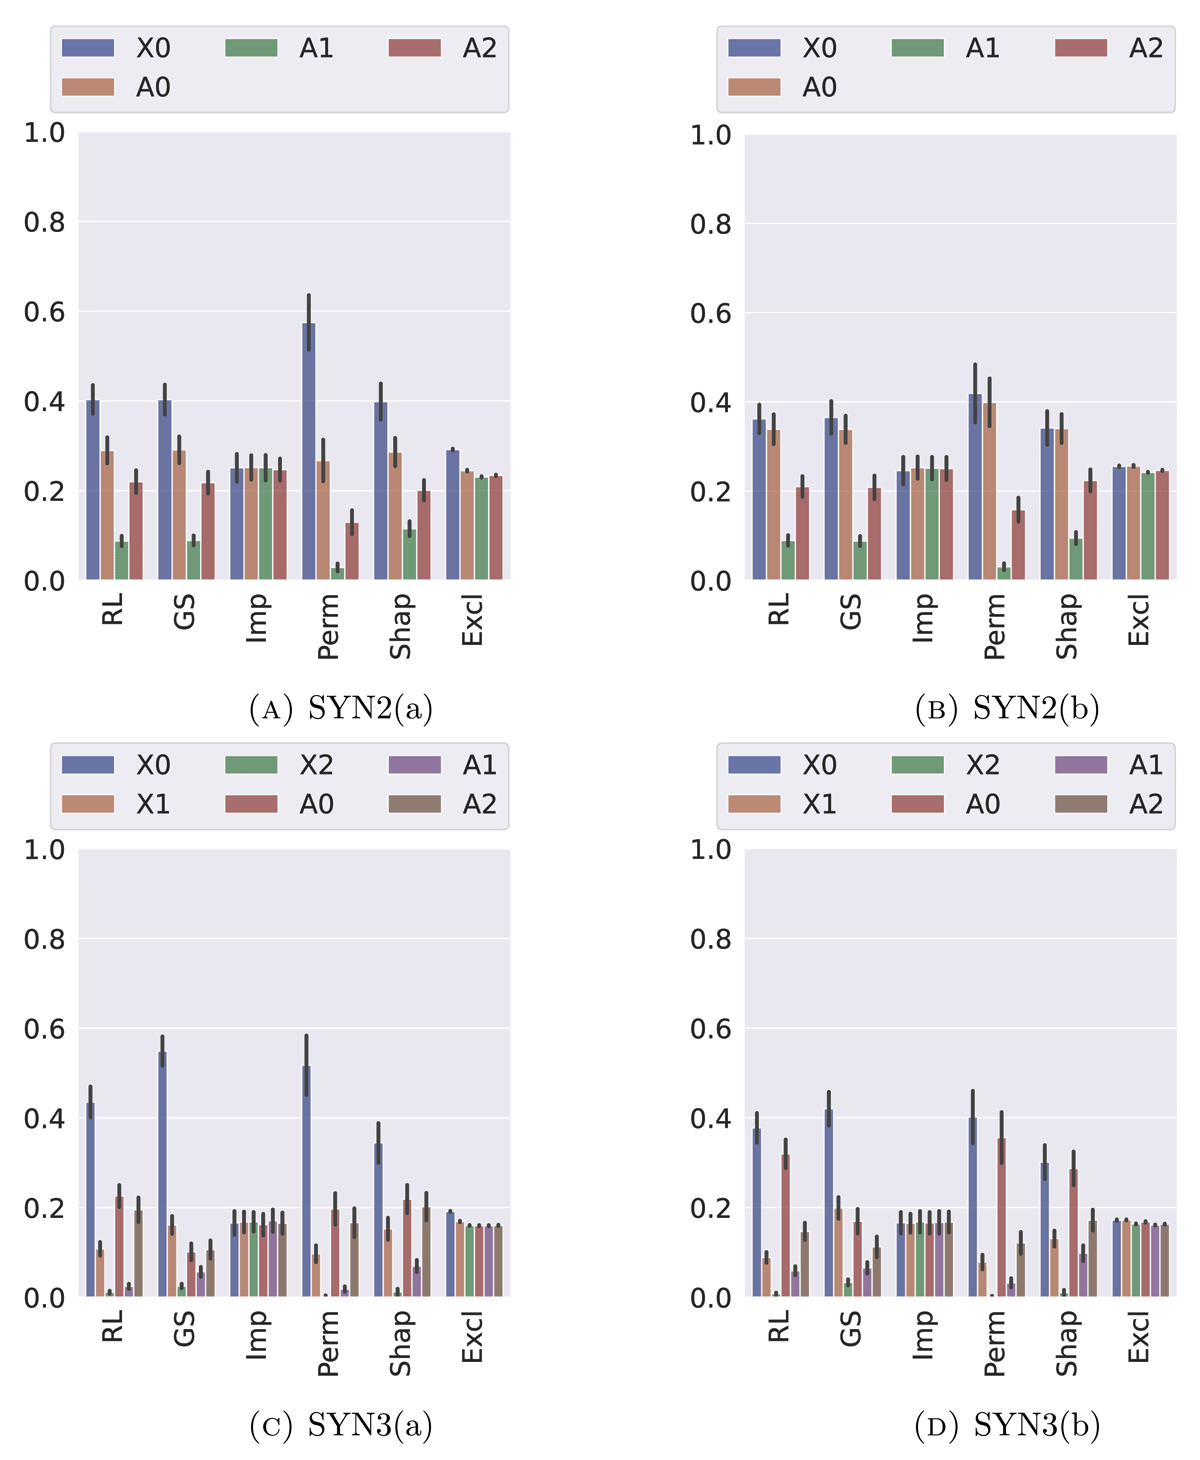
Figure 7
Comparison of the six different notions of feature importance on synthetic data. Figures A and B show results with respect to SYN2(a) and SYN2(b). Here, the labels are generated as , and {Ai} are given as by for differently strong Gaussian noise (SYN2(a)) and white noise (SYN2(b)). Figures C and D show results with respect to SYN3(a) (Gaussian noise) and SYN3(b) (White noise). Here, the labels are generated as , thus two more (weakly) informative features are given.
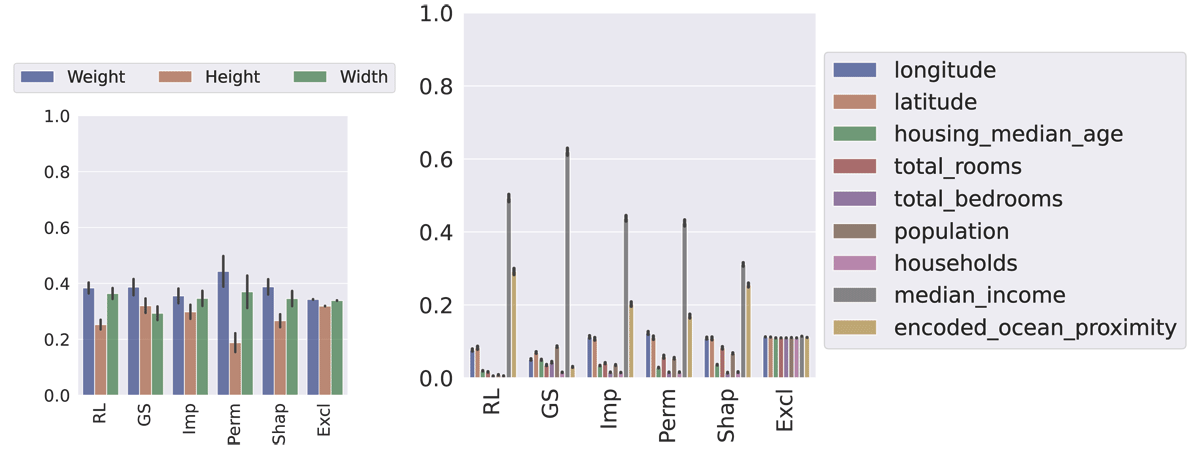
Figure 8
Comparison of the six different notions of feature importance on real-world instances. The l.h.s. reports the feature importance scores on the FISH dataset (mean and standard deviation over 400 independent runs), the r.h.s. on HOUSING (mean and standard deviation over 100 independent runs).