
Figure 1
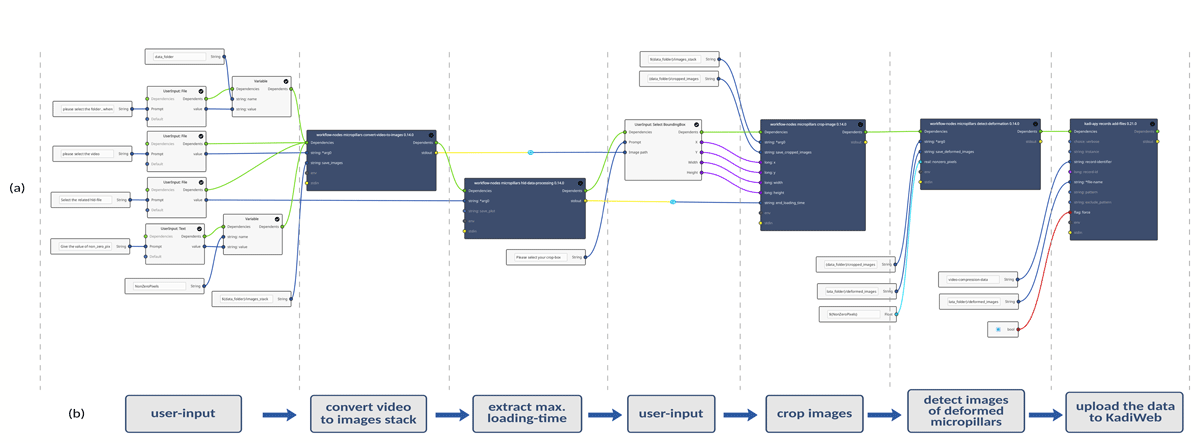
(a) Visualization of the workflow created in the KadiStudio workflow editor, in order to automate data (SEM videos + compression data file) processing for microcompression tests. (b) Simplified flowchart representing the task of each segment of the workflow shown in (a).
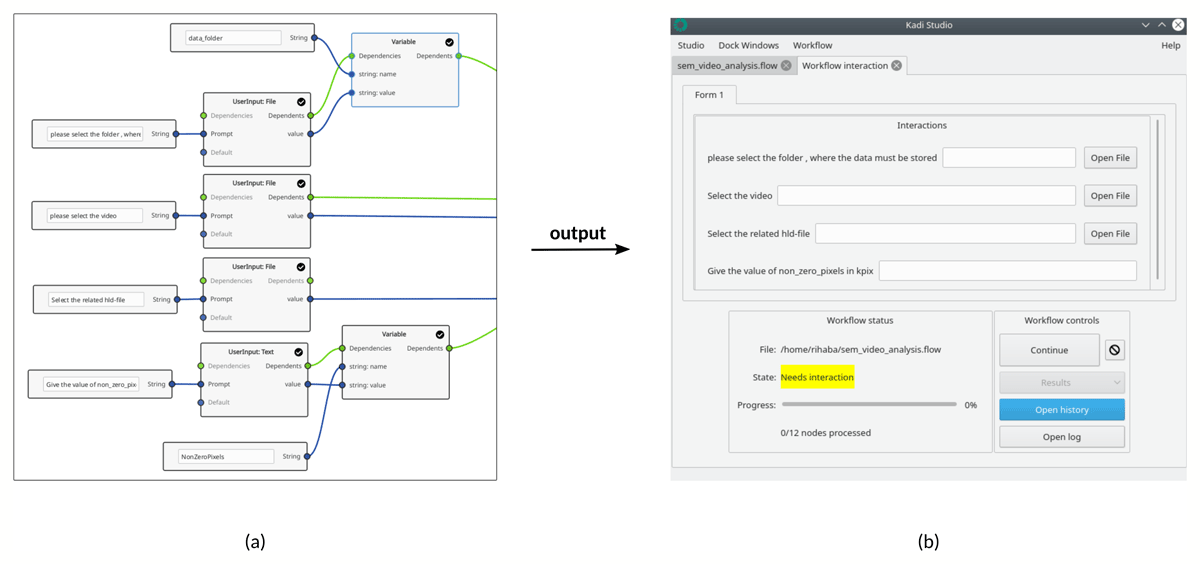
Figure 2
(a) User input nodes: UserInput: File and UserInput: Text, as well as Variable nodes. After execution of the user input nodes, the user is prompted through a dialog box (b) for an input, in this case to select the folder in which the outputs will be saved, the hld-file (a text-format file containing the micro-compression data), test parameters and the value of nonzero pixels. The folder path, as an example, is passed into a variable to be used several times in the workflow.
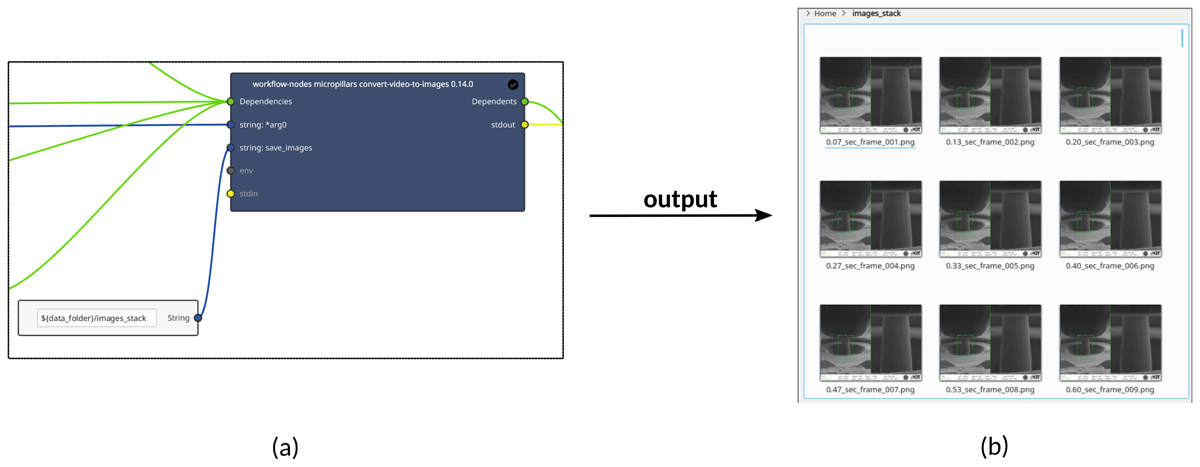
Figure 3
(a) convert-video-to-images node: converts, for example, the acquired in situ SEM video into an image sequence. The timestamp for each image is calculated and embedded inside the name of each image (b).
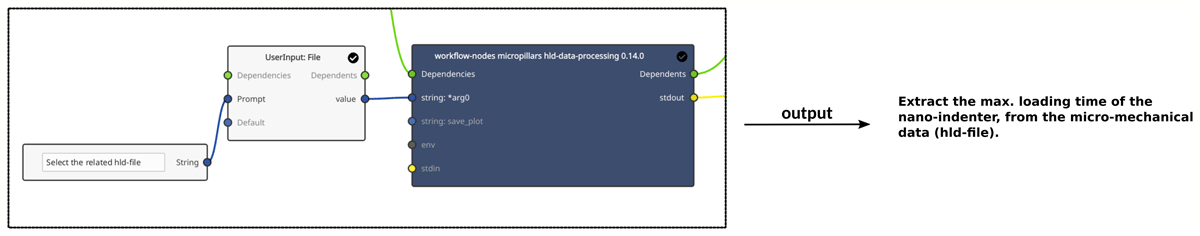
Figure 4
Image of the hld-data-processing node, which can be used to, for example, extract the maximum loading time of the nanoindenter.
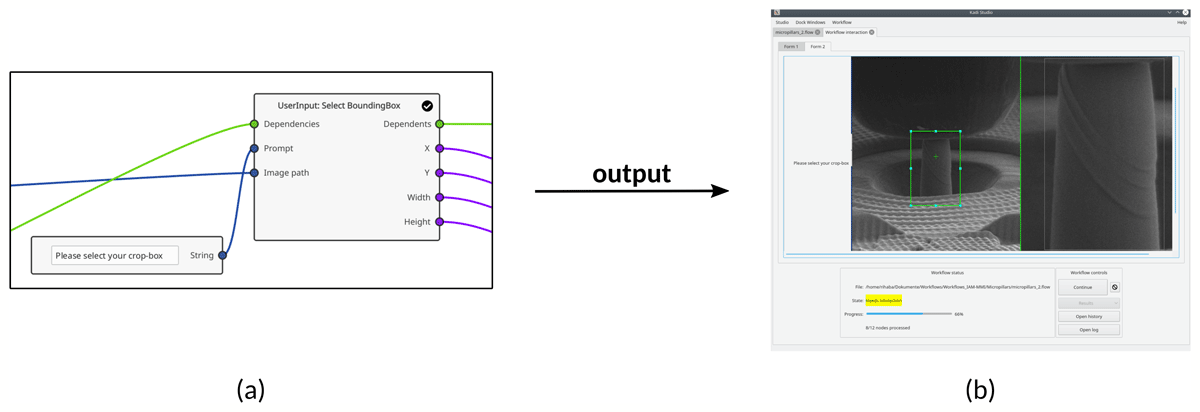
Figure 5
(a) The built-in UserInput: Select Bounding Box node. (b) The corresponding user interaction GUI created by this node, which prompts the user to select an area of the image. The position and size of the selected area will be available to other nodes in the workflow.
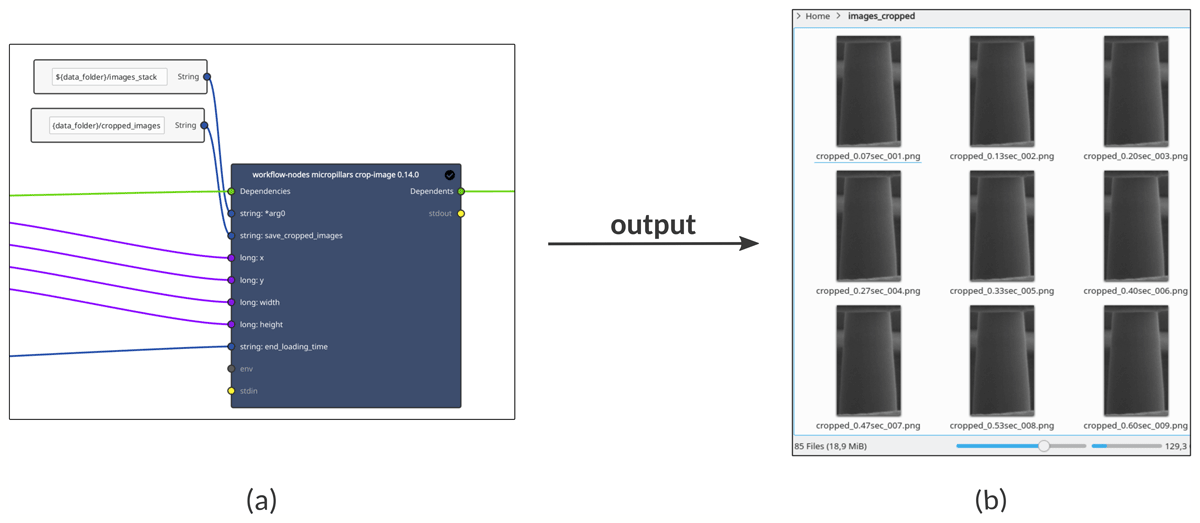
Figure 6
(a) The crop-image node, which takes the user-defined coordinates and size of the bounding box from the previous node (Figure 5a), as an input to crop all images in the image-stack folder, until the maximum loading time of the nanoindenter is reached. This means that only images obtained before or at the maximum loading time will be cropped.
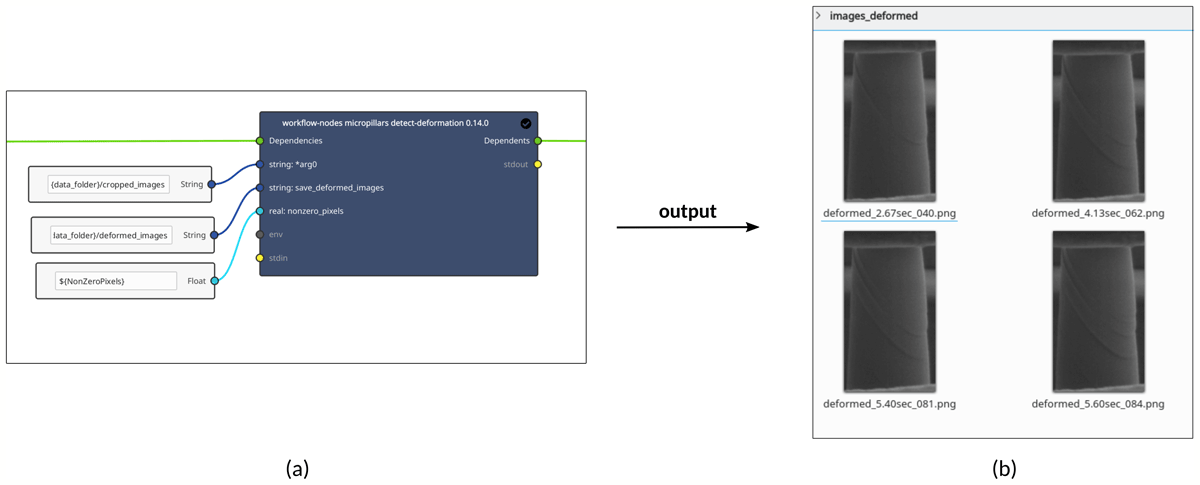
Figure 7
(a) The detect-deformation node to automatically detect the images showing micropillar deformation from the cropped images created by the crop-image node in Figure 6a. (b) The execution result of the node: Images showing micropillar deformation are separately saved in a new folder.
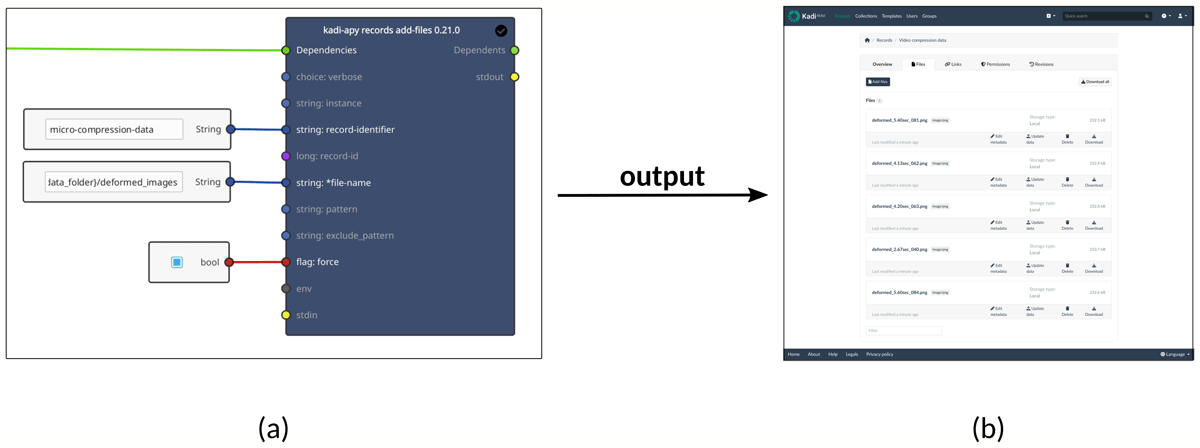
Figure 8
(a) The records add-files tool node to upload the data to KadiWeb. (b) A screenshot of the record’s files overview in KadiWeb showing the uploaded data.
Table 1
A simple comparison between the manual and the automated SEM video processing methods.
| VIDEO ANALYSIS WAY | SPEED | ACCURACY | REPRODUCIBILITY |
|---|---|---|---|
| Manual | Slow | Medium | Low |
| Automated workflow | Fast | High* | High |
[i] * Depends on the provided NZP-value and the SEM-video quality.
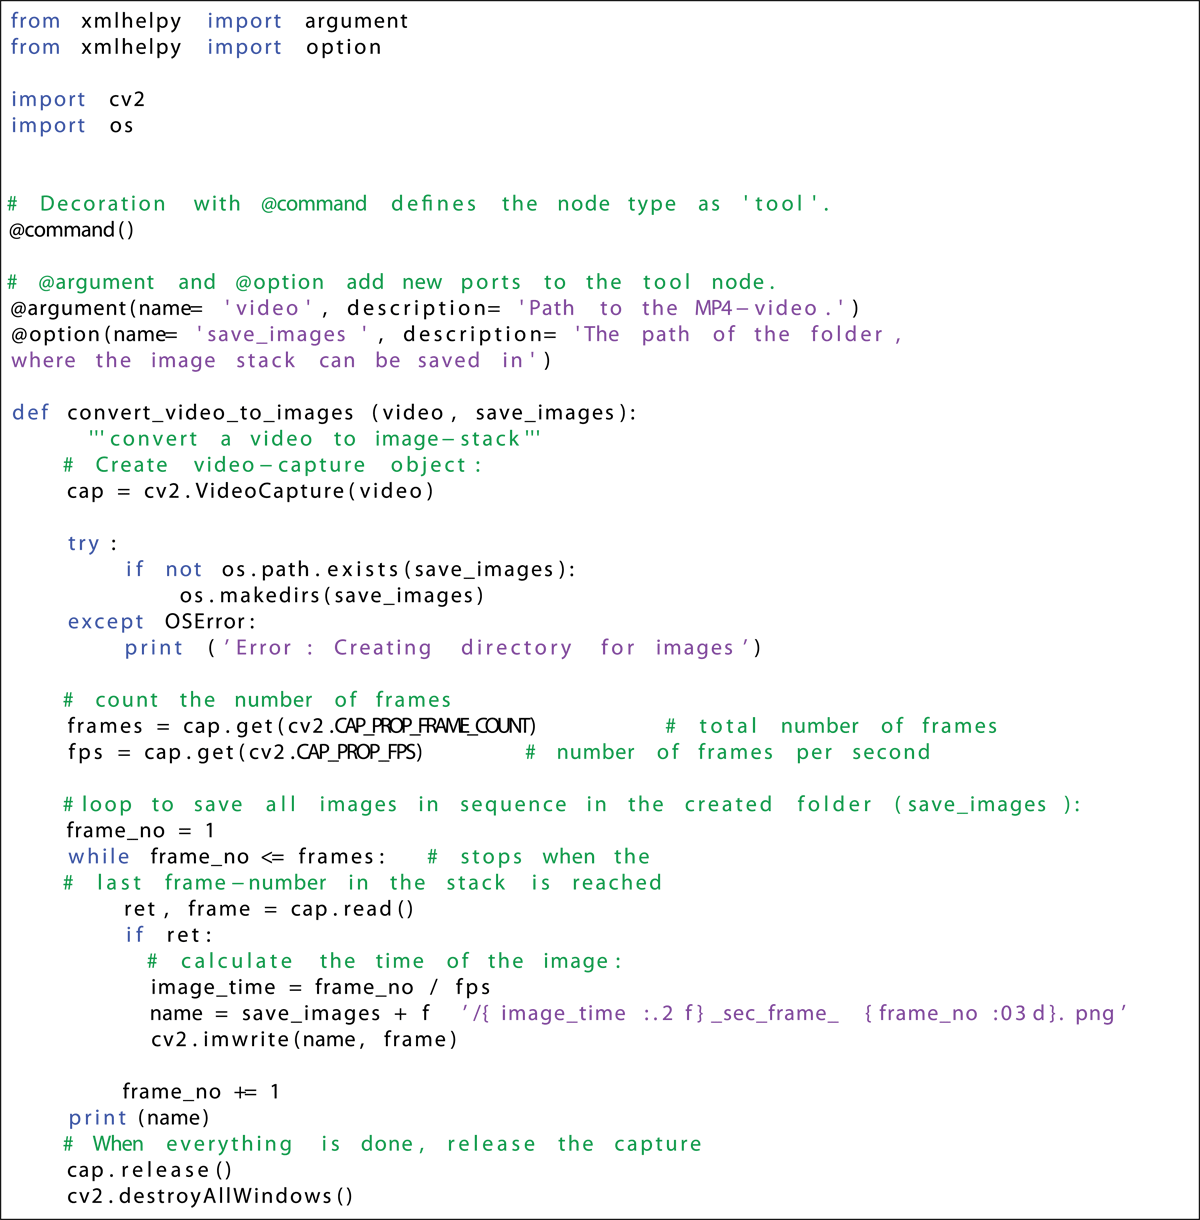
Listing 1
Tool node example.