
Table 1
Mapping of the Peng et al. (2021) guidelines to the EQC framework characteristics described here.
| FAIR-DQI GUIDELINES (PENG ET AL. 2021) | EQC FRAMEWORK DESCRIBED IN THIS PAPER |
|---|---|
| Guideline 1: dataset | The dataset is described with a comprehensive online page providing various information that includes DOI, rich metadata, and licence. |
| Guideline 2: assessment model | The assessment method is available online together with the quality information. This paper itself details further the assessment model used. The assessment model is versioned and publicly retrievable. |
| Guideline 3: quality metadata | The assessments are captured into a structured schema/template (QAT). The quality information is standardised in a machine-readable (in our case using the CMS) and reusable form. |
| Guideline 4: assessment report | The quality information is structured in a template and is accessible online, versioned, and human-readable. |
| Guideline 5: reporting | The assessments are disseminated in an organized way via a web interface including the quality aspects assessed, the evaluation method, and how to understand and use the quality information. |
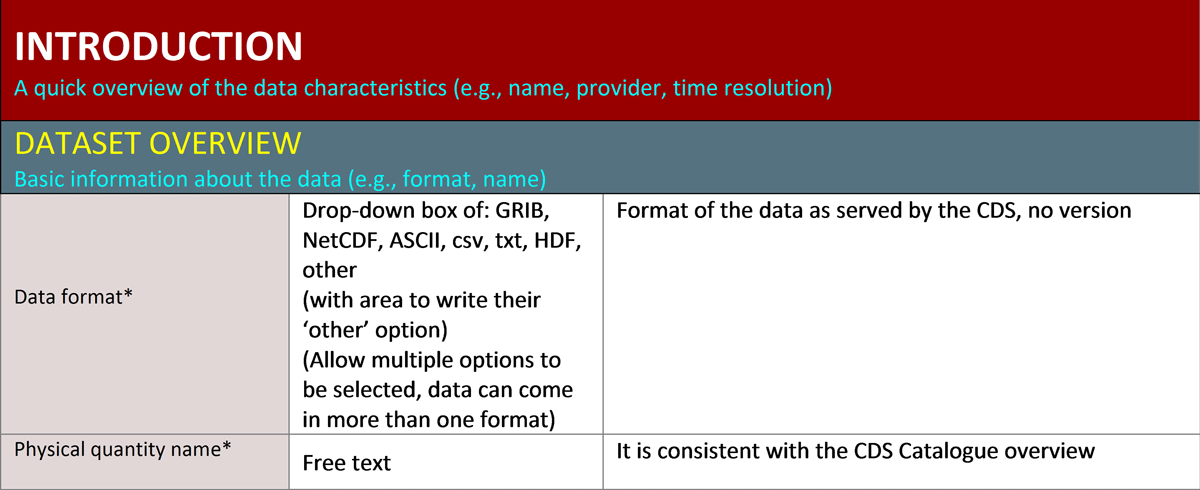
Figure 1
QAT excerpt: the cells of the synthesis table (Figure 2) correspond to the subsections of the QAT (yellow text), while the column titles of the table correspond to the QAT sections (white text). The fields with an asterisk indicate the minimum requirements (see section 3.1). The QAT questions are in the grey area (left column). The middle column defines the data type, the rightmost column reports guidance about the type of content expected. Text in cyan appears as a tooltip when hovering the mouse over the web-form of the synthesis table.
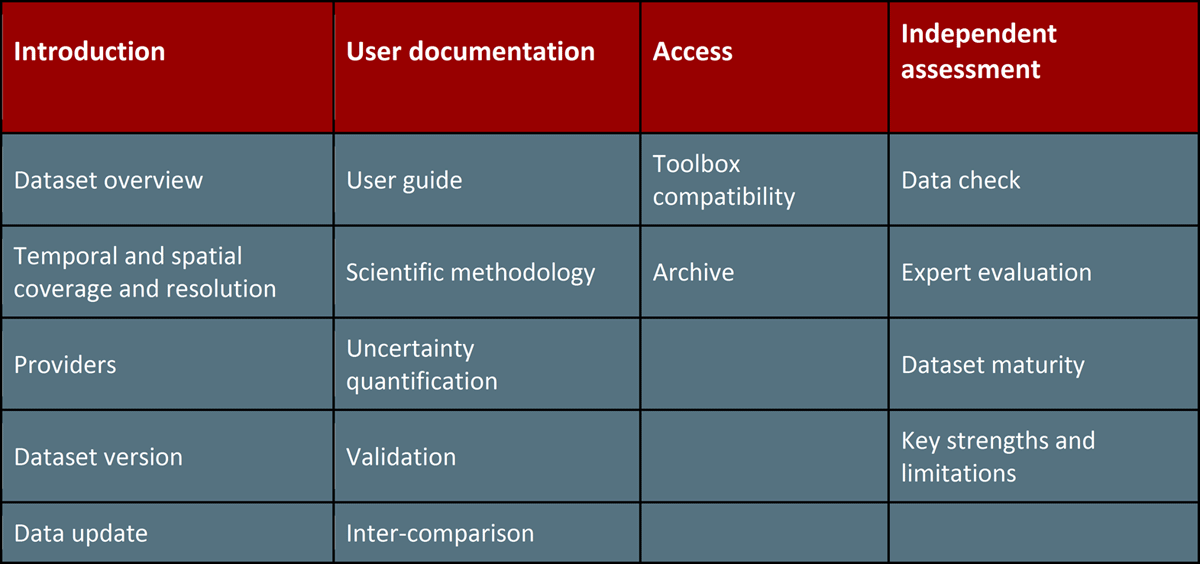
Figure 2
Synthesis table, conceived as a tool to organise and homogenise the EQC information, as well as to guide users through the documentation. The table fields, each identifying an aspect of the dataset, are grouped into columns. Note the correspondence between the field ‘dataset overview’ of the column ‘Introduction’ and Figure 1.
Table 2
Roles involved in the QAR production workflow.
| ROLE | RESPONSIBILITY |
|---|---|
| EQC main contact | One EQC team member who acts as the main contact of a specific dataset category. As QAR production is a multi-actor process, it is important that there is a central person, the EQC main contact, to coordinate the QAR production. This member contacts the data providers to agree on when they are available to fill in the QAT. Once the link with the providers is established, the EQC main contact defines the QAR name, fills in the QAT entries that identify the QAR uniquely and selects the team involved in the QAR production. Eventually, the EQC team member lets the actors involved know where there is a potential issue before it impacts the production. |
| Data provider | Typically, a member of the team that provided the CDS with the dataset under evaluation. The providers fill in the information requested in the QAT, because they are considered the best source to fully describe their datasets and so are the preferential choice for this task. |
| Evaluator | An EQC member who vets the QAR content and fills in the independent assessment fields. This role interacts with the provider for guidance about the amount and type of content expected and for any clarification needed. |
| Reviewer | An EQC member who scrutinises the whole QAR content for completeness and understandability. The reviewer is fundamental, because of her/his work in checking and verifying the correctness and consistency of all information introduced, while interacting with the evaluator to address any issue encountered. |
| Approver | Role covered by one C3S governance board member, who makes decisions about the publication of the dataset, (also) based on the QAR, and conducts a final check of the QAR before making it public together with the dataset. If the QAR requires further review, it will be sent back to the EQC team, commenting about what is still needed. Otherwise, it will be published in the CDS. |
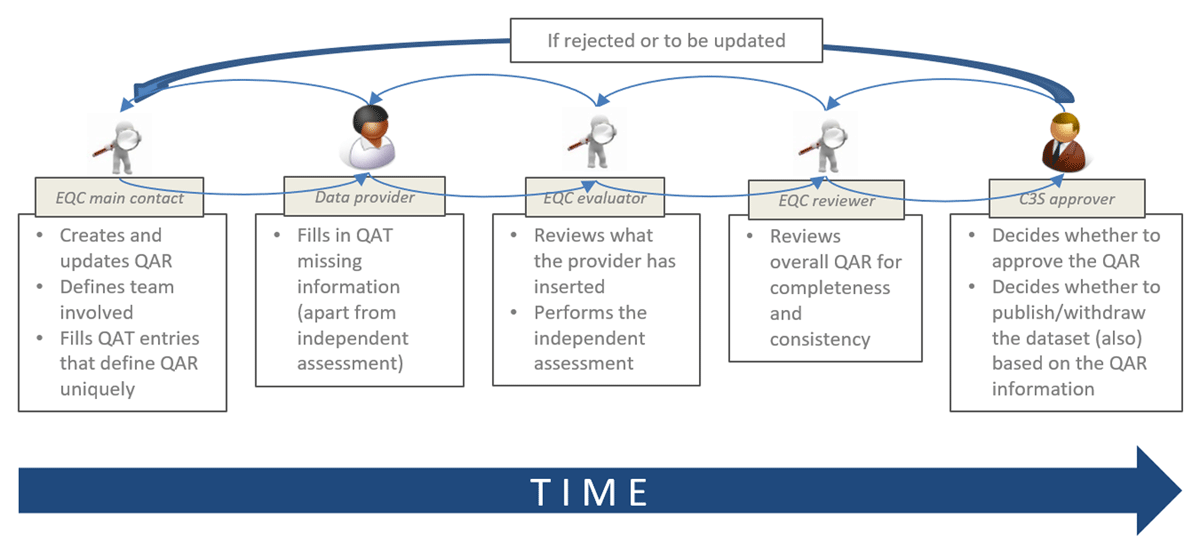
Figure 3
Sketch showing the basic roles, their interactions, and their responsibilities during the QAR production within the CMS. Note the iteration loop between roles to allow refinement of the content. The sketch gives a grasp of the more complex workflow shown in the next figures.
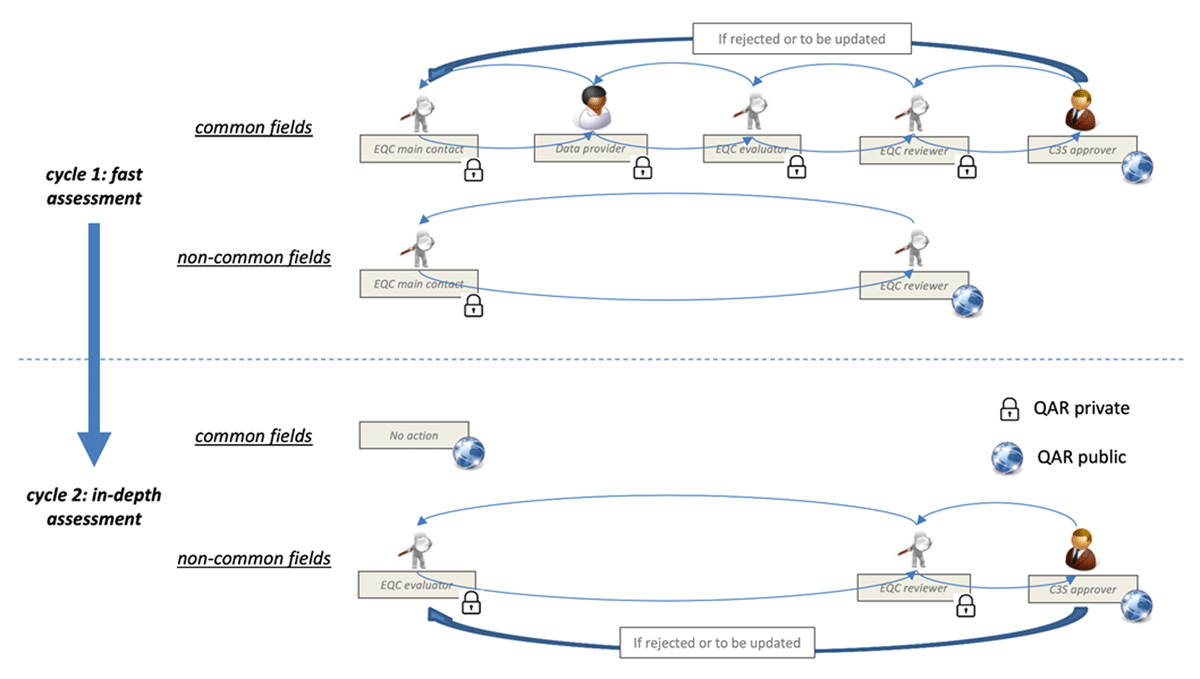
Figure 4
Sketch showing the interaction across roles during the QAR production within the CMS. Compared to Figure 3, here the distinctions between fast/in-depth assessment cycles and common/non-common fields are explicit and it is clarified at which stage the QAR is published.
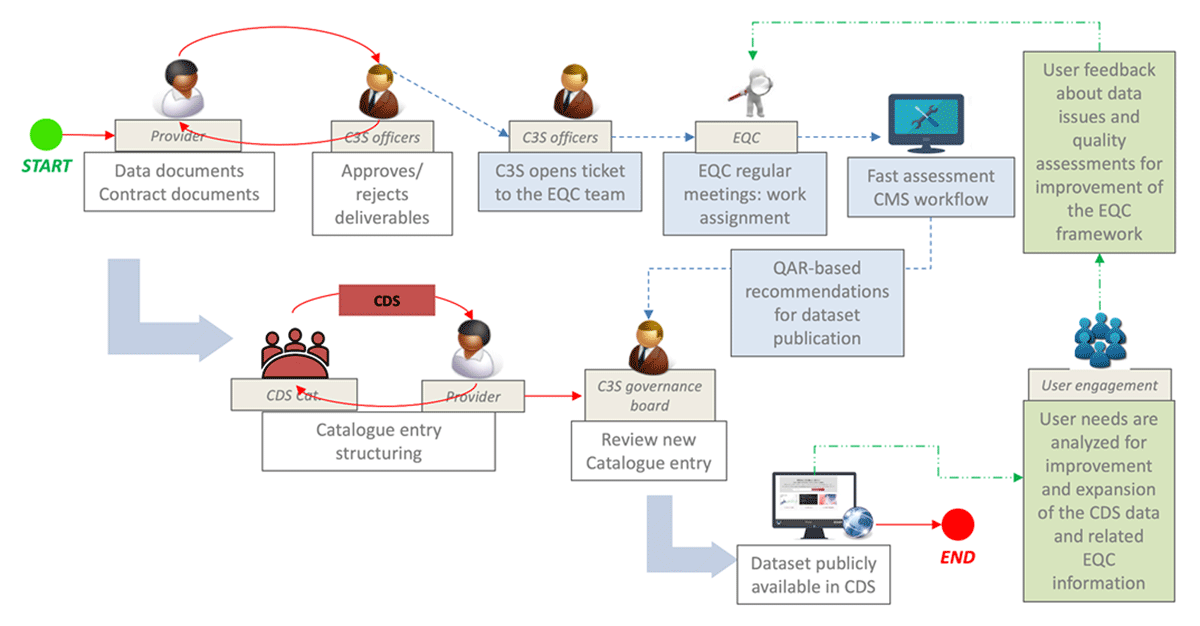
Figure 5
Scheme of the preliminary workflow about the way EQC may be engaged in the fast assessment of datasets not yet published in the CDS. Once a dataset is published (identified with ‘end’ in the figure), the in-depth assessment cycle starts as usual. The part associated with the EQC is in light blue, while the part associated with the EQC user engagement team is in green.