
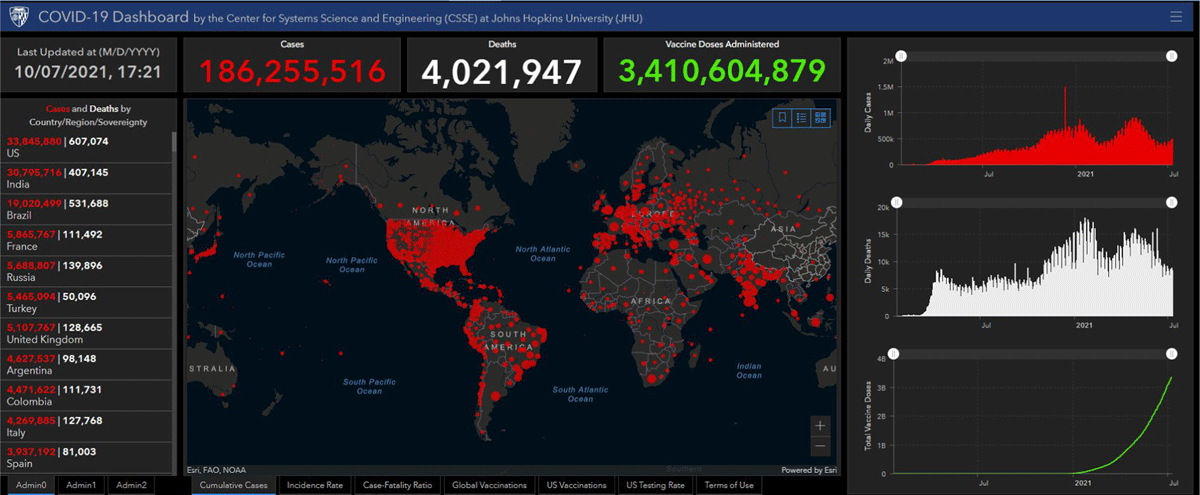
Figure 1
A Johns Hopkins COVID–19 visualisation dashboard.
(Source: https://coronavirus.jhu.edu/map.html)
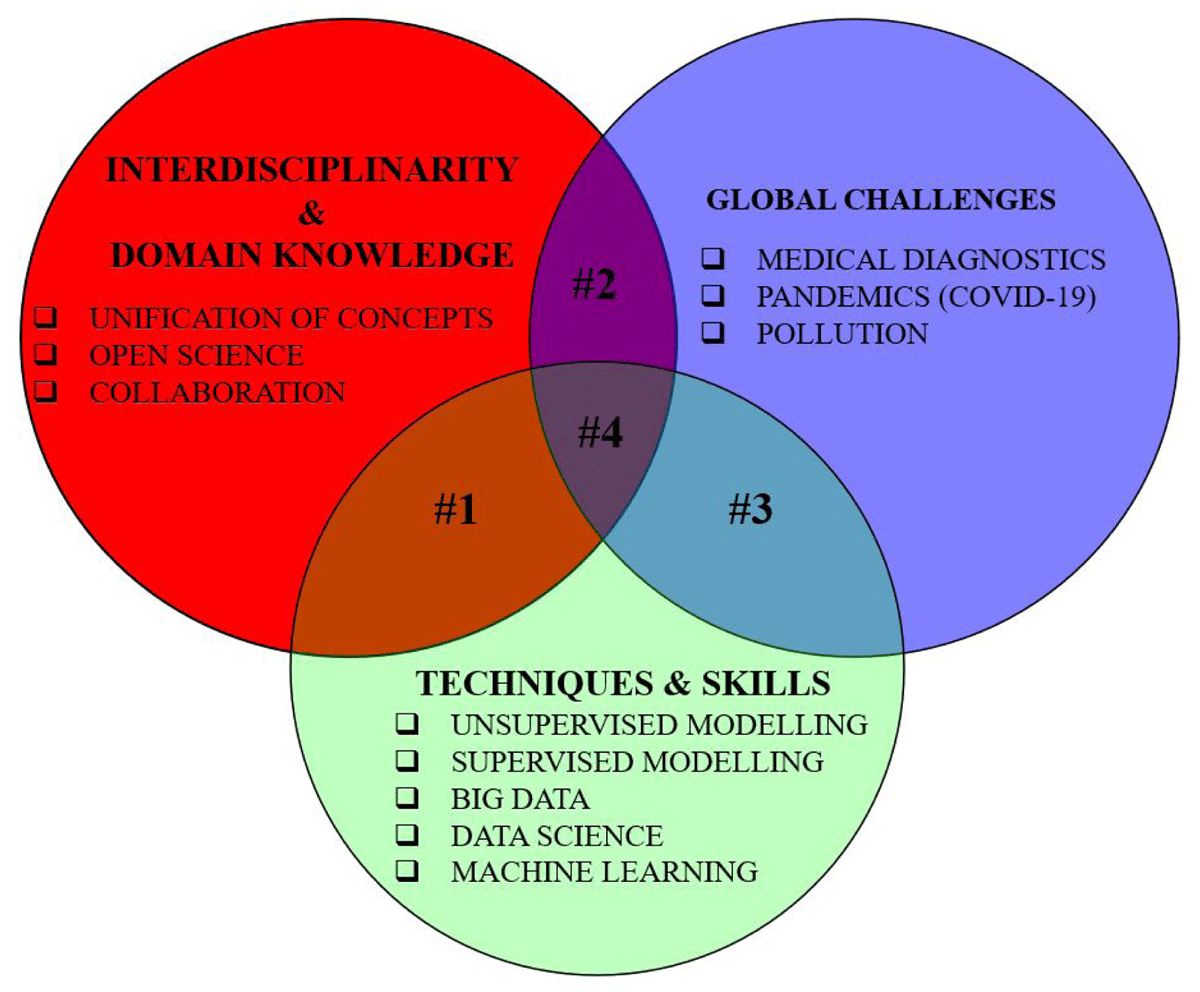
Figure 2
A diagrammatical illustration of the interaction of challenges, data and skills.
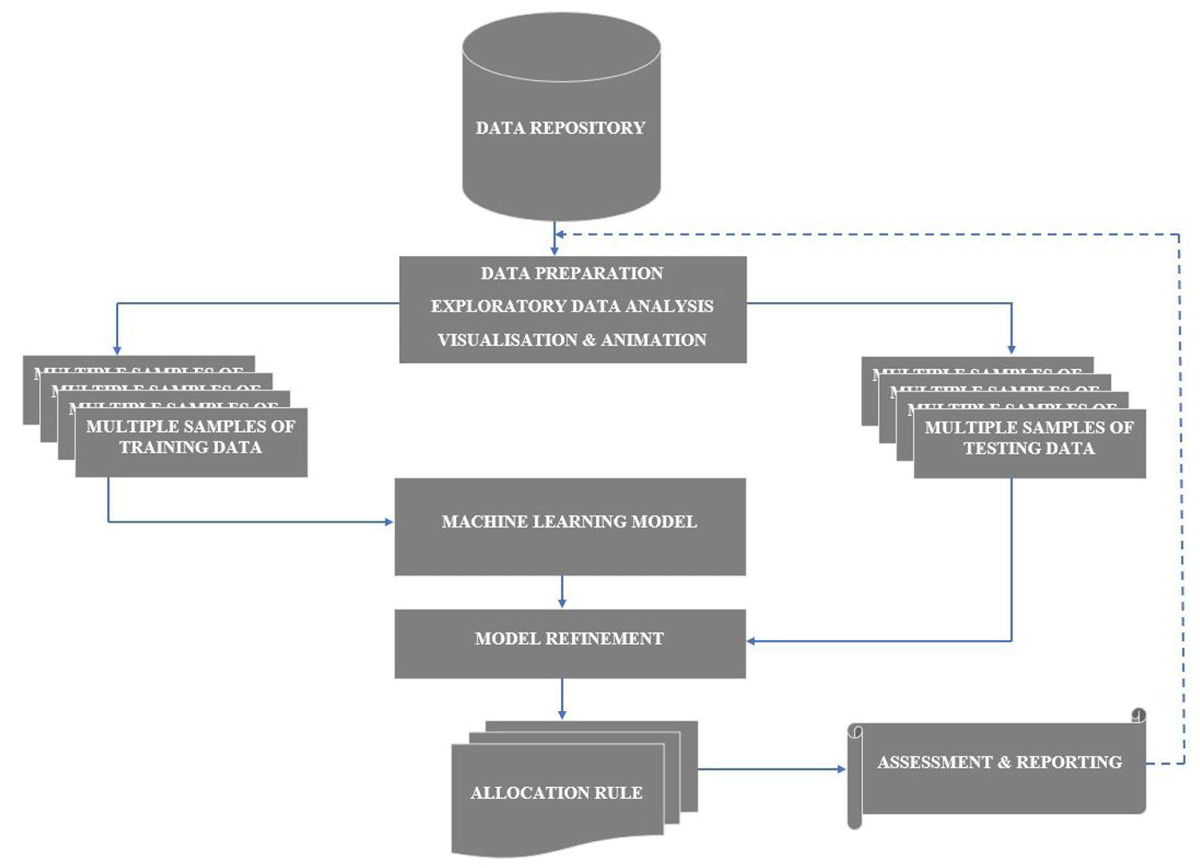
Figure 3
Graphical illustration of the CNN classification and assessment process.
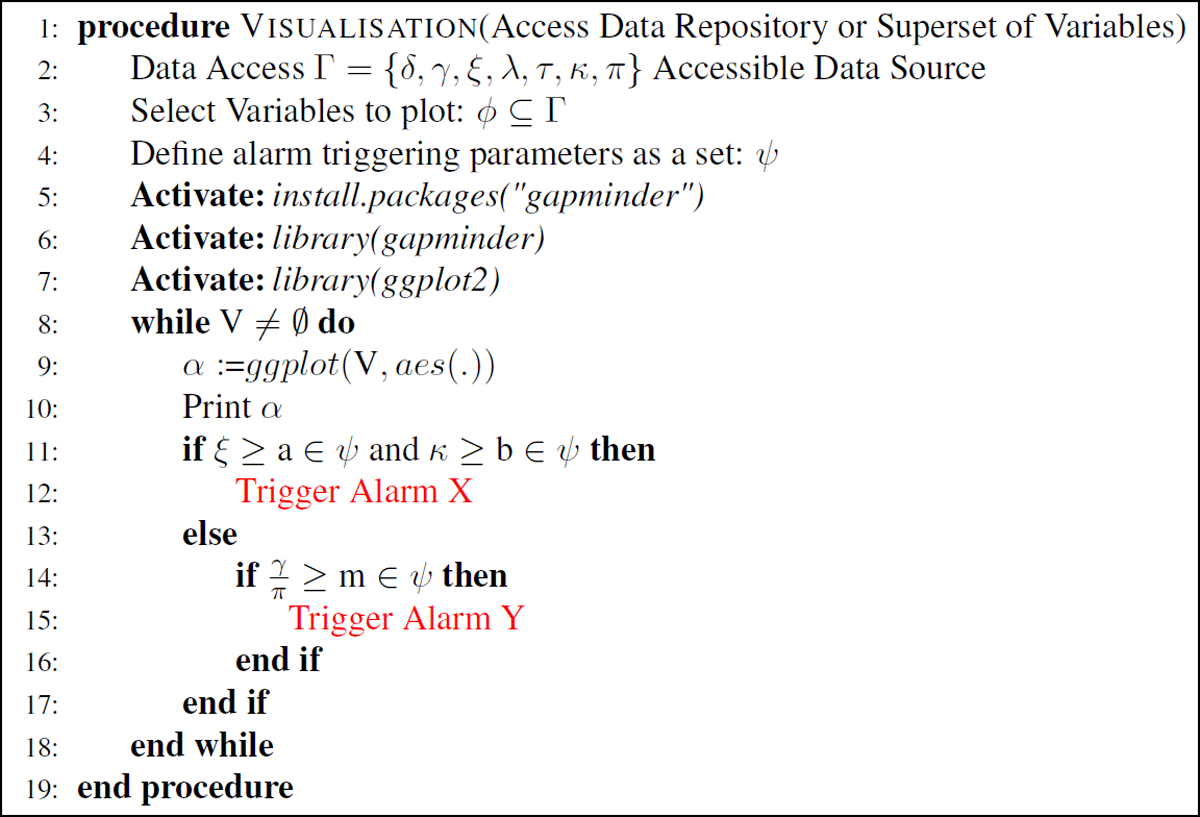
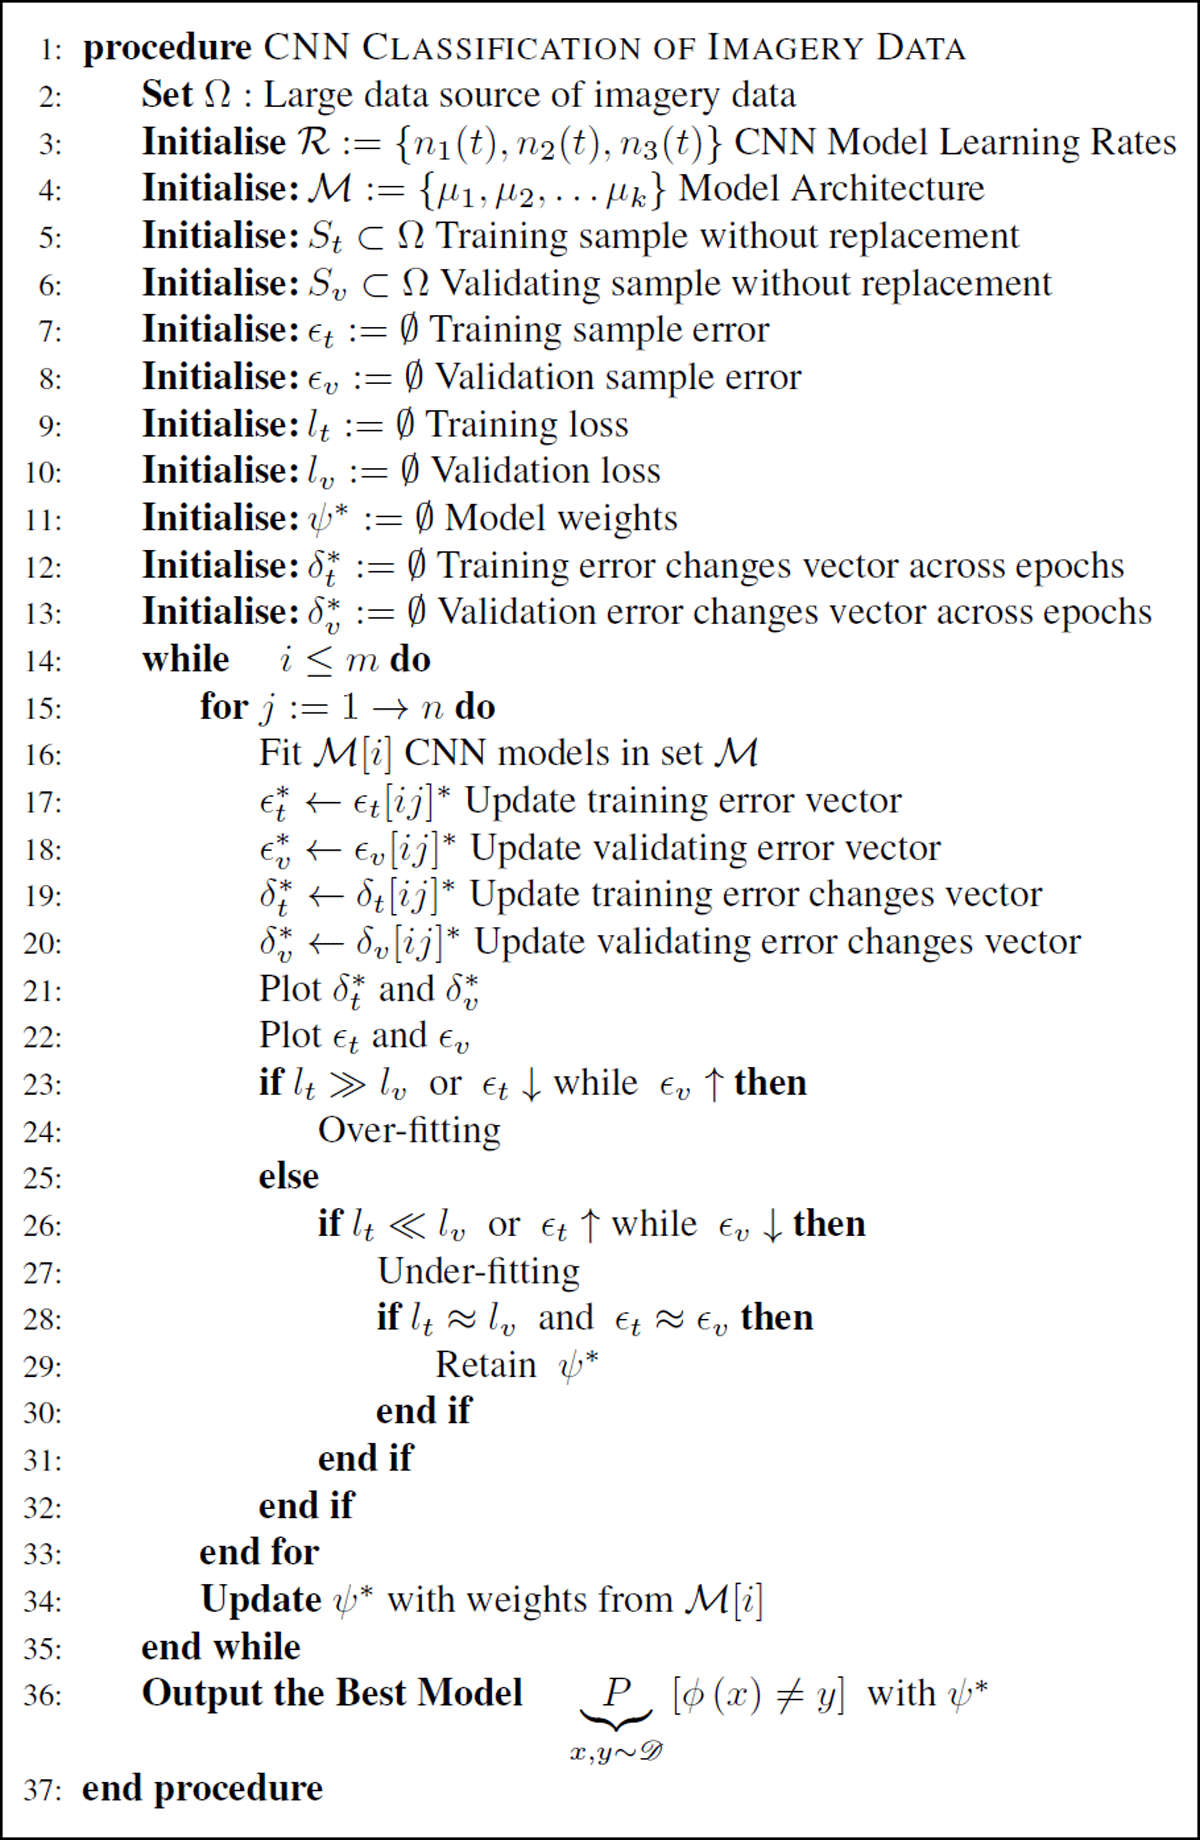
Algorithm 1
Adaptation of the SMA Algorithm (Mwitondi et al. 2020) for Animation & Visualisation.
Table 1
Typical variables of interest for animation and visualisation.
| VARIABLES | NOTATION | DESCRIPTION AND RELEVANCE |
|---|---|---|
| Population | δ | Population affected by a phenomenon: This may be a national, regional or city population from which other variables are obtained |
| GDP | ɣ | Gross Domestic Product of a country: Vital for comparative purposes |
| Unemployment | ξ | Unemployment rate: Global, national, regional or city level |
| Location | λ | Where a phenomenon happens: Useful for spatio–temporal comparisons |
| Time | τ | Year, month, week, day etc: Useful for spatio–temporal comparisons |
| COVID–19 | κ | Deaths, infections, hospitalisation rates, variants |
| PPE | π | Personal Protective Equipment: Associated with COVID–19 etc. |
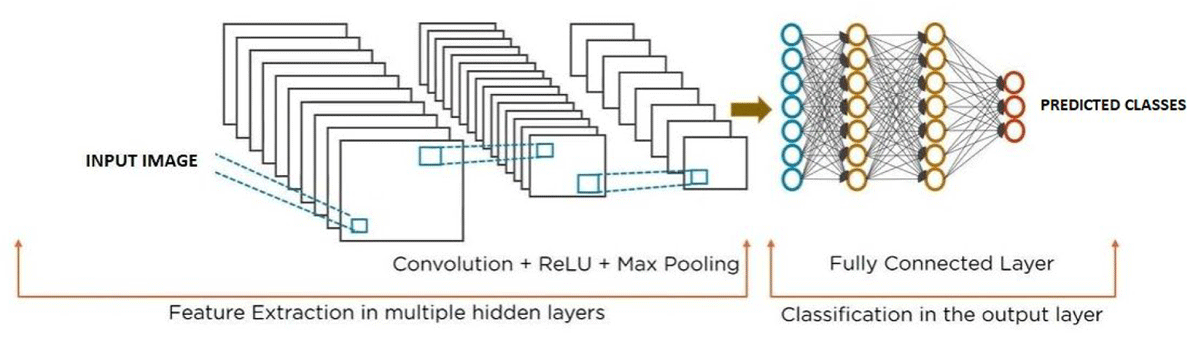
Figure 4
An architecture of a CNN model.
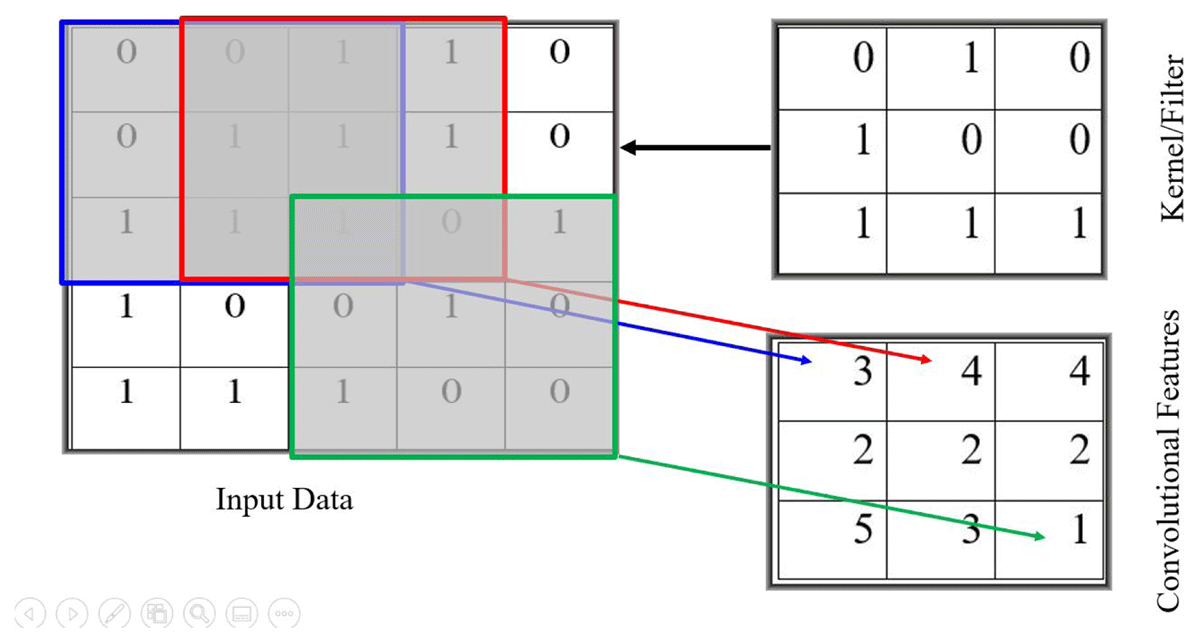
Figure 5
Convolutional values are obtained by sliding the kernel over data.
Table 2
Strategies for Reducing Learning Rate.
| STRATEGY | FORMULATION | DESCRIPTION |
|---|---|---|
| Power Scheduling | The learning rate η0, the steps k and the power ν are typically set to 1 at the beginning. The learning rate will keep dropping at each step, much faster in the early stages than later on. Fine tuning η(t) is one of the functions of the algorithm. | |
| Exponential Scheduling | A much faster option for reducing η0, which drops by a factor of 10 every k steps. The researcher can fine tune the constant 0.1 to suit their needs | |
| Piecewise Constant Scheduling | η(t) = 0 for 10 epochs | A constant η0 for a number of epochs (e.g. η0 = 0.2 for k = 10 then η0 = 0.1 for k = 30 etc). |
| Performance scheduling | Ɛv | Validation Error: Measuring it helps decide on reducing η0 by a specified factor when δv stops dropping. |
Algorithm 2
Adaptation of the SMA Algorithm (Mwitondi et al. 2020) for CNN Classification.
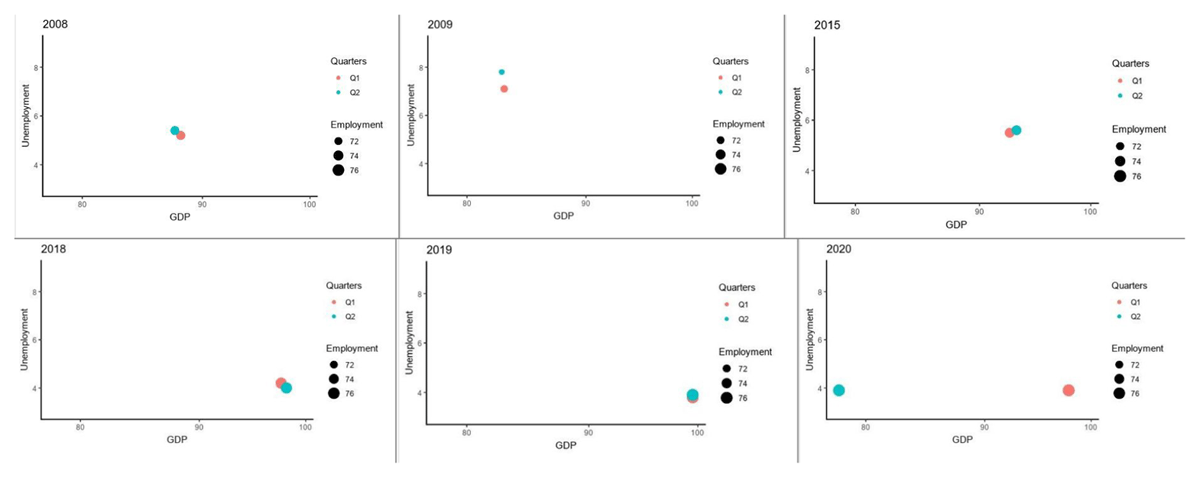
Figure 6
GDP and unemployment patterns for selected 1st and 2nd quarters over the period 2008–2020.
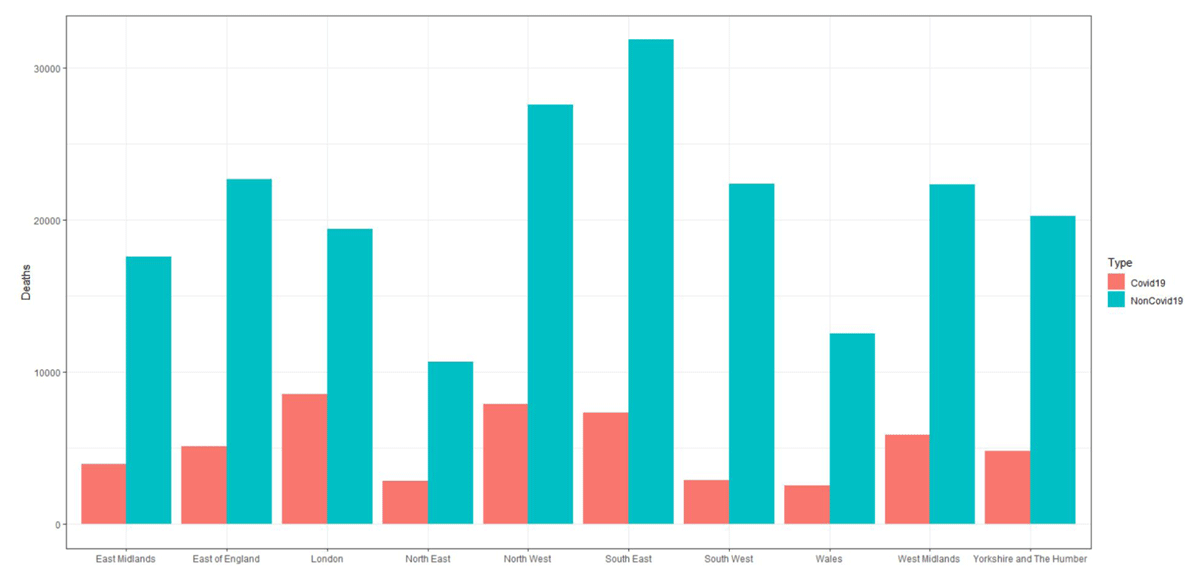
Figure 7
Recorded deaths in parts of the UK between March and July 2020.
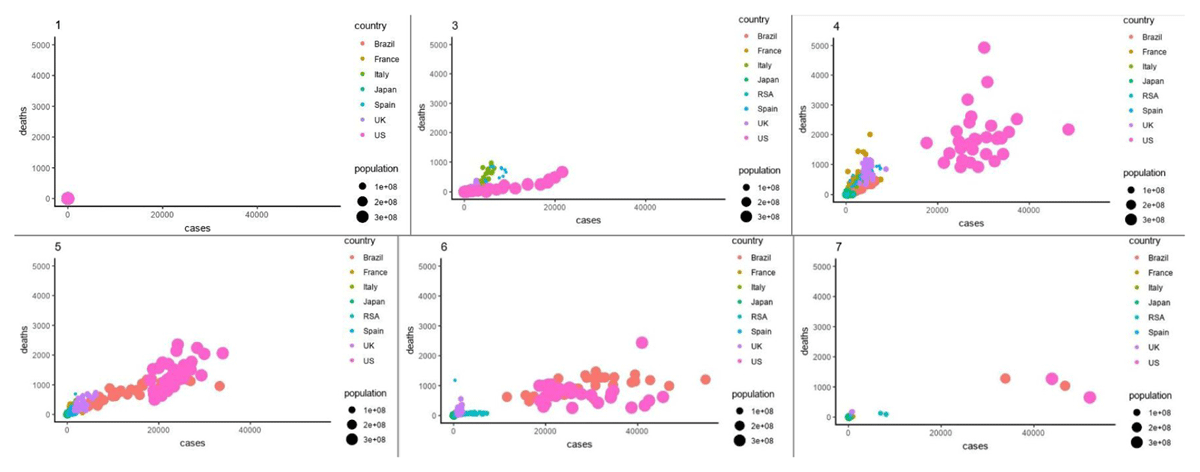
Figure 8
Images captured from animated plots for the first 7 months of 2020.
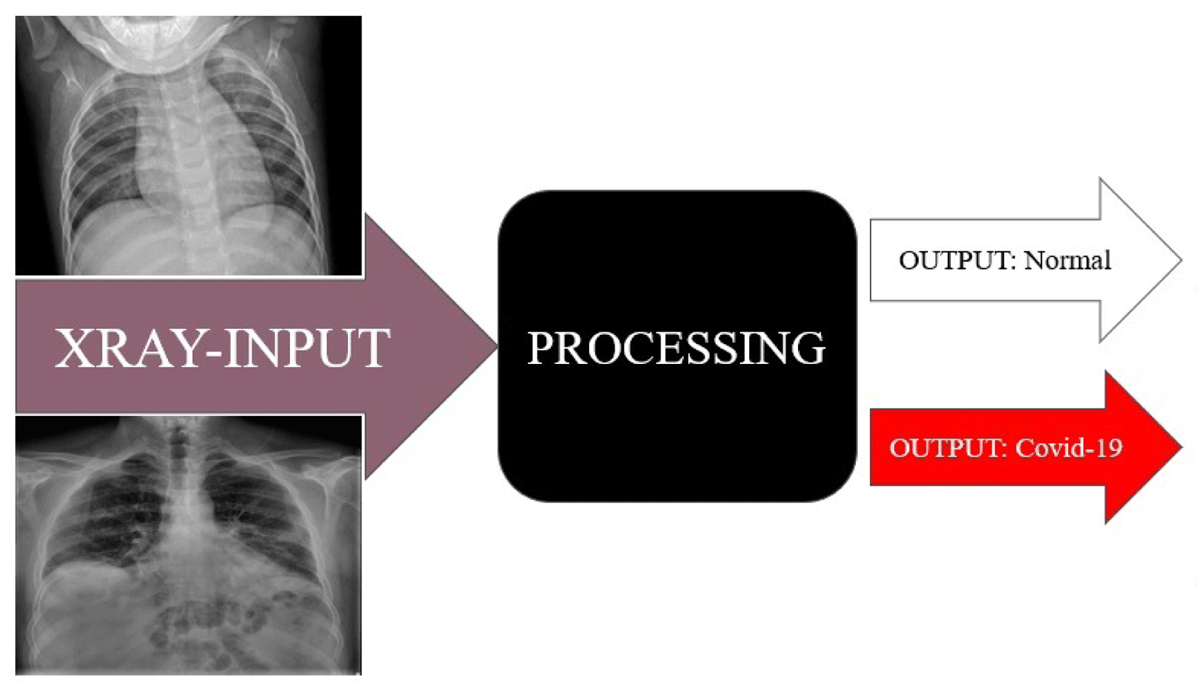
Figure 9
A CNN model is trained on imagery data to perform classification based on known classes.
Table 3
Selected training and validation model accuracy based on 50 CNN epochs.
| SAMPLE # | TRAIN % | VALID % | TRAIN-START | TRAIN-CONVERGE | VALID-START | VALID-CONVERGE |
|---|---|---|---|---|---|---|
| 1 | 80% | 20% | 87.98% | 99.57% | 20.99% | 98.95% |
| 2 | 70% | 30% | 88.79% | 99.71% | 95.99% | 100.00% |
| 3 | 60% | 40% | 90.68% | 100.00% | 83.99% | 99.00% |
| 4 | 50% | 50% | 87.00% | 99.71% | 94.99% | 100.00% |
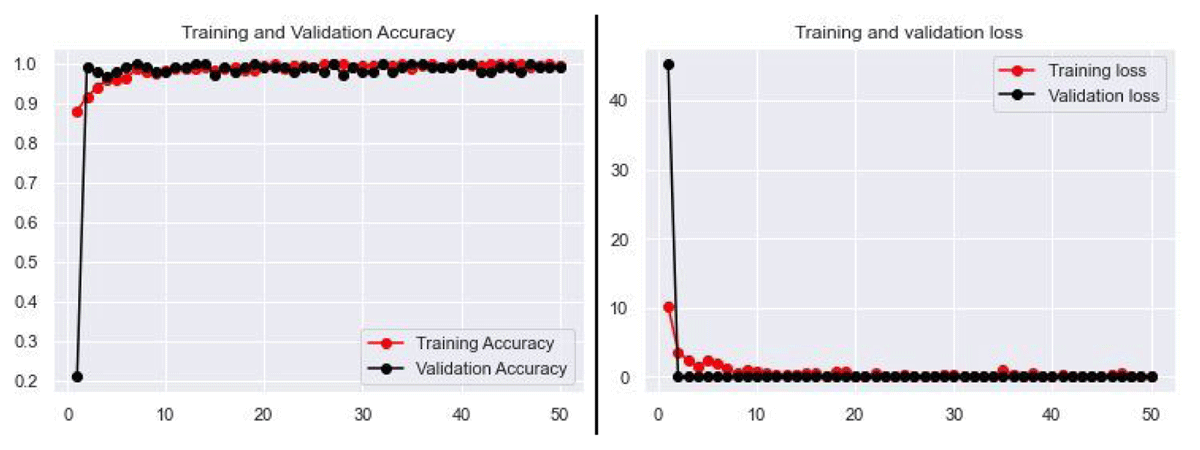
Figure 10
Training and validation accuracy and loss patterns based on the 80%–20% split.
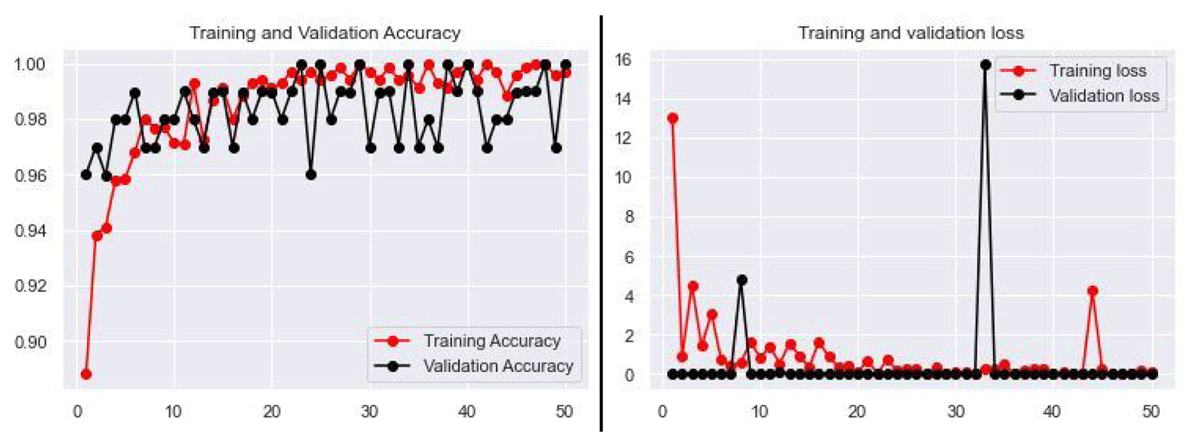
Figure 11
Training and validation accuracy and loss patterns based on the 70%–30% split.
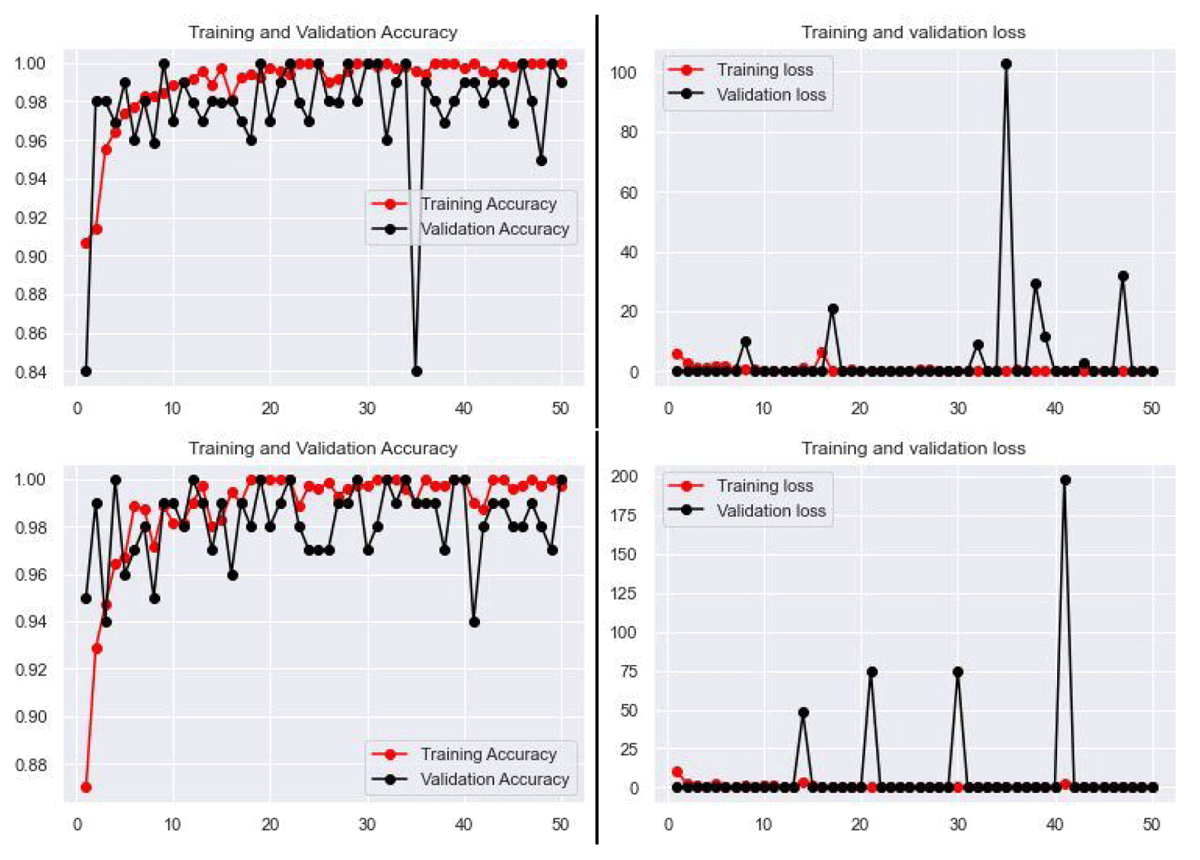
Figure 12
Accuracy and loss patterns based on the 60%–40% (top) and 50%–50% (bottom) splits.
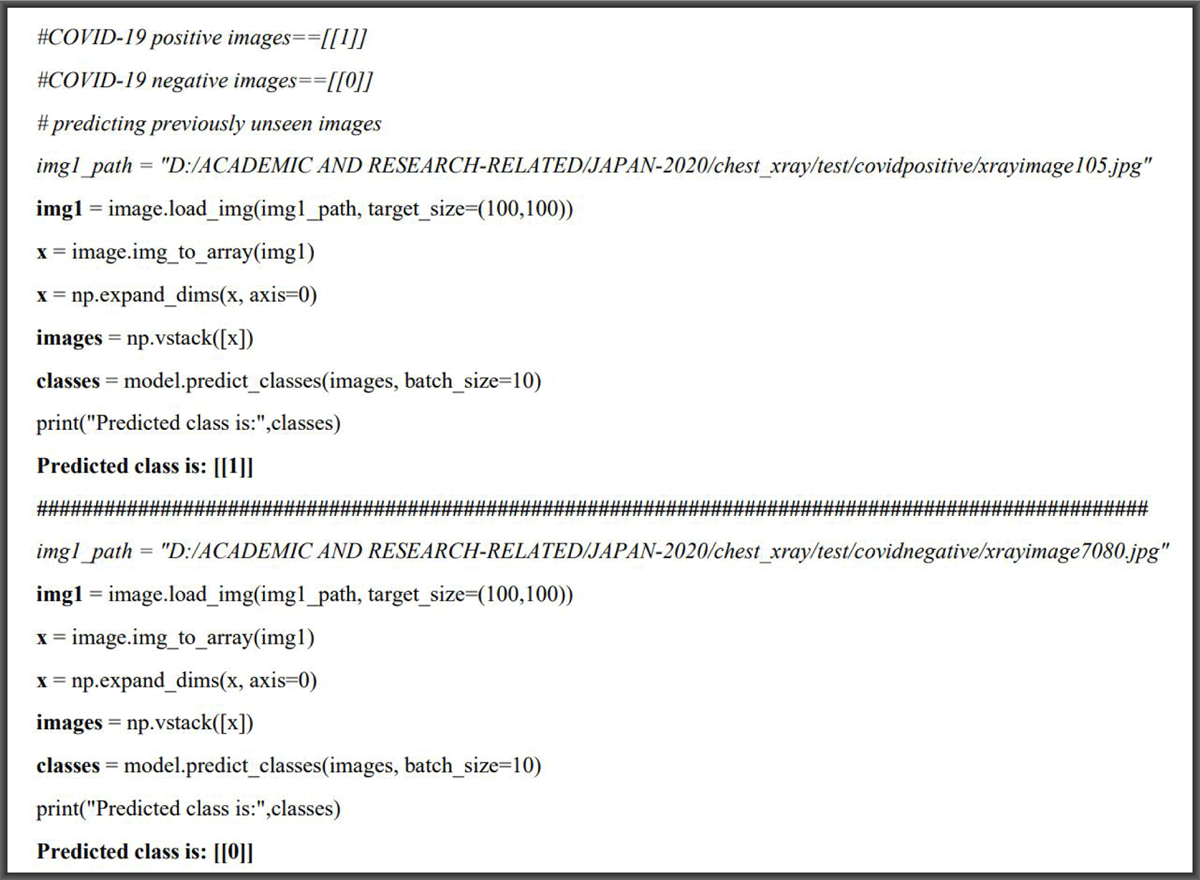
Figure 13
Accurate predictions of unlabelled new data for both positive and negative COVID–19 cases.
Table 4
Selected scenarios of interest for intervention through Algorithm 1.
| SDG APPLICATION | RELATED ASPECTS OF DEVELOPMENT | INTERDISCIPLINARITY |
|---|---|---|
| SDG #1 (Poverty) |
| Various attributes describe poverty eradication & empowerment: The impact of poverty on women requires gender specialist intervention (SDG #5). Co-ordinated efforts between donors & recipients (SDG #17). Good health (SDG #3) and education (SDG #4) lead to productivity (SDG #9), improved income and reduced inequality (SDG #10) |
| SDG #9 (Innovation) |
| To deliver sustainable and resilient infrastructure countries need enhanced financial, technological and technical co-operation (SDG #17). Enhanced productivity in manufacturing, agriculture & services sectors requires quality education (SDG #4). |
| SDG #13 (Climate Action) |
| Climate action spans across SDG from multi-disciplinary angles. Its key aspects include national strategies, disaster risk reduction, sustainable transport, sustainable cities & human settlement (SDG #11). |
Table 5
Selected examples of interdisciplinary involvement for machine learning.
| MODELLING TECHNIQUE | PERFORMANCE INFLUENTIAL FACTORS | INTERDISCIPLINARY INVOLVEMENT |
|---|---|---|
| K-Means |
| Data choice is problem-driven but it is vital to have thorough considerations as to “what is interesting” before, during and after clustering. |
| CNN |
| Data choice is problem-driven and while the decision on the architecture may initially be by a data scientist, underlying domain knowledge is crucial in interpreting the results. Parameter tuning image data augmentation, handling of over-fitting/under-fitting require interdisciplinarity. |
Table 6
Basic considerations for data–driven approaches to addressing global challenges.
| COMMONALITIES | FOCAL POINTS | DESCRIPTION |
|---|---|---|
| Data |
| Making relevant data available to those who need it, when they need it |
| Computing Resources |
| Providing robust, secure and versatile computing resources for users by both the public and private sectors |
| Skills |
| Adopting interdisciplinary approaches for the purpose of attaining unified solutions to global challenges |
| Strategies |
| Devising institutional frameworks for sharing resources and knowledge through educational, vocational and research institutions |
| Legislations |
| Working towards operating open systems that talk to each other |