
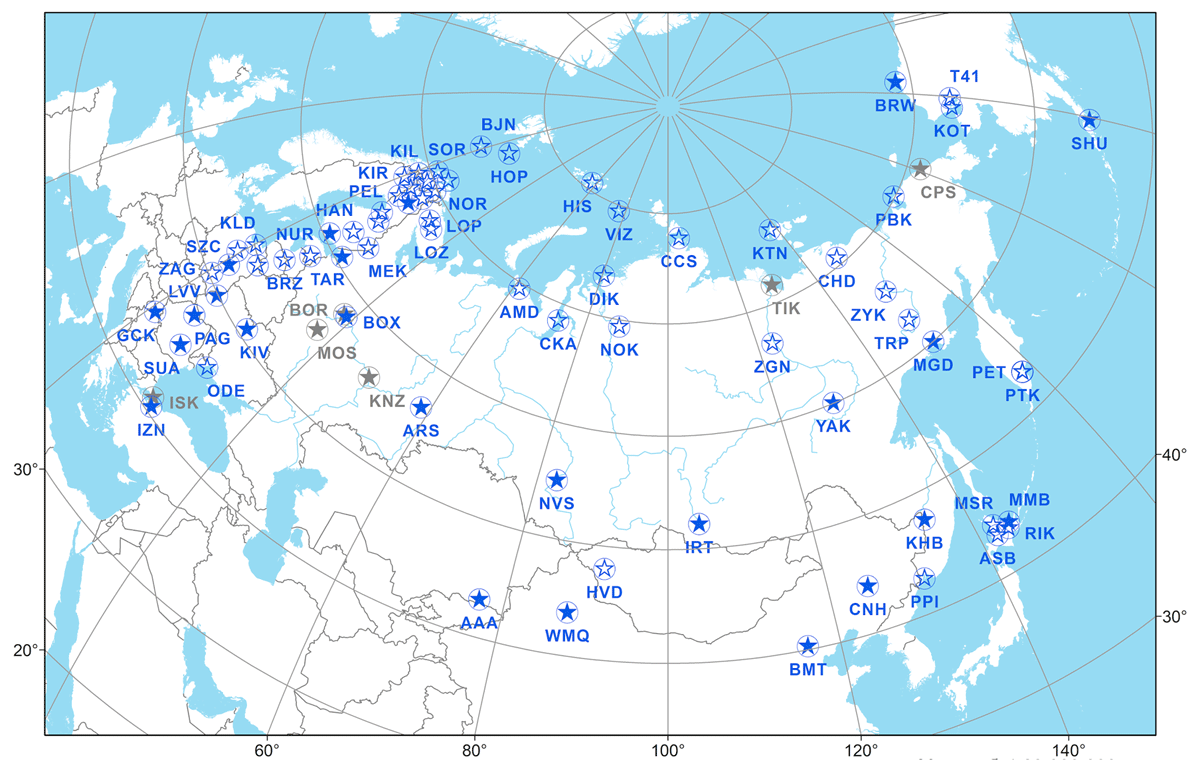
Figure 1
Map of selected SuperMAG stations shown with hollow stars. INTERMAGNET stations are shown with filled stars.
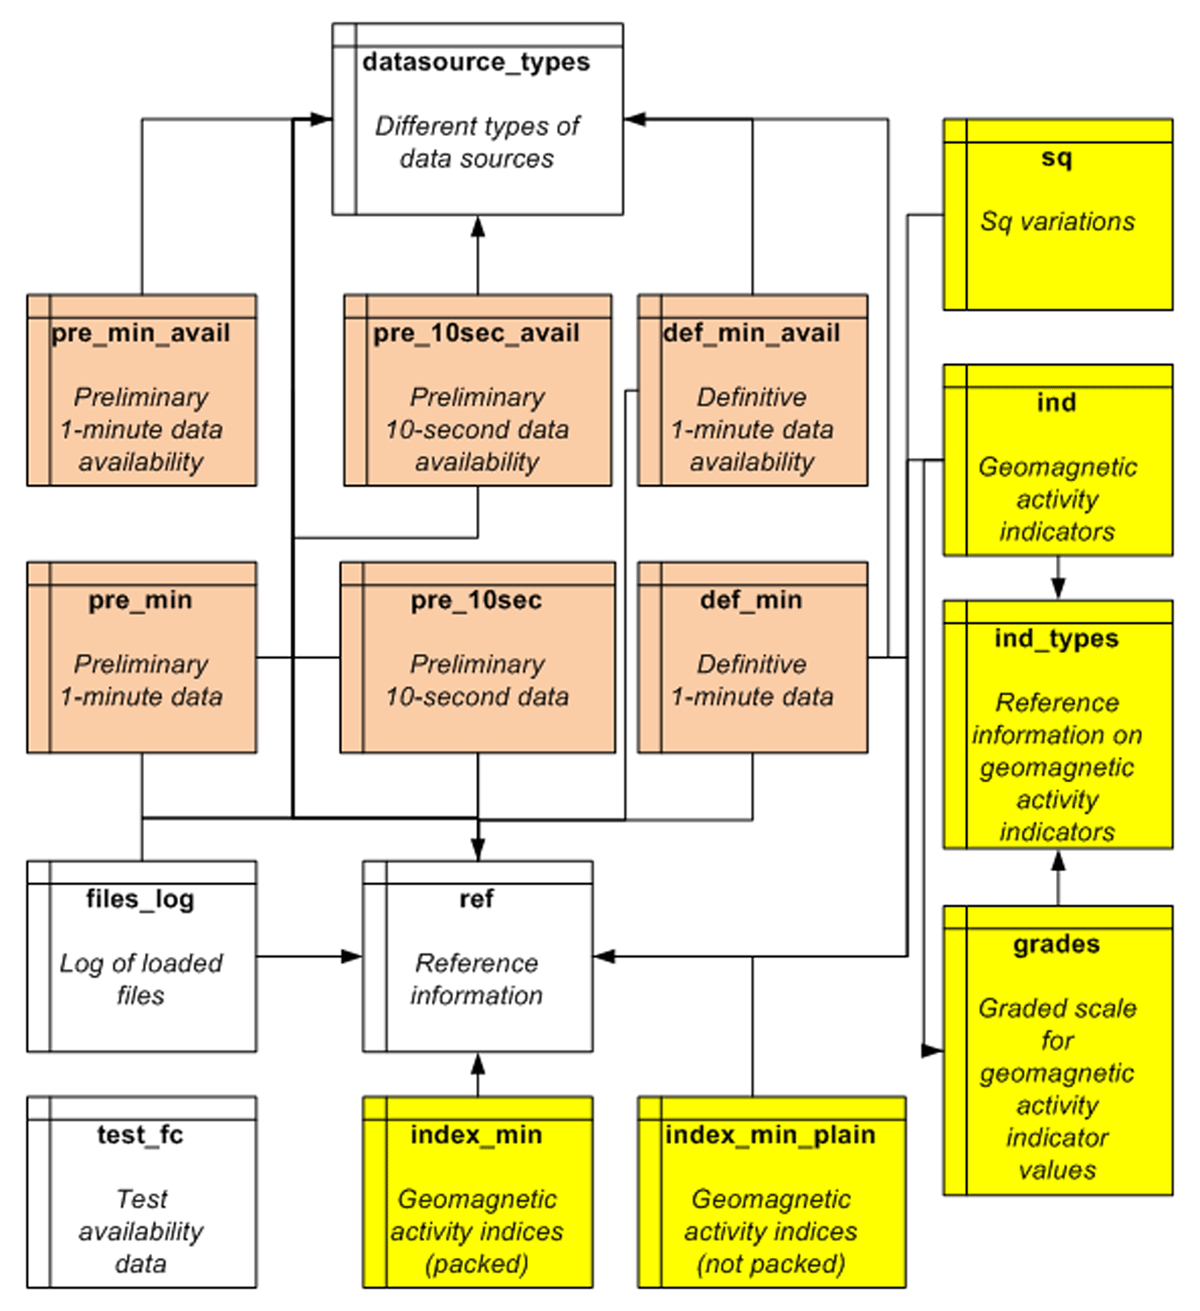
Figure 2
Database structure. Orange—tables of initial data, yellow—indices of geomagnetic activity calculated on their basis, white—auxiliary tables.
Table 1
Evaluation of the data source quality.
| Data source name | Computer processing | Expert processing | Data requirements | Data verification | Score |
|---|---|---|---|---|---|
| IMAGE | Yes | Yes | Yes | Internal | 4 |
| INTERMAGNET | Yes | Yes | Yes | External | 5 |
| SuperMAG | Yes | No | No | No | 1 |
| GC RAS | Yes | No | No | No | 1 |
| IZMIRAN | No | No | No | No | 0 |
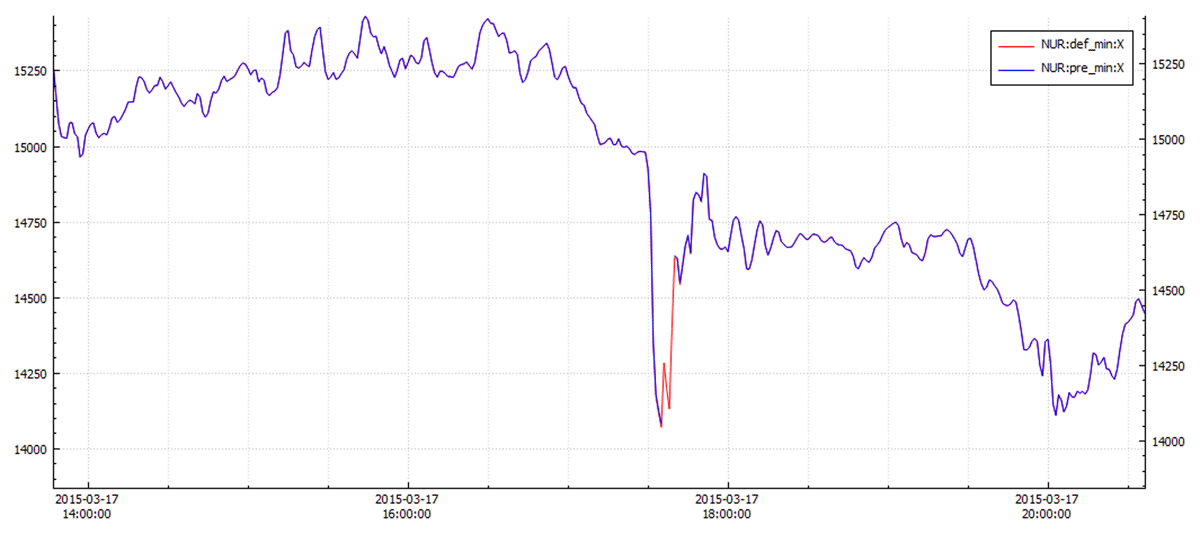
Figure 3
Comparison of data from the horizontal X component of the Nurmijärvi Observatory (NUR) from SuperMAG (blue) and INTERMAGNET (red).