
Table 1
Number of cellular towers and subscribers of each cellular network operator.
| Operator | Number of cellular towers | Number of subscribers |
|---|---|---|
| 1 | 1,722 | 1,056,958 |
| 2 | 1,913 | 489,835 |
| 3 | 675 | 68,213 |
| 4 | 85 | 1,641 |
| 5 | 235 | 1,618 |
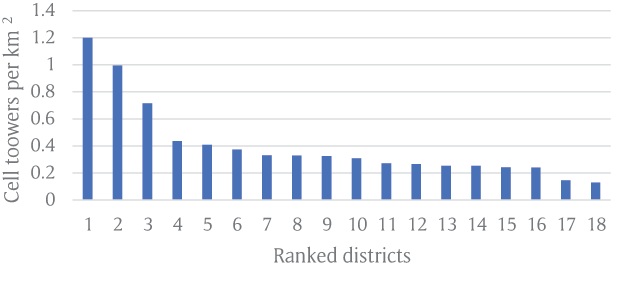
Figure 1
Cellular towers density per district of all operators.
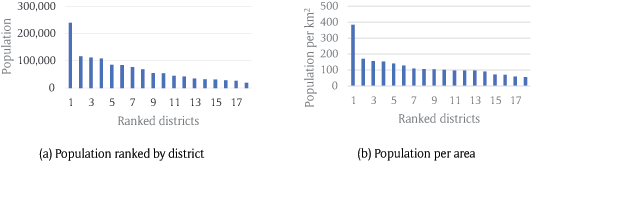
Figure 2
Census-based population density distribution; total count in each district (a) and population per km2.
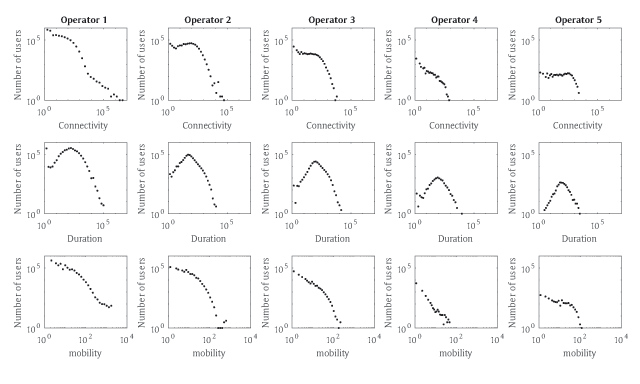
Figure 3
Distributions of user characteristics in each of the five networks.
Table 2
Statistical mean and median values of usage characteristics of the users of each network operator.
| Operator | Connectivity | Call duration | Mobility | |||
|---|---|---|---|---|---|---|
| Mean | Median | Mean | Median | Mean | Median | |
| 1 | 38.32 | 4.00 | 246.32 | 105.50 | 6.38 | 2.00 |
| 2 | 80.58 | 29.00 | 83.49 | 43.56 | 6.88 | 4.00 |
| 3 | 44.97 | 9.00 | 155.36 | 84.30 | 4.80 | 2.00 |
| 4 | 12.32 | 2.00 | 120.46 | 69.75 | 1.90 | 1.00 |
| 5 | 154.86 | 45.00 | 113.05 | 73.33 | 10.03 | 5.00 |
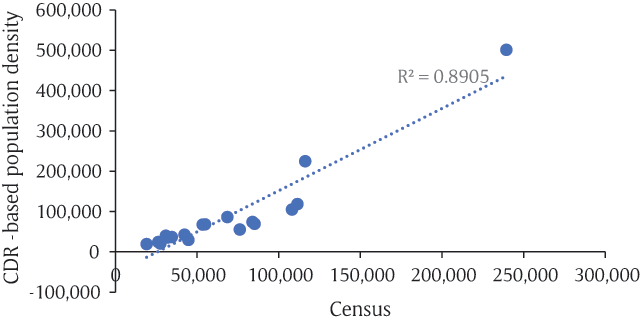
Figure 4
Correlation between the population density by census and the population density derived from the CDR data.
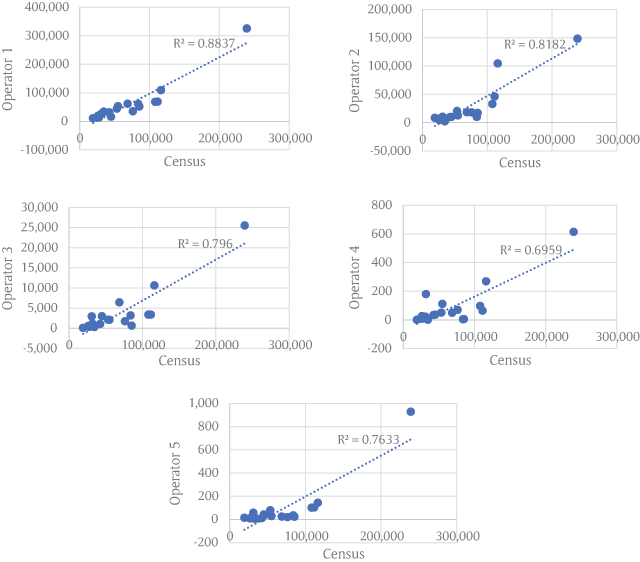
Figure 5
Correlation between the population density by census and the population density derived from the CDR data from five different operators with different market share.
Table 3
Correlation values (R-squared) against the census population and the market share of each operator.
| Operator | Market share (%) | R-squared |
|---|---|---|
| 1 | 65.31 | 0.88 |
| 2 | 30.27 | 0.82 |
| 3 | 4.22 | 0.80 |
| 4 | 0.10 | 0.70 |
| 5 | 0.10 | 0.76 |
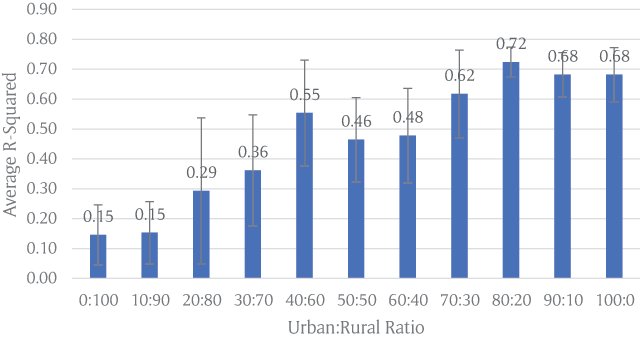
Figure 6
Correlation values between census and CDR-based population densities for different ratios of urban and rural user population.
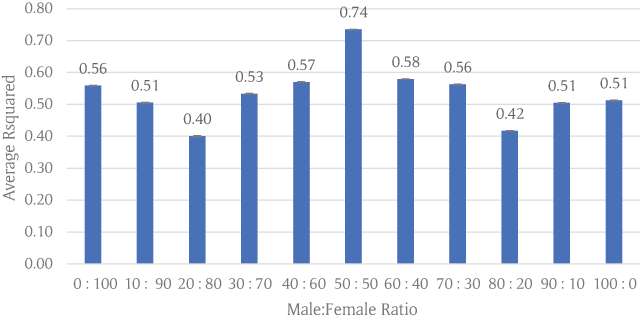
Figure 7
Correlation values between census and CDR-based population densities for different ratios of male and female users.