
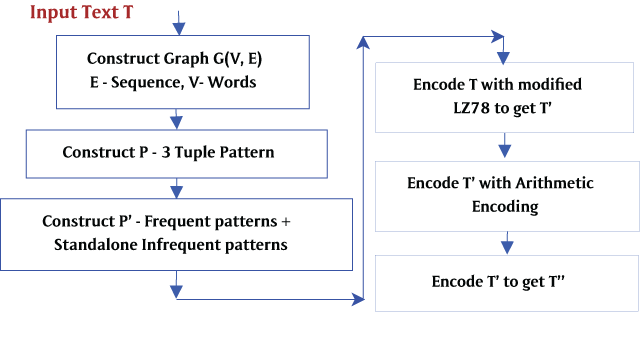
Figure 1
Flow Chart of GA78.
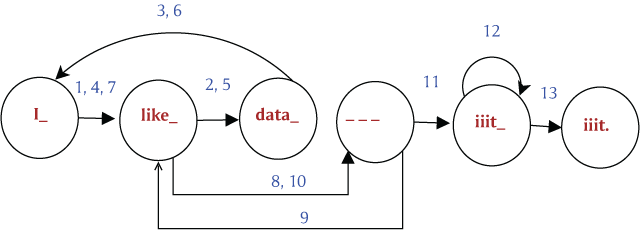
Figure 2
Graph of text T for GA78.
Table 1
Simulation results of various Text Corpora.
| Corpus/Size (kB) | Compression Ratio Cr | Time(sec) | |||||||||||
|---|---|---|---|---|---|---|---|---|---|---|---|---|---|
| FPH-AS/CH | FPH-HB/ | UHE | GA78 | LZ78 | AE | gzip | FPH-AS/CH | FPH-HB/ | GA78 | LZ78 | AE | gzip | |
| alphabet/98 | 242.13 1.67 | 416.66 | – | 92.25 | – | 1.67 | 302.15 | 29485 0.1 | 18.01 | 0.06 | – | 0.06 | 12.87 |
| bible/3953 | 2.83 1.82 | 2.86 | 2.65 | 2.65 | 2.06 | 1.84 | 1.91 | 24272 34.37 | 1123 | 29.05 | 6.23 | 0.78 | 24.21 |
| Reviews/102,399 | 4.97 1.61 | 2.52 | 2.54 | 2.79 | 2.51 | 1.61 | 1.8 | 1442.6 1600 | 3710 | 248.43 | 29.29 | 11.92 | 5.65 |
| plrabn12/470 | 2.25 2.19 | 2.24 | 2.38 | 1.93 | 1.42 | 1.75 | 2.2 | 84.72 5.63 | 47.47 | 3.62 | 1.74 | 0.08 | 3.5 |
| world192/2415 | 2.37 1.58 | 2.48 | 2.15 | 2.59 | 1.97 | 1.59 | 1.75 | 16509.5 50.53 | 613.89 | 0.36 | 4.81 | 0.72 | 16.32 |
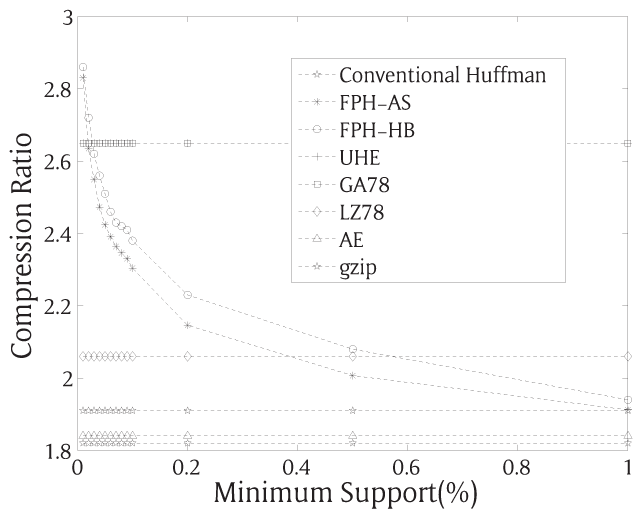
Figure 3
min_supp vs Compression ratio for bible.
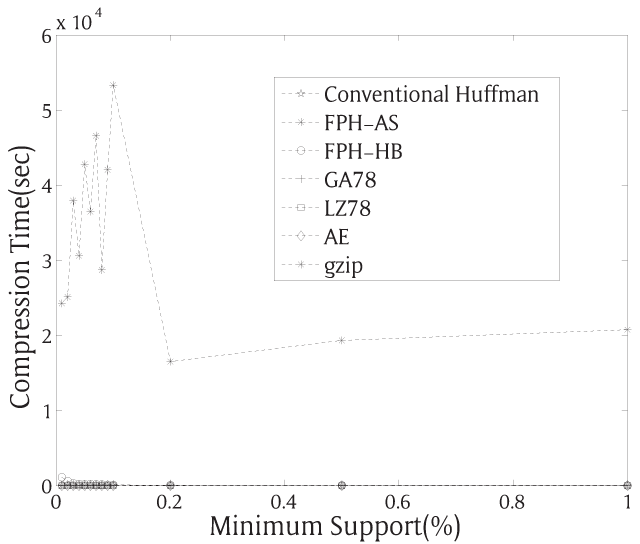
Figure 4
min_supp vs time for bible.
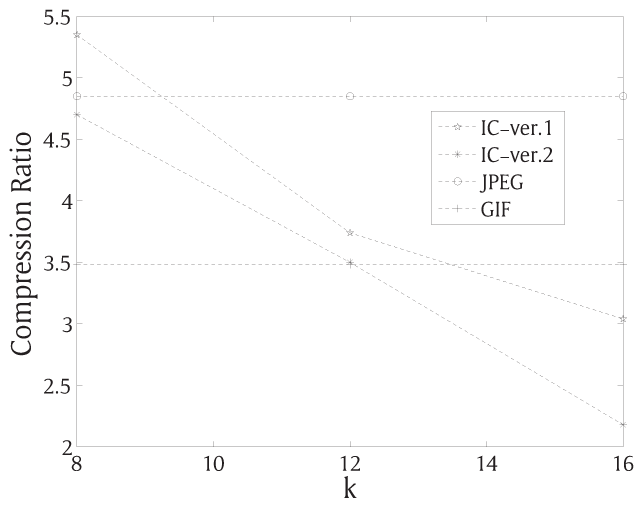
Figure 5
k vs Compression ratio for Lena.
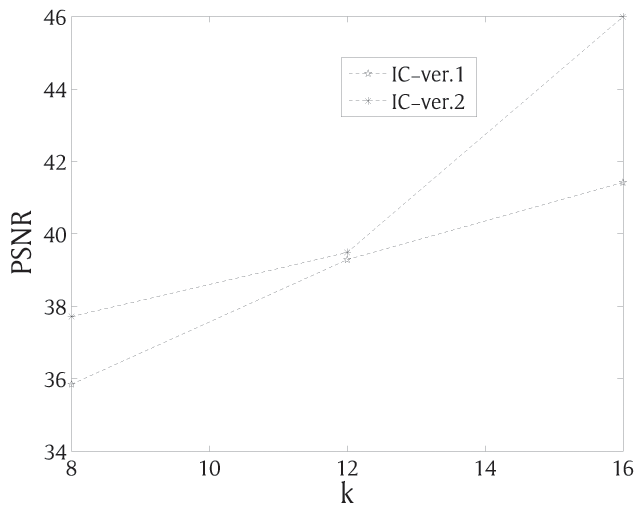
Figure 6
k vs PSNR for Lena.
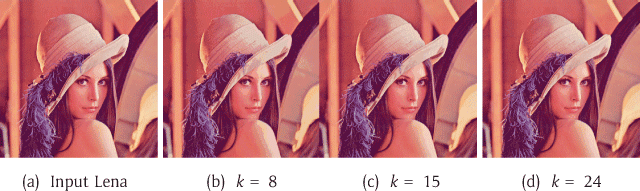
Figure 7
(a) Lena Input Image (b), (c) and (d) are decompressed images at k = 8, k = 15 and k = 24 respectively at α = 46%.