
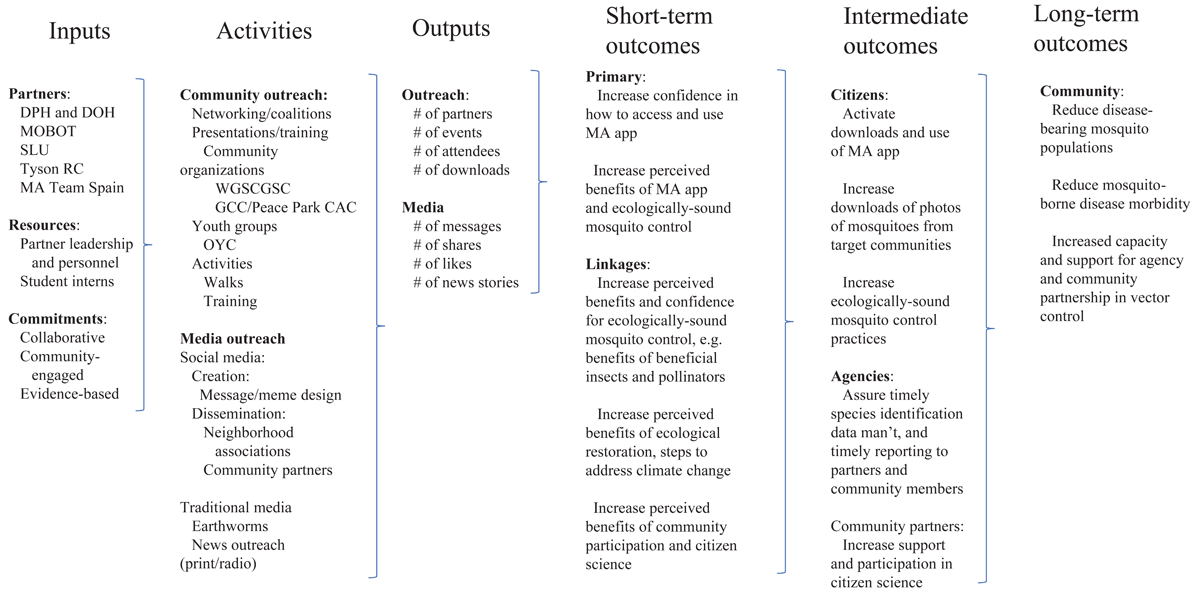
Figure 1
Mosquito Alert STL Communication Plan Logic Model.
Table 1
Sample characteristics overall, and for app users and non-users.
| CHARACTERISTIC | OVERALL | APP USERS | NON-USERS | P-VALUE |
|---|---|---|---|---|
| n | 37 | 10 | 27 | |
| Age | 0.129 | |||
| 18–28 | 4 (10.8) | 3 (30.0) | 1 (3.7) | |
| 29–39 | 6 (16.2) | 1 (10.0) | 5 (18.5) | |
| 40–49 | 6 (16.2) | 1 (10.0) | 5 (18.5) | |
| 50–60 | 2 (5.4) | 0 (0.0) | 2 (7.4) | |
| 61–71 | 6 (16.2) | 3 (30.0) | 3 (11.1) | |
| 72+ | 6 (16.2) | 0 (0.0) | 6 (22.2) | |
| NA | 7 (18.9) | 2 (20.0) | 5 (18.5) | |
| Gender | 0.378 | |||
| Female | 16 (43.2) | 3 (30.0) | 13 (48.1) | |
| Male | 12 (32.4) | 3 (30.0) | 9 (33.3) | |
| Prefer not to answer | 3 (8.1) | 2 (20.0) | 1 (3.7) | |
| NA | 6 (16.2) | 2 (20.0) | 4 (14.8) | |
| Race | 0.707 | |||
| Asian or Pacific Islander | 2 (5.4) | 0 (0.0) | 2 (7.4) | |
| Black or African American | 1 (2.7) | 0 (0.0) | 1 (3.7) | |
| Prefer not to answer | 2 (5.4) | 0 (0.0) | 2 (7.4) | |
| White or Caucasian | 26 (70.3) | 8 (80.0) | 18 (66.7) | |
| NA | 6 (16.2) | 2 (20.0) | 4 (14.8) | |
| Education | 0.383 | |||
| High school graduate or GED | 1 (2.7) | 1 (10.0) | 0 (0.0) | |
| Bachelor’s degree | 12 (32.4) | 3 (30.0) | 9 (33.3) | |
| Graduate degree | 18 (48.6) | 4 (40.0) | 14 (51.9) | |
| NA | 6 (16.2) | 2 (20.0) | 4 (14.8) | |
| Income | 0.655 | |||
| $25,000 to $49,999 | 3 (8.1) | 1 (10.0) | 2 (7.4) | |
| $50,000 to $74,999 | 3 (8.1) | 2 (20.0) | 1 (3.7) | |
| $75,00 to $100,000 | 7 (18.9) | 1 (10.0) | 6 (22.2) | |
| More than $100,000 | 10 (27.0) | 2 (20.0) | 8 (29.6) | |
| Prefer not to answer | 7 (18.9) | 2 (20.0) | 5 (18.5) | |
| NA | 7 (18.9) | 2 (20.0) | 5 (18.5) | |
| Political View | 0.219 | |||
| Conservative | 2 (5.4) | 0 (0.0) | 2 (7.4) | |
| Moderate | 4 (10.8) | 1 (10.0) | 3 (11.1) | |
| Liberal | 15 (40.5) | 7 (70.0) | 8 (29.6) | |
| Very liberal | 8 (21.6) | 0 (0.0) | 8 (29.6) | |
| Not sure | 1 (2.7) | 0 (0.0) | 1 (3.7) | |
| NA | 7 (18.9) | 2 (20.0) | 5 (18.5) |
[i] Note. NA represents missing information.
Table 2
App users’ activities and perceptions.
| SCALE | ITEM | VALUE N (% YES)/MEAN* (SD)** |
|---|---|---|
| App activity | Submitted photos of mosquitoes | 1 (10%) |
| Reported mosquito bites | 2 (20%) | |
| Submitted photos of breeding sites | 6 (60%) | |
| Joined MASTL Facebook Group | 9 (90%) | |
| Joined MASTL Instagram | 9 (90%) | |
| Viewed MASTL website | 9 (90%) | |
| Confidence and ease of use | App is easy to find | 4.22 (0.97) |
| App is easy to download | 4.11 (1.05) | |
| App is easy to use | 4.11 (1.17) | |
| App is enjoyable to use | 4.11 (1.36) | |
| Easy to take photos and post | 4.11 (1.36) | |
| Perceived public health benefits | Supports local public health agencies | 4.11 (1.54) |
| Prevents mosquito-borne disease | 4.33 (1.41) | |
| Keeps community healthy | 4.33 (1.32) | |
| Empowers mosquito control | 4.33 (1.32) | |
| Raise community awareness | 4.33 (1.32) | |
| Perceived personal benefits | Happy to help public health agencies | 4.11 (1.54) |
| Happy to help prevent disease | 4.33 (1.41) | |
| Happy to contribute data | 4.33 (1.32) | |
| Happy to learn about mosquitoes | 4.33 (1.32) | |
| Happy to learn about mosquito-borne diseases | 4.33 (1.32) |
[i] *Mean for Likert scale where 1 is Strongly disagree and 5 is Strongly agree. **Standard deviation.
Table 3a
Correct knowledge about mosquito control.
| ITEM | OVERALL | APP USERS | NON-USERS | P-VALUE |
|---|---|---|---|---|
| N (% YES) | N (% YES) | N (% YES) | ||
| N = 32 | N = 9 | N = 23 | ||
| Larvicide kills mosquitoes before adulthood | 24 (72.7) | 7 (77.8) | 17 (70.8) | 1.000 |
| Fogging kills pollinators like bees | 24 (72.7) | 6 (66.7) | 18 (75.0) | 0.677 |
| Fogging does not stop breeding | 21 (63.6) | 8 (88.9) | 13 (54.2) | 0.107 |
| Ecological methods are effective | 28 (84.8) | 9 (100.0) | 19 (79.2) | 0.290 |
| Standing water collects in many places | 27 (84.4) | 9 (100.0) | 18 (78.3) | 0.288 |
| Dumping water or larvicides control mosquitoes | 29 (87.0) | 9 (100.0) | 20 (83.3) | 0.555 |
| Larvicides do not harm people/pets | 16 (48.5) | 4 (44.4) | 12 (50.0) | 1.000 |
Table 3b
Climate concern and ecosystem beliefs.
| ITEM | OVERALL | USERS | NON-USERS | P-VALUE |
|---|---|---|---|---|
| MEAN* (SD)** | MEAN (SD) | MEAN (SD) | ||
| Pollinator health signals ecosystem health | 4.58 (1.12) | 5 (0) | 4.43 (1.27) | 0.045 |
| Biodiversity supports healthy ecosystems | 4.68 (1.01) | 5 (0) | 4.57 (1.16) | 0.086 |
| Ecosystems and biodiversity support human health | 4.71 (0.90) | 5 (0) | 4.61 (1.03) | 0.083 |
| Ecosystems support communities and society | 4.65 (1.05) | 5 (0) | 4.52 (1.20) | 0.069 |
| Climate change will affect my health | 4.35 (1.05) | 4.62 (0.52) | 4.26 (1.18) | 0.244 |
| Climate change will affect my family/community | 4.39 (0.99) | 4.75 (0.46) | 4.26 (1.10) | 0.093 |
| Climate change will impact my daily life | 4.4 (0.97) | 4.88 (0.35) | 4.23 (1.07) | 0.019 |
| Climate change may increase mosquito-borne disease | 4.39 (1.02) | 4.88 (0.35) | 4.22 (1.13) | 0.020 |
[i] *Mean for Likert scale where 1 is Strongly disagree and 5 is Strongly agree. **Standard deviation.
Table 3c
Ecological mosquito control behaviors.
| ITEM | OVERALL | APP USERS | NON-USERS | P-VALUE |
|---|---|---|---|---|
| N (%YES) | N (%YES) | N (%YES) | ||
| N = 32 | N = 9 | N = 23 | ||
| Used larvicide (dunks) in standing water | 17 (53.1%) | 6 (66.7%) | 11 (47.8%) | 0.444 |
| Dumped standing water in neighborhood | 28 (87.5%) | 8 (88.9%) | 20 (87.0%) | 1.000 |
| Requested fogging from local health department | 0 (0) | 0 (0) | 0 (0) | 1.000 |
| Requested fogging from private company | 0 (0) | 0 (0) | 0 (0) | 1.000 |
| Posted to Mosquito Alert app to support public health | 6 (19.4%) | 6 (66.7%) | 0 (0%) | 0.000 |
Table 3d
Personal mosquito control practices.
| ITEM | OVERALL | APP USERS | NON-USERS | P-VALUE |
|---|---|---|---|---|
| MEAN* (SD)** | MEAN (SD) | MEAN (SD) | ||
| Wear long sleeves/pants in mosquito-prone areas | 1.91 (0.68) | 1.67 (0.50) | 2 (0.72) | 0.149 |
| Wear light-colored clothes | 1.42 (0.66) | 1.44 (0.53) | 1.42 (0.72) | 0.905 |
| Use mosquito repellent with DEET | 1.39 (0.97) | 1.78 (0.97) | 1.25 (0.94) | 0.183 |
| Use repellent with EPA***-approved ingredients | 1.39 (0.90) | 2 (0.71) | 1 .17 (0.87) | 0.011 |
| Test repellents to find what works | 1 (0.90) | 1.44 (0.88) | 0.83 (0.87) | 0.096 |
| Use fans while outside | 1.12 (0.86) | 1.67 (1.00) | 0.92 (0.72) | 0.063 |
| Go fragrance-free during mosquito season | 1.52 (1.18) | 1.78 (1.09) | 1.42 (1.21) | 0.424 |
| Avoid areas with high mosquito activity | 1.67 (0.78) | 1.67 (0.87) | 1.67 (0.76) | 1.000 |
[i] *Mean for scale item response options where 0 is never, 1 is occasionally, 2 is often, and 3 is always. **Standard deviation. ***Environmental Protection Agency.
Table 3e
Community participation and citizen science.
| ITEM | OVERALL | APP USERS | NON-USERS | P-VALUE |
|---|---|---|---|---|
| MEAN* (SD)** | MEAN (SD) | MEAN (SD) | ||
| I can make a difference by contributing to science | 2.77 (1.15) | 2.38 (1.19) | 2.91 (1.12) | 0.286 |
| Community participation improves public health | 4.32 (1.11) | 4.62 (0.52) | 4.22 (1.24) | 0.209 |
| Citizen science helps solve local problems | 3.93 (1.26) | 4.38 (0.52) | 3.77 (1.41) | 0.098 |
| Citizen science is worth investing in | 3.61 (0.95) | 4.12 (1.13) | 3.43 (0.84) | 0.144 |
| I want to participate in community science | 3.45 (0.89) | 4.38 (1.19) | 3.13 (0.46) | 0.021 |
[i] *Mean for Likert scale where 1 is Strongly disagree and 5 is Strongly agree. **Standard deviation.
Table 4a
Mosquito knowledge and practices: pre- and post-webinar results.
| ITEM | OVERALL | PRE | POST | P-VALUE |
|---|---|---|---|---|
| N (% Yes) | N (% Yes) | N (% Yes) | ||
| N = 98 | N = 54 | N = 44 | ||
| Mosquitoes lay eggs in stagnant water | 96 (99.0%) | 52 (98.0%) | 44 (100%) | >0.9 |
| Mosquitoes bite for protein to develop eggs | 90 (95.0%) | 48 (94.0%) | 42 (95.0%) | >0.9 |
| Plan to use dunks | 64 (70.0%) | 27 (54.0%) | 37 (90.0%) | <0.001 |
| Plan to request health department fogging | 9 (9.9%) | 1 (2.0%) | 8 (20.0%) | 0.010 |
| Plan to request private pest control fogging | 1 (1.1%) | 1 (2.0%) | 0 (0%) | >0.9 |
Table 4b
Ecological mosquito control perceptions: pre- and post-webinar results.
| ITEM | OVERALL | PRE | POST | P-VALUE |
|---|---|---|---|---|
| MEAN* (SD)** | MEAN (SD) | MEAN (SD) | ||
| N = 98 | N = 54 | N = 44 | ||
| Fogging threatens pollinators | 4.71 (0.83) | 4.70 (0.79) | 4.73 (0.90) | 0.5 |
| Ecological approaches can control insects | 4.49 (1.06) | 4.34 (1.15) | 4.68 (0.91) | 0.045 |
| Larvicide kills mosquitoes before adulthood | 4.19 (1.26) | 3.80 (1.34) | 4.66 (0.96) | <0.001 |
| Dumping standing water/larvicides effective | 4.59 (0.89) | 4.48 (0.89) | 4.73 (0.90) | 0.021 |
| Plan to participate in citizen science | 4.36 (0.86) | 4.45 (0.69) | 4.25 (1.03) | 0.6 |
| Public participation improves research | 4.84 (0.53) | 4.85 (0.36) | 4.83 (0.68) | 0.5 |
| Community benefits from citizen science | 4.75 (0.61) | 4.77 (0.48) | 4.73 (0.75) | 0.7 |
| Citizen science opportunities contribute to monarch/mosquito control | 4.70 (0.73) | 4.66 (0.73) | 4.75 (0.74) | 0.3 |
| Biodiversity supports ecosystems | 4.94 (0.44) | 4.98 (0.15) | 4.90 (0.63) | > 0.9 |
[i] *Mean for Likert scale where 1 is Strongly disagree and 5 is Strongly agree. **Standard deviation.