
Table 1
A summary of the steps taken in developing a tripartite community science project by the San Diego Natural History Museum (“The Nat”) and Groundwork San Diego – Chollas Creek (“Groundwork”).
| STEP | ACTIVITY | TIMING | DESCRIPTION |
|---|---|---|---|
| Program design | Partner meetings | July 2024–September 2024 | Established partnership, defined goals, and project planning |
| Relationship building | Presentations and discussions | September 2024–December 2024 | The Nat supported community science projects at existing community program, Family Saturdays, led by Groundwork and used lessons learned to co-develop a plan for the Outdoor Air Quality Community Science Project. |
| Recruitment | Presentation | January 4, 2025 | Verbal notification, written flyers describing the research project to community participants, and explanation of project with a PowerPoint presentation |
| Outdoor air quality community science project | Pre-survey | January 4, 2025 | During registration at Family Saturday community event, assessed baseline knowledge, attitudes, and perceptions of outdoor air quality through survey |
| Knowledge gaining and creative activity | January 4, 2025 | Introduced project goals, scientific concepts, and data collection methods with PowerPoint presentation and instruction sheets, followed by a creative family activity | |
| Independent data collection | January 2025–March 2025 | Community participants collected air quality data on their own | |
| Group data collection | March 1, 2025 | Facilitated air quality data collection during nature walk in local greenspace during one Family Saturday | |
| Presentation of results and discussion | April 5, 2025 | Discussed project results and related scientific concepts with PowerPoint presentation and discussion, followed by a creative family activity | |
| Post-survey | May 3, 2025 | Assessed knowledge, attitudes, and perceptions of outdoor air quality through survey (same as pre-survey) | |
| Community outreach and empowerment | Outreach table | April 26, 2025 | Community participants developed and shared outreach materials to share with the broader community |
| Evaluation | Interviews | May 3, 2025 | Semi-structured interviews to explore community participant experience and take-aways |
| Facilitator/scientist reflections | August 2025–September 2025 | The Nat and Groundwork completed written reflection questionnaires |
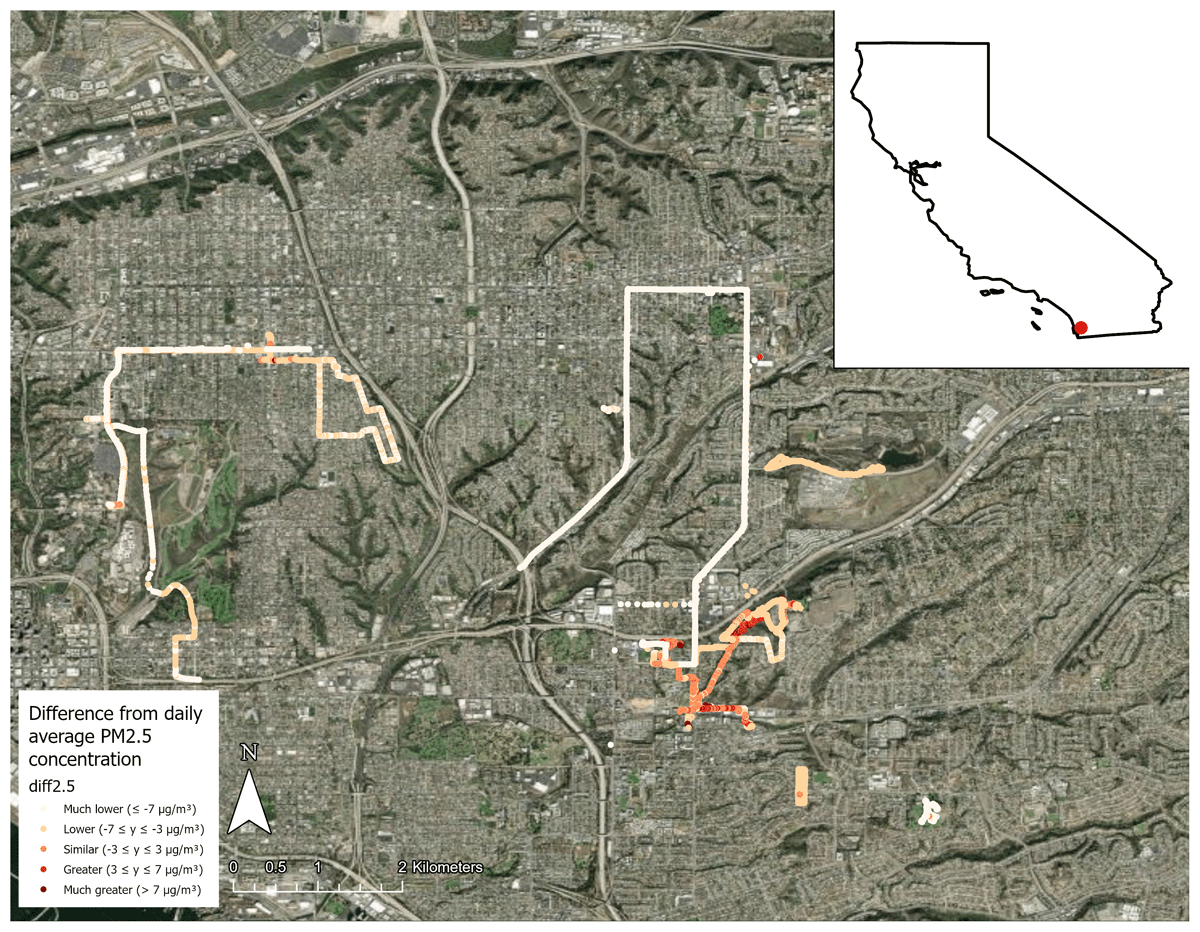
Figure 1
An example of a map of the outdoor air pollution data collected by community participants of the Family Saturdays community science program used during a peer-to-peer outreach and education event (referred to as “Earth Day community event” in text). This map displays all air quality data collected for the entire duration of the study. The color of the dots indicates differences in concentration from the average concentration of PM2.5 for the City of San Diego on the same day the data were collected. The inset shows the location of San Diego within the US state of California.
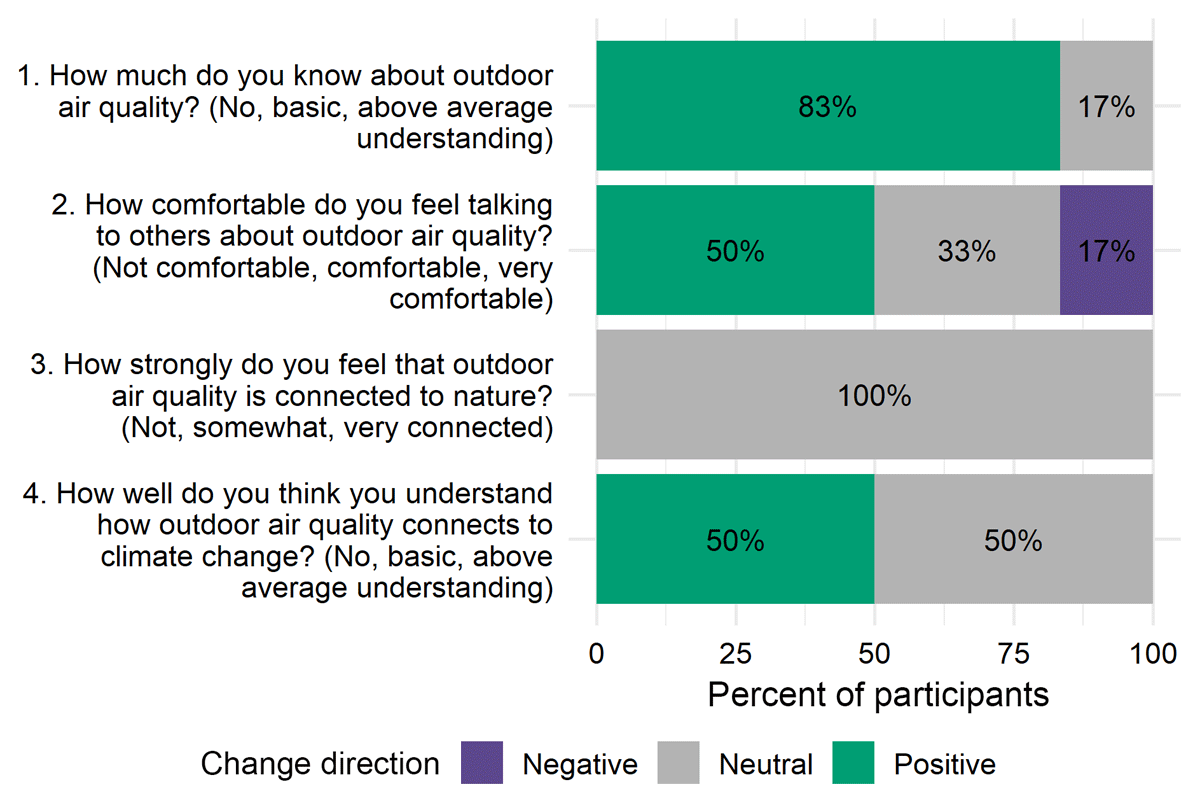
Figure 2
The proportion of community participants that changed their responses on an air quality survey (increased or “positive”; decreased or “negative”; no change or “neutral”) as a result of participating in a tripartite community science project (i.e., a project organized by scientists, a facilitator organization, and community members). The text of the specific question is to the left of the data for that question.
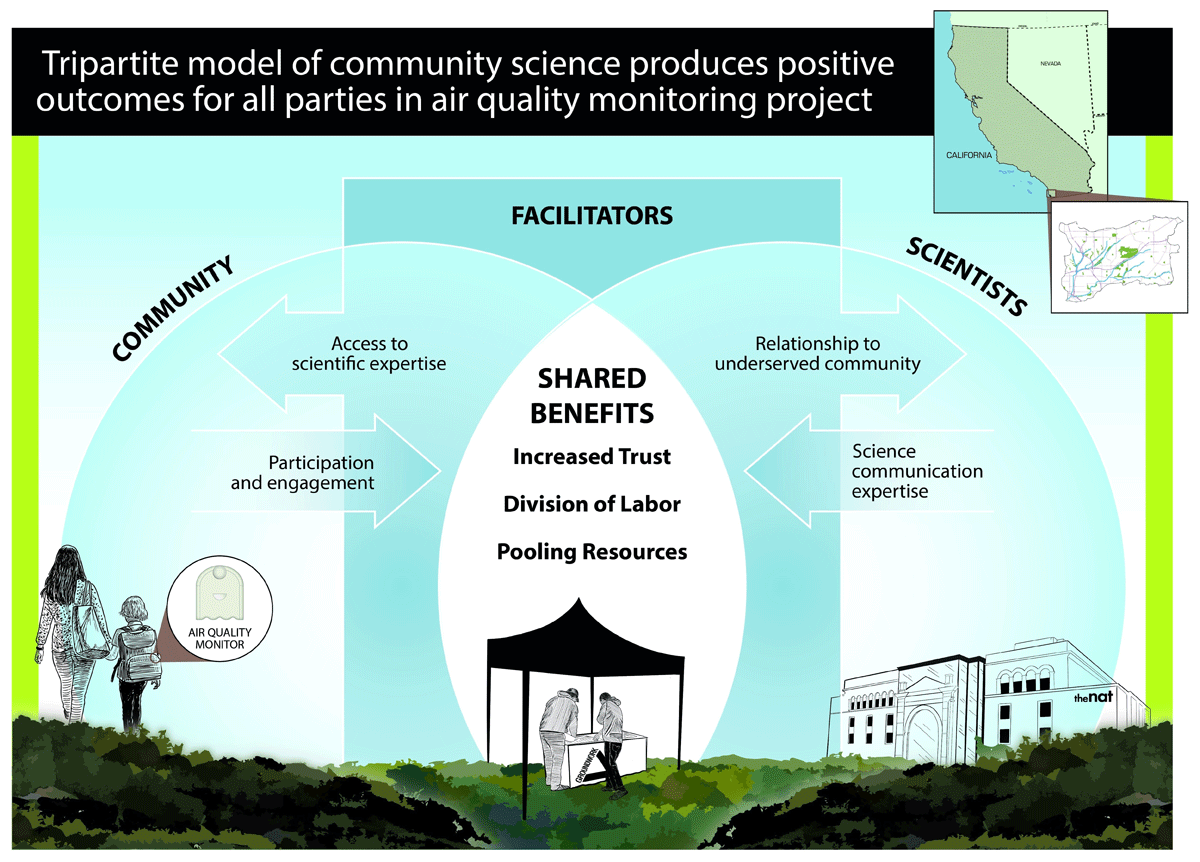
Figure 3
A visual abstract of the tripartite model of community science (Salmon et al. 2021) as applied to an outdoor air quality community science project. The facilitator (rectangle) mediates the relationship (arrows) between scientists and the community participants (circles) and all parties reap the shared benefits. Inset map shows the location of the Chollas Creek Watershed, the primary mission area of Groundwork and the neighborhoods of the study participants, in southern California.
Table 2
A summary of lessons learned and recommendations for improvement in implementing a tripartite model of community science that includes scientists, community members, and a facilitator organization that helps to bridge the gap between scientists and the community. Challenges, benefits, and recommendations are grouped under four overarching themes.
| THEMES | CHALLENGES | BENEFITS OF TRIPARTITE MODEL | RECOMMENDATIONS |
|---|---|---|---|
| Bandwidth | Staff at organizations are stretched thin | Allows facilitator and scientist to split tasks in a way that focuses on their strengths | Clearly designate roles and responsibilities of each organization |
| Recruitment | Sustained recruitment at scale, especially in communities that already lack bandwidth (e.g., economically disadvantaged) | Facilitators can leverage ongoing relationships with the community; community may be more likely to participate in “vetted” projects | Continued engagement with community Encouraging participation by family groups |
| Science communication | Translating scientific findings into practical actions | Scientists can support data analysis and communication of results | Time investment of co-creation to avoid potential mismatches in relevance of project outcomes to organizations and communities |
| Increased effort into developing actions, steps, and training for community participants to share findings | |||
| Funding | Funding tied to predefined activities or themes | Facilitator and scientist can leverage different strengths in funding networks; different sources of funding | Advocate for funders to understand importance of co-creation with facilitator organizations and the community from the start; build this into the funding structure (e.g., grant applications) |
| Lack of funding | Facilitator and scientist can combine funds to increase spending |