
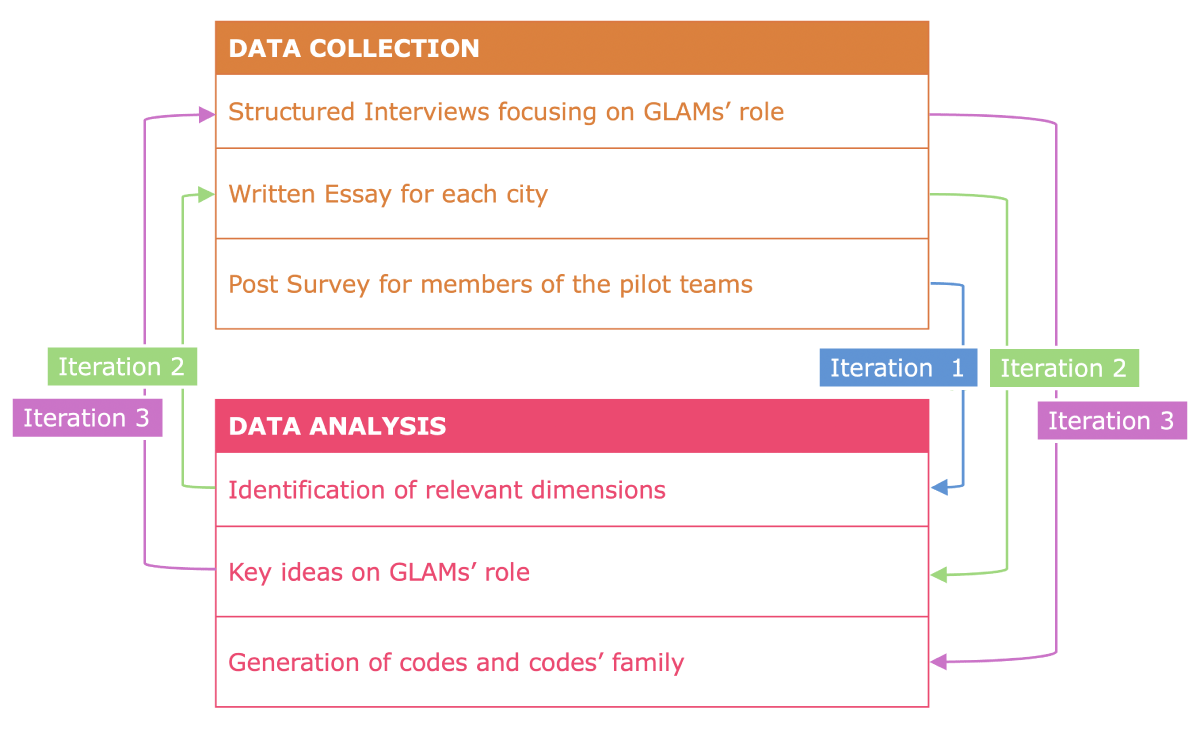
Figure 1
Data collection and analysis cycles, divided into three iterations (I1, I2, I3). Detailed protocols for each iteration are described in the Methods section.
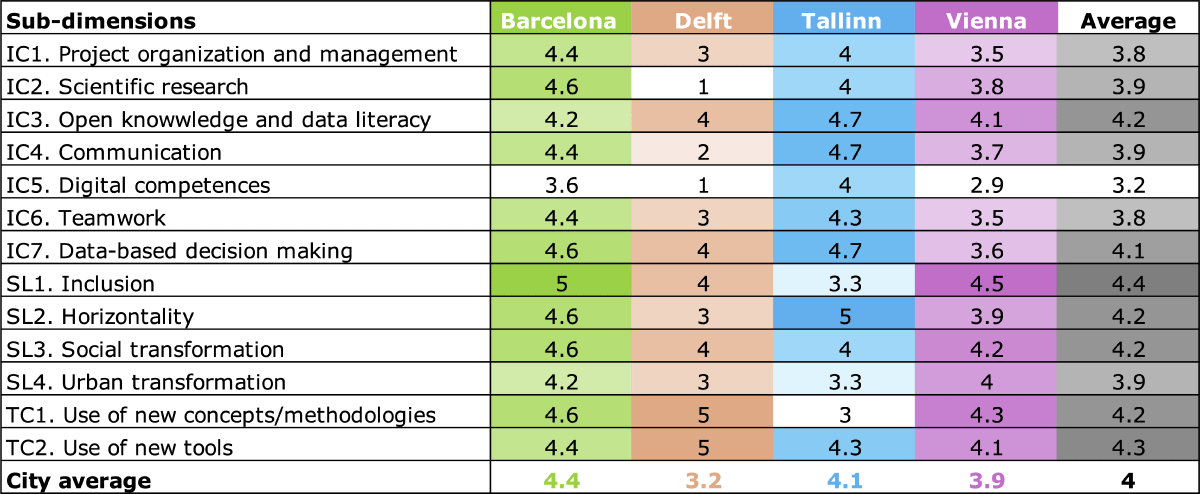
Figure 2
Results of the post-survey scores for pilot teams’ members, classified by sub-dimension and cities. Average scores were calculated by sub-dimension and city [five-point Likert scale, ranging from 1 (absolutely disagree) to 5 (absolutely agree)]. IC: Individual Competency Development, SL: Social Learning, TC: Inter- and Transdisciplinary Collaboration.
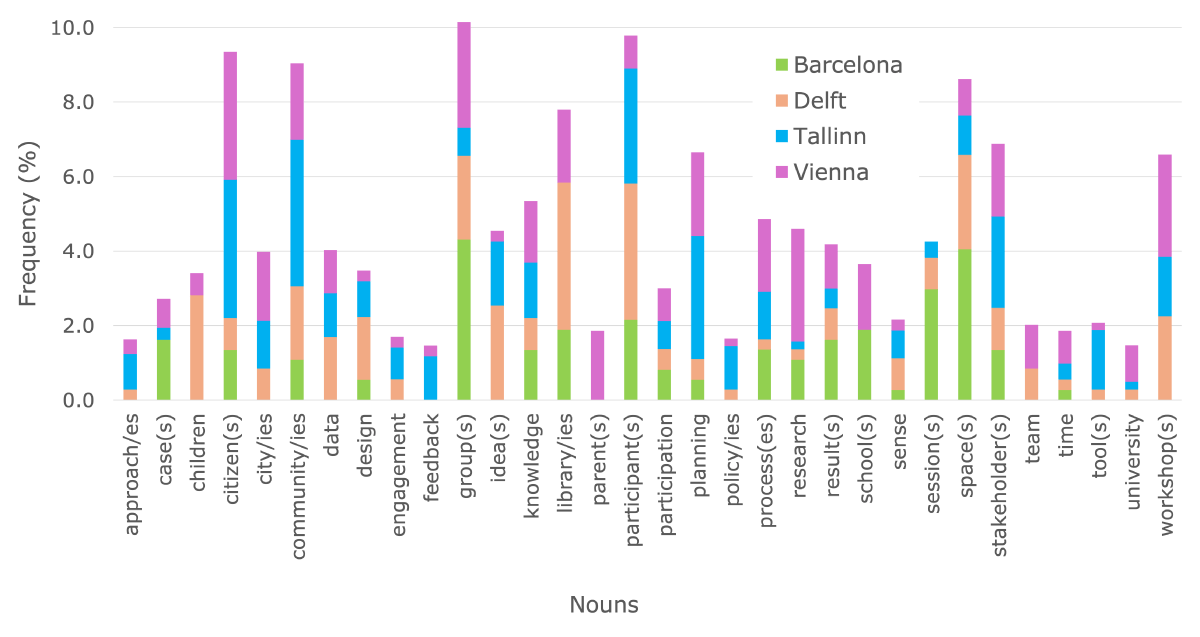
Figure 3
Frequency of nouns appearing in essays, shown for each city and ordered alphabetically.
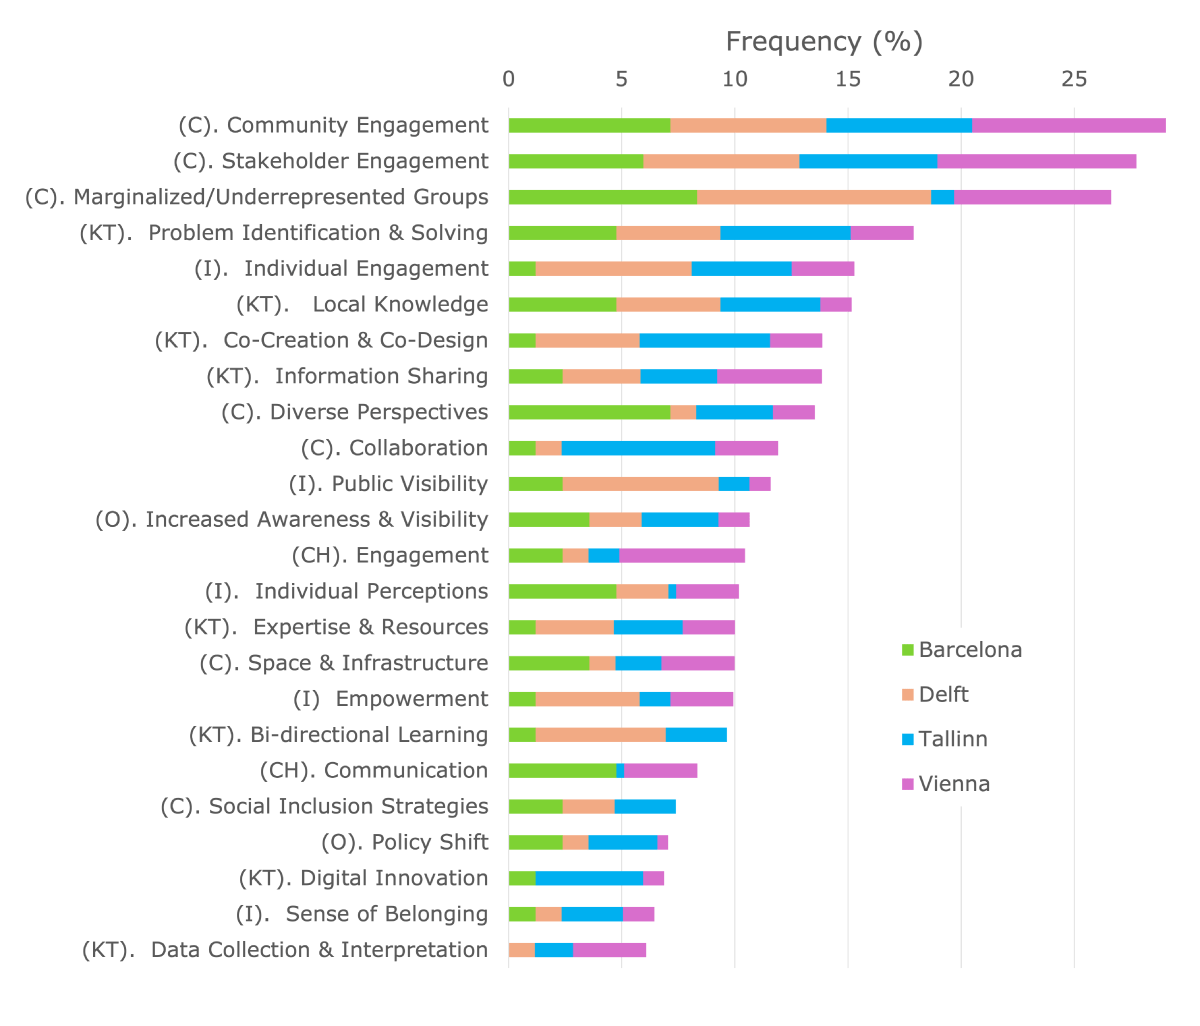
Figure 4
Frequency of codes tagged in essays, disaggregated by city. The codes are associated with their thematic code family: KT for Knowledge Transfer, C for Community, I for Individual, CH for Challenges, and O for Opportunities.
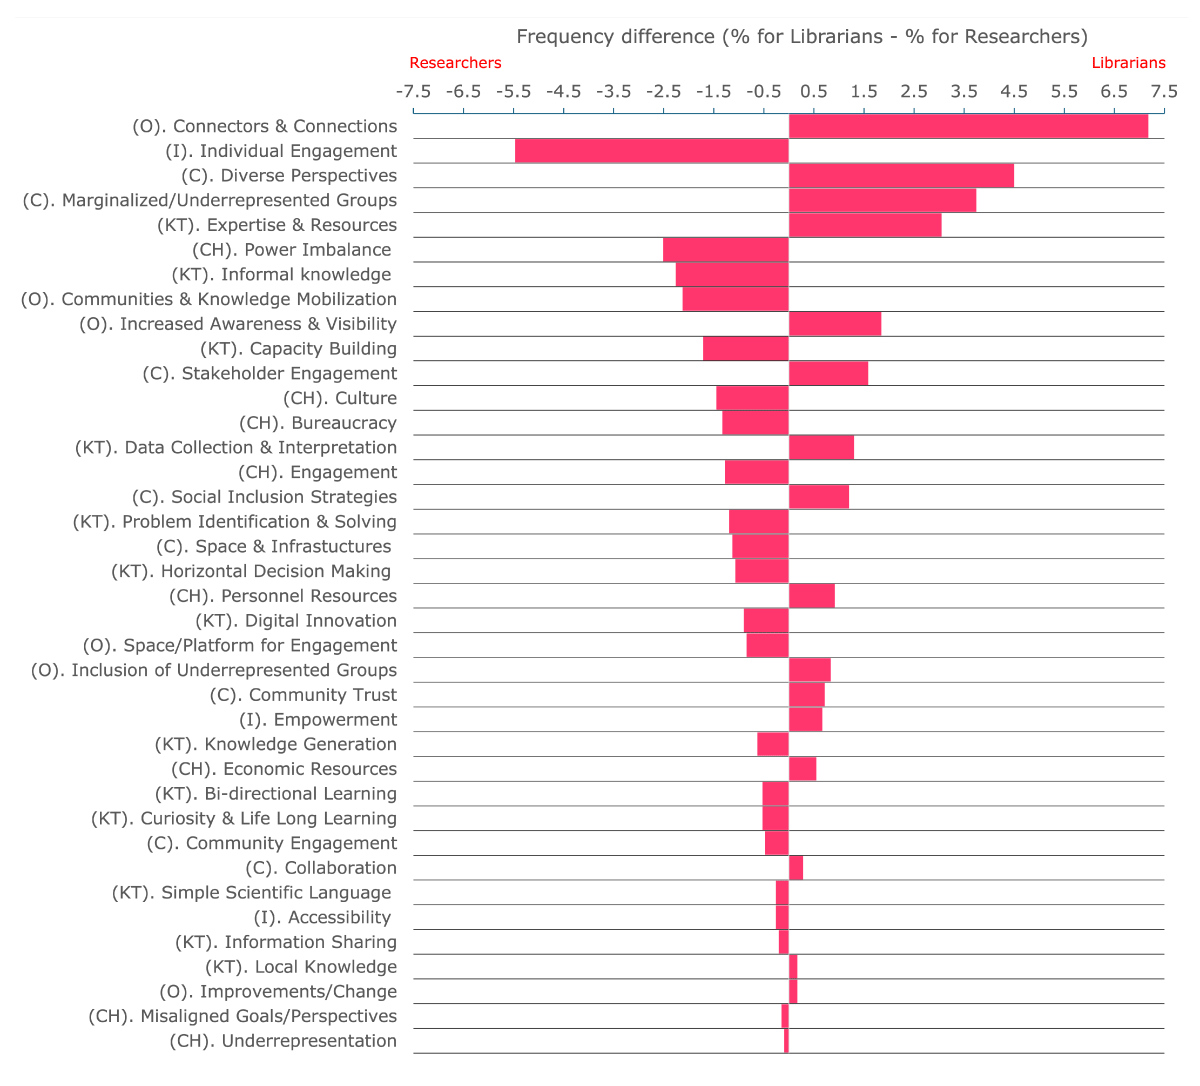
Figure 5
Differences in code frequencies between librarians and researchers, based on their respective interviews. Positive values indicate codes more frequently tagged in librarians’ interviews, while negative values indicate codes more frequently tagged in researchers’ interviews. The codes are associated with their thematic code family: KT for Knowledge Transfer, C for Community, I for Individual, CH for Challenges, and O for Opportunities.
Table 1
Pilots presented in alphabetical order by city, with their original and abbreviated names and their main characteristics.
| PILOT SHORTNAME(ORIGINAL NAME) | ISSUE | LOCATION | PARTICIPANTS | GLAM (ROLE) | METHODS |
|---|---|---|---|---|---|
| Barcelona_Heat (Heat Chronicles) | Residents’ perception of urban heat in public spaces not documented | Climate-vulnerable neighborhoods in the Barcelona region | School students Young people Elderly people Etc. | Public library (connector and community hub) (Figure 6a) | Collective mapping Thermal walks (Figure 6b) Collective data interpretation |
| Delft_Design (Check out your spot) | Voices of young residents not being heard in relation to urban design | Delft city Public Library | Young residents | Public library (host and research object) | Geolocation Co-design (Figure 6c) Simulations (Figure 6d) |
| Tallinn_AI (Niine Street) | Lack of citizens’ participation in urban planning practices | Community Museum | Citizens Stakeholders in urban planning projects | Community Museum (sessions’ host) | AI visualization (UrbanistAI) (Figure 6e) Co-design (Figure 6f) |
| Vienna_Heat (Urban Heat Stories) | Lack of knowledge about the perception of heat and related social effects at the micro level | Vienna city | Senior citizens School students | Academic library (partner, provider of data visualization facility) | Community mapping (Figure 6g) Thermal walk Collective data interpretation (Figure 6h) |
| Vienna_Planning (GUMPI Research) | Marginalized groups not engaged in their neighborhood re-design | Gumpi Street (Vienna) | Single parents School students | Academic library (partner, workshop host) | Community mapping Photowalks Model-making Research cafés |
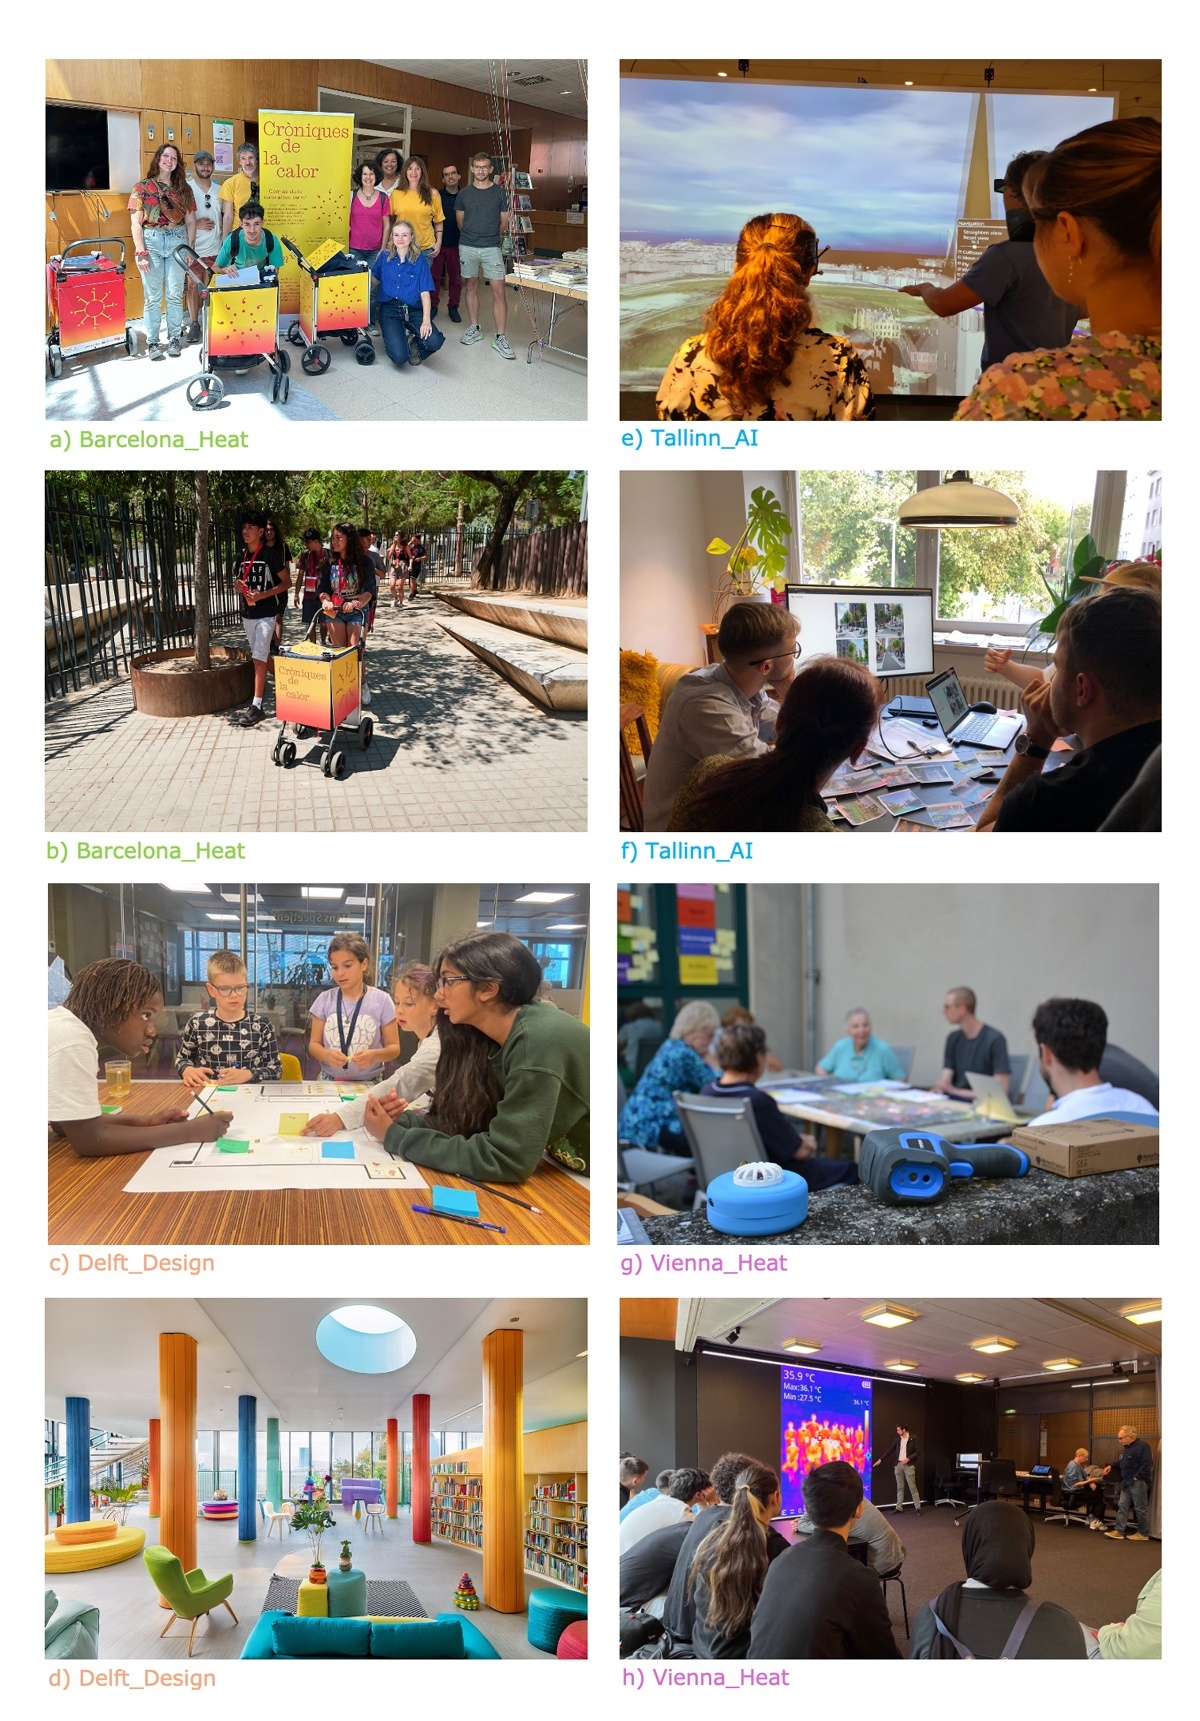
Figure 6
Representative photographs of the pilots (a–g), ordered alphabetically by city. Detailed descriptions are given in the Results section.
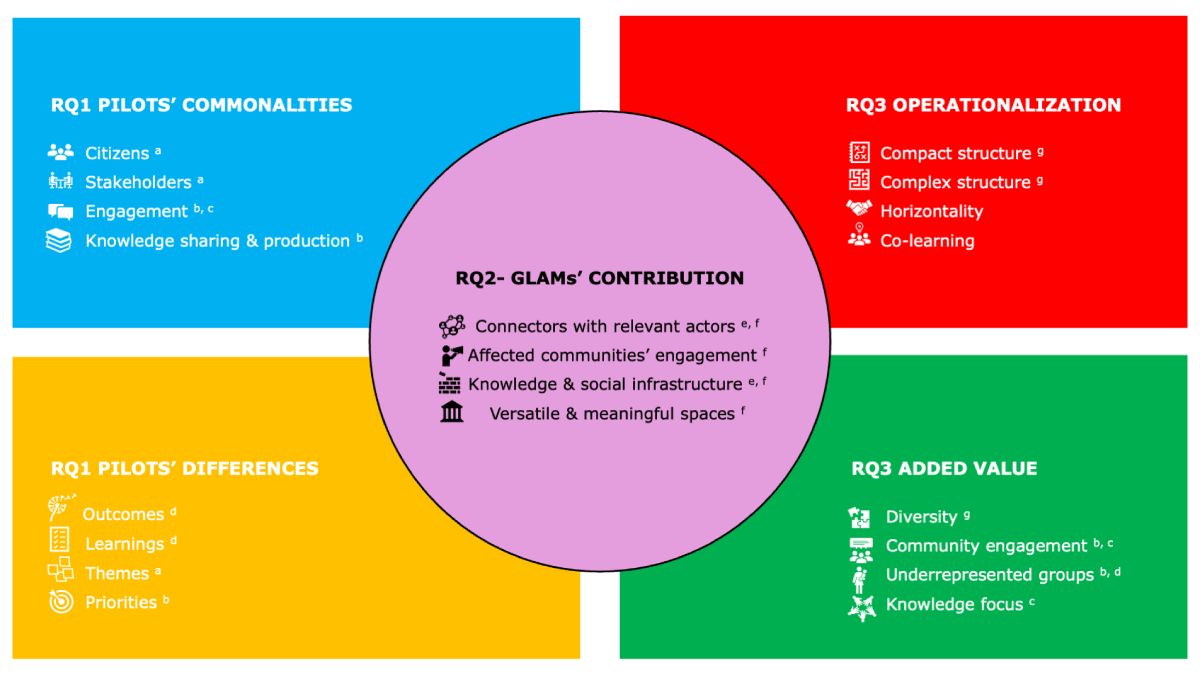
Figure 7
Summary of the results in relation to the Research Questions (RQs). Evidence related to each result follows: a) World frequency in essays, Figure 3; b) Essays coding, Figure 4; c) Interviews coding, Supplementary File 8; d) Surveys, Figure 2; e) Interviews coding, Figure 5; f) Supplementary File 3: Table S4; g) Supplementary File 3: Table S3.