
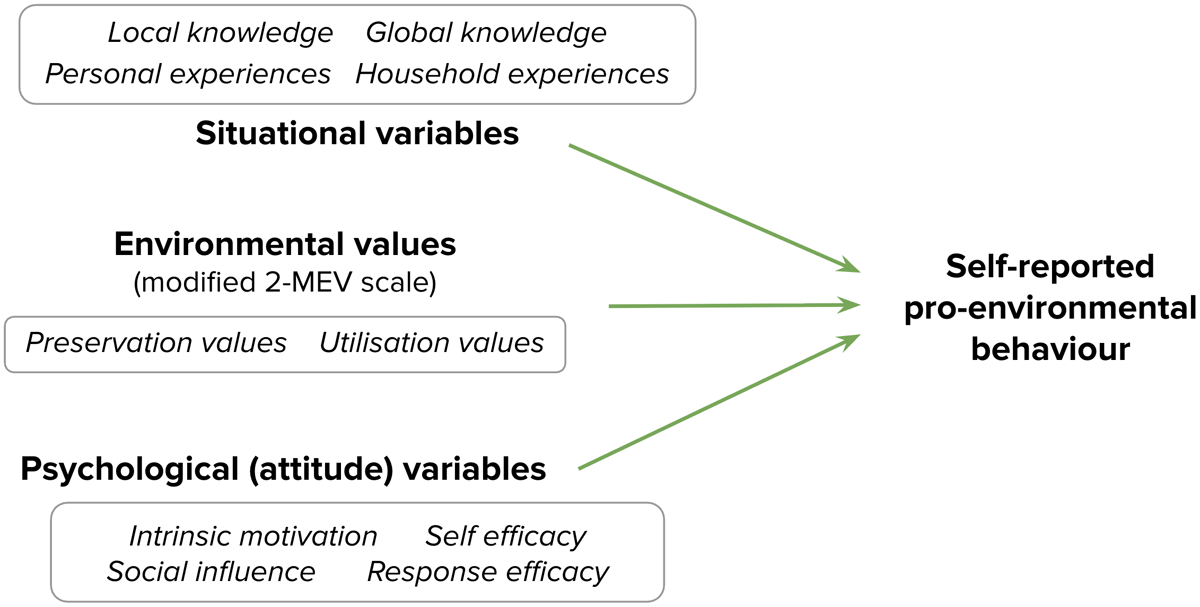
Figure 1
The environmental behaviour framework guiding this study, adapted from Barr and Gilg (2007), with a modified 2-MEV scale from Bogner and Wiseman (1999, 2006).
Table 1
Characteristics of the eight participating schools in this study.
| SCHOOL | CURRICULUM TYPE | NUMBER OF STUDENTS SURVEYED | CITIZEN SCIENCE PROJECT TYPE | CITIZEN SCIENCE PROJECT TOPIC | CITIZEN SCIENCE PROJECT EXPERIENCE DURATION |
|---|---|---|---|---|---|
| 1 | International | 15 | Contributory | Terrestrial biodiversity | 1 day, <40 minutes |
| 2 | International | 134 | Contributory | Terrestrial and coastal biodiversity | 1 day, >40 minutes |
| 3 | Local | 6 | Contributory | Terrestrial and coastal biodiversity | 1 day, >40 minutes |
| 4 | Local | 8 | Contributory | Terrestrial and coastal biodiversity | 1 day, <40 minutes |
| 5 | International | 6 | Contributory | Terrestrial and coastal biodiversity | 1 day, < 40 minutes |
| 6 | International | 5 | Co-created | Coastal biodiversity and marine pollution | 2 days: > 40 minutes |
| 7 | International | 5 | Contributory (online only) | Air quality | Every week/month, > 40 minutes |
| 8 | Local | 8 | Co-created | Marine plastic pollution | Every week/month, > 40 minutes |
Table 2
A summary of variables with statistically significant results. Each cell in the table includes the pre-survey Mean (T1), post-survey Mean (T2), Test statistic (W), p-value, effect size (r), and the PS value.
| PRESERVATION VALUES | SELF-EFFICACY IMPORTANCE | SELF-EFFICACY CONFIDENCE | LOCAL KNOWLEDGE | TOTAL KNOWLEDGE | SELF-REPORTED BEHAVIOUR | |
|---|---|---|---|---|---|---|
| Overall (n = 187) | 19.91 | 21.23 | 19.19 | 1.35 | 2.27 | 27.60 |
| 19.50 | 21.00 | 18.54 | 1.62 | 2.60 | 28.70 | |
| 4061 | 4046.50 | 4386 | 4638 | 5601 | 9053.50 | |
| .013 | .356 | .022 | <.001 | <.001 | .003 | |
| 0.181 | (not stat. sig.) | 0.167 | 0.246 | 0.248 | 0.215 | |
| 60 | 59 | 64 | 64 | 62 | ||
| Local schools (n = 22) | 19.91 | 21.27 | 19.55 | 2.57 | 3.57 | 27.82 |
| 20.45 | 21.27 | 20.14 | 2.93 | 3.89 | 28.00 | |
| 54 | 36 | 40 | 22 | 47 | 78.50 | |
| .726 | .505 | .253 | .05 | .152 | .197 | |
| (not stat. sig.) | (not stat. sig.) | (not stat. sig.) | 0.418 | (not stat. sig.) | (not stat. sig.) | |
| 74 | ||||||
| International schools (n = 165) | 19.91 | 21.22 | 19.10 | 1.18 | 2.10 | 27.5 |
| 19.37 | 20.96 | 18.30 | 1.45 | 2.43 | 28.8 | |
| 3190 | 3335 | 3285 | 1830.50 | 2092.50 | 4080.50 | |
| .012 | .438 | .006 | .004 | .001 | .006 | |
| 0.196 | (not stat. sig.) | 0.215 | 0.227 | 0.248 | 0.214 | |
| 61 | 62 | 63 | 62 | 62 | ||
| Contributory projects (n = 174) | 19.84 | 21.16 | 19.23 | 1.26 | 2.15 | 27.64 |
| 19.45 | 21.05 | 18.53 | 1.53 | 2.46 | 28.67 | |
| 3769 | 3828.50 | 3757 | 1990 | 2424 | 4762.50 | |
| .037 | .674 | .019 | .002 | .002 | .012 | |
| 0.196 | (not stat. sig.) | 0.197 | 0.164 | 0.167 | 0.135 | |
| 61 | 61 | 59 | 59 | 57 | ||
| Co-created projects (n = 13) | 20.85 | 22.15 | 18.62 | 2.46 | 3.92 | 26.38 |
| 20.08 | 20.31 | 18.69 | 2.89 | 4.42 | 28.77 | |
| 2.50 | 2 | 27 | 6 | 6 | 9.50 | |
| .026 | .042 | .959 | .046 | .025 | .02 | |
| 0.436 | 0.399 | (not stat. sig.) | 0.391 | 0.438 | 0.455 | |
| 75 | 73 | 73 | 75 | 76 | ||
| Younger secondary (Gr. 6–8; n = 124) | 19.44 | 20.81 | 19.19 | 1.25 | 2.04 | 28.23 |
| 19.13 | 20.82 | 18.57 | 1.46 | 2.27 | 28.58 | |
| 2124 | 1908.50 | 1970 | 1134 | 1411.50 | 3498.50 | |
| .214 | .981 | .105 | .048 | .061 | .331 | |
| (not stat. sig.) | (not stat. sig.) | (not stat. sig.) | 0.126 | (not stat. sig.) | (not stat. sig.) | |
| 57 | ||||||
| Older secondary (Gr. 9–12; n = 63) | 20.83 | 22.05 | 19.19 | 1.53 | 2.74 | 26.22 |
| 20.22 | 21.35 | 18.48 | 1.94 | 3.25 | 28.86 | |
| 293 | 392 | 478 | 182 | 202.50 | 342 | |
| .006 | .103 | .081 | .002 | <.001 | <.001 | |
| 0.246 | (not stat. sig.) | (not stat. sig.) | 0.278 | 0.309 | 0.344 | |
| 64 | 65 | 67 | 69 | |||
| Female (n = 78) | 20.50 | 21.18 | 19.13 | 1.16 | 2.03 | |
| 19.97 | 21.13 | 18.12 | 1.58 | 2.49 | 27.90 | |
| 675 | 796 | 580.50 | 234.50 | 313.50 | 28.58 | |
| .032 | .987 | .021 | <.001 | .001 | 1080.50 | |
| 0.172 | (not stat. sig.) | 0.185 | 0.265 | 0.255 | .257 | |
| 59 | 60 | 65 | 64 | (not stat. sig.) | ||
| Male (n = 95) | 19.72 | 21.34 | 19.26 | 1.53 | 2.53 | 27.88 |
| 19.41 | 21.03 | 19.04 | 1.76 | 2.83 | 29.38 | |
| 1060 | 996 | 1431 | 737.50 | 923.50 | 1308 | |
| .146 | .370 | .362 | .035 | .038 | .010 | |
| (not stat. sig.) | (not stat. sig.) | (not stat. sig.) | 0.153 | 0.151 | 0.186 | |
| 58 | 58 | 59 |
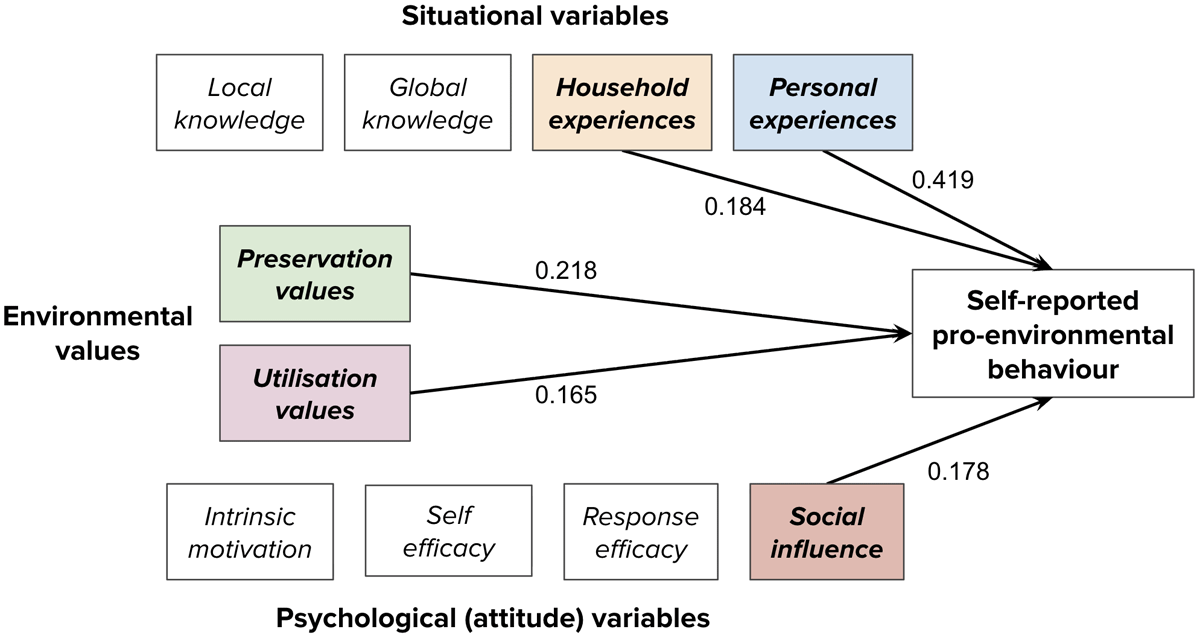
Figure 2
Framework diagram showing which variables influence pro-environmental behaviour, with the statistically-significant standardized coefficient values being the proportion of variance explained by each bolded variable.
Table 3
The variables which have statistically-significant influence on pro-environmental behaviour. The variables are ranked in descending order, with the values in brackets being the standardized coefficient values, showing how much variance of self-reported behaviour can be explained by that variable. See Supplemental File 7 for additional regression output results.
| SCHOOL TYPE | CITIZEN SCIENCE PROJECT TYPE | SCHOOL LEVEL | GENDER | |||
|---|---|---|---|---|---|---|
| Local school (n = 22) | International school (n = 165) | Contributory (n = 174) | Younger secondary (ages 11–14) (n = 124) | Older secondary (ages 15–19) (n = 63) | Female (n = 78) | Male (n = 95) |
| Personal experiences (0.481) | Personal experiences (0.401) | Personal experiences (0.414) | Personal experiences (0.414) | Personal experiences (0.445) | Personal experiences (0.466) | Personal experiences (0.371) |
| – | Social influence (0.227) | Social influence (0.222) | Social influence (0.314) | Self–efficacy confidence (0.308) | Preservation values (0.251) | Household experiences (0.307) |
| – | Household experiences (0.187) | Preservation values (0.192) | Household experiences (0.218) | – | – | Utilisation values (0.186) |
| – | Preservation values (0.185) | Household experiences (0.182) | Utilisation values (0.185) | – | – | – |
| – | Utilisation values (0.178) | Utilisation values (0.165) | – | – | – | – |