
Introduction
Biodiversity is declining globally due to increasing anthropogenic pressures, underscoring the need for effective species monitoring (Bowler et al. 2020). Citizen science (CS), scientific contributions from the general public in scientific research, is an important approach for monitoring biodiversity (Haklay et al. 2021). CS projects advance scientific knowledge by enabling data collection over wide geographical areas, which would be otherwise unattainable (Dickinson et al. 2012). CS projects also benefit volunteers by connecting them with nature, fostering community engagement, providing learning opportunities, and raising awareness about local biodiversity (Geoghegan et al. 2016). Understanding volunteers’ motivations for participating in CS projects involves recognizing their primary motivations, which can be both intrinsic factors, such as a genuine interest in wildlife or science, and extrinsic factors, such as career advancement or personal growth (West et al. 2021). Additionally, volunteers can innovate scientific practice through active knowledge exchange with scientists, creating a virtuous circle where their local insights and practical approaches enhance research methods, thereby integrating their contributions into the scientific process and fostering mutual learning (Hinojosa et al. 2021).
Understanding the motivations driving volunteers’ participation in CS projects involves acknowledging the link to science capital (Edwards et al. 2018). Science capital represents the accumulation of science-related knowledge, attitudes, experiences, and resources that individuals acquire throughout their lives (Archer et al. 2015). It can be measured by assessing individuals’ scientific literacy, exposure to science-related media, and participation in science-related activities (Archer et al. 2015; Jones et al. 2022). However, it has not been extensively measured for adults (Kaakinen et al. 2023). Science capital plays an important role in shaping individuals’ involvement in science-related activities and their overall understanding and appreciation of science (Bourdieu 1984; Archer et al. 2015). By assessing the science capital levels of volunteers, researchers can gain insights into whether certain demographics or communities with lower science capital are underrepresented in the project. Participating in CS projects has the potential to enhance individuals’ science capital by expanding their scientific knowledge and skills, particularly in relation to newer methodologies (Edwards et al. 2018). Recognising and understanding individuals’ science capital is important for adapting the educational and learning aspects of the project to improve volunteer retention (Gold and Ochu 2018).
Engaging citizen scientists in environmental DNA–based monitoring
Environmental DNA (eDNA) is a non-invasive method for surveying biodiversity, involving the collection of environmental samples (e.g., water, soil, or air), and when combined with high-throughput sequencing, eDNA metabarcoding has the potential to identify multiple species within an environmental sample (Valentini et al. 2016). With the simplicity and speed of collecting environmental samples, eDNA offers a valuable opportunity for citizen scientists to contribute to rapid biodiversity assessments (Clarke et al. 2023). Citizen scientists have contributed to eDNA surveys by assisting in the collection of eDNA samples from aquatic habitats to target one (Biggs et al. 2015) or multiple species (Suzuki-Ohno et al. 2023), and to analyse eDNA data (Tøttrup et al. 2021; Leerhøi et al. 2024). Previous studies have shown that it is feasible to include volunteers in eDNA surveys with limited training (Biggs et al. 2015), yet challenges have been identified, with citizen scientists facing difficulties in selecting appropriate sampling sites and understanding species names when presented with the results (Suzuki-Ohno et al. 2023). The use of eDNA to detect mammals presents an exciting opportunity for citizen scientists to conduct biodiversity assessments of species that are often difficult to visually encounter (Broadhurst et al. 2025).
To ensure the successful involvement of citizen scientists in eDNA surveys, it is essential to assess the scientific and social aspects of the project. This involves recognising the benefits and values for volunteers while advancing conservation efforts and scientific knowledge (Robinson et al. 2018). However, a significant gap exists in eDNA CS research regarding the understanding of factors that motivate volunteers to engage in eDNA surveys and their personal experiences with eDNA data collection. To address these gaps, our study incorporated the European CS Association’s (ECSA) 10 principles of CS into the research objectives (Pocock et al. 2014; Robinson et al. 2018). To support the integration of these principles into our study, we conducted two surveys, one before and one after eDNA sampling to investigate the citizen scientists’ motivation for participating, science capital level, and overall experience with eDNA sampling. To enhance citizen scientists’ skills and knowledge in eDNA monitoring, we provided an educational and interactive training workshop that was designed to facilitate collaboration between researchers and citizen scientists. Additionally, we evaluated the effectiveness of their eDNA surveying efforts by comparing results obtained by citizen scientists and researchers. A further workshop was conducted to openly share the results with the citizen scientists, and to provide feedback to volunteers, acknowledging their valuable contributions. The workshops and combined quantitative and qualitative analysis not only help to improve our understanding of the volunteers’ experience of eDNA sampling but to also provide context and opportunities for mutual learning between the researchers and citizen scientists (Rüfenacht et al. 2021). This case study presents findings regarding the effectiveness of these workshops and eDNA surveying efforts, based on a group of ten participants. While a total of ten volunteers participated, only six completed the post-sampling survey, limiting the scope of the conclusions but providing valuable exploratory insights into the eDNA training process and its outcomes.
Methods
Procedure for citizen scientists
The citizen scientists involved in this project were conservation volunteers with the Essex Wildlife Trust (EWT). To ensure thorough planning, discussions, and firsthand training for every volunteer, we developed a five-phase framework (Figure 1a–e). Before the start of the project, the researchers and EWT staff designed and planned the project (Figure 1a). Volunteer recruitment began with the EWT distributing a project information sheet, prepared by the researchers, to all EWT members. This targeted outreach ensured that potential volunteers were well-informed about the project’s goals and requirements. Ten volunteers attended the workshop on 15th November 2021 at Abberton Reservoir (The Rows, Colchester, CO2 0EU; Figures 1b and 2d). Volunteers gave informed consent through a signed form (Supplemental File 1: Appendix 1). The workshop aimed to provide detailed information on how to conduct eDNA surveys, share results from the same area (Broadhurst et al. 2021), and train the volunteers in eDNA sample collection (Figure 2c) and filtration techniques (Figure 2e).
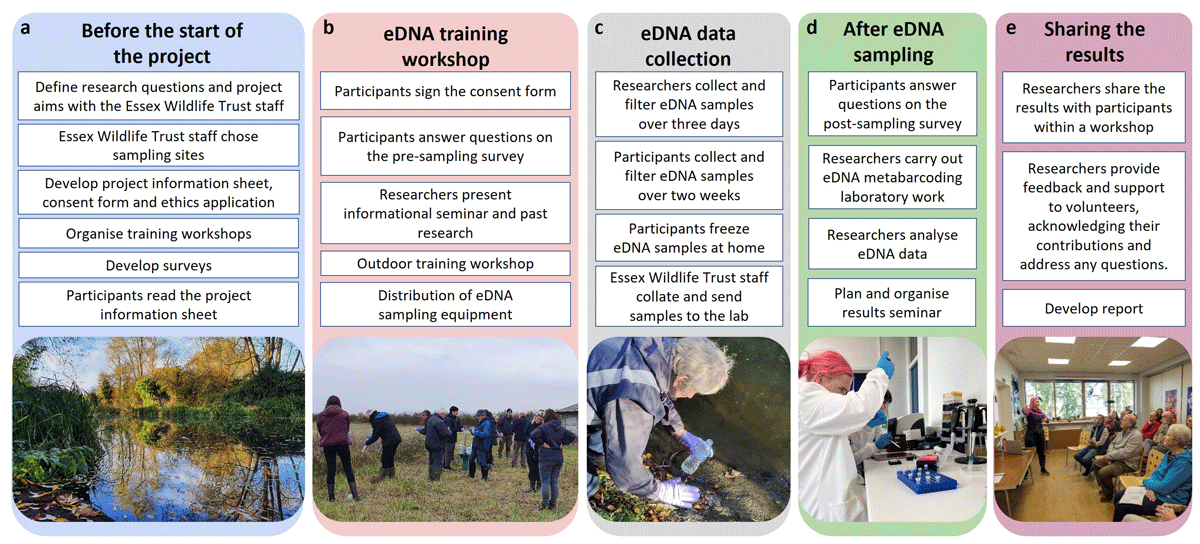
Figure 1
Workflow of the scientific process.
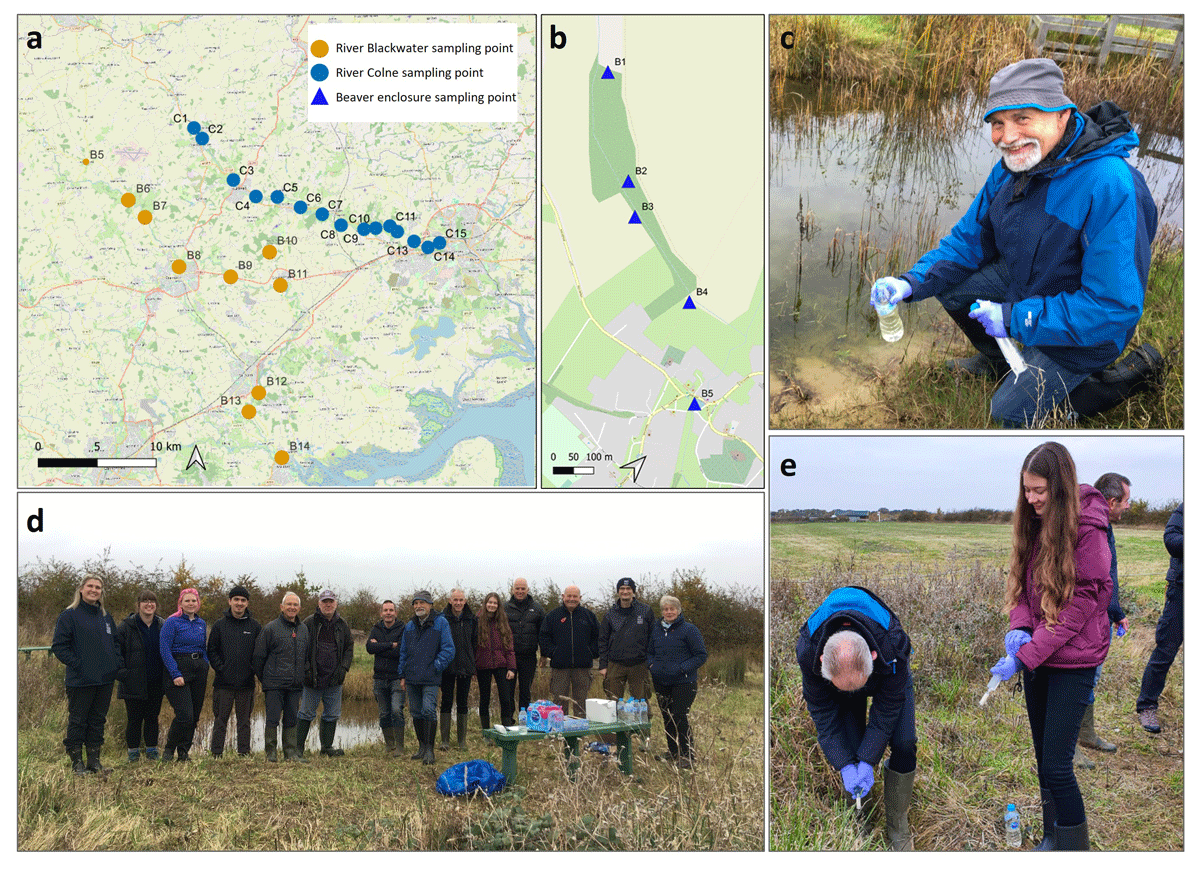
Figure 2
(a) Environmental DNA (eDNA) sampling locations in Essex along the river Colne (C1–C15), river Blackwater (B6–B14) and (b) inside and downstream of the beaver enclosure (B1 – B5). (d) The volunteers, Essex Wildlife Trust (EWT) staff and researchers attending the environmental DNA (eDNA) training workshop at Abberton Reservoir in November 2021. Volunteers were trained in eDNA water sample collection (c) and filtration (e).
To reduce the risk of contamination in the field, the citizen scientists were provided with information on how contamination occurs and how to avoid it when collecting and filtering eDNA samples. Participants wore sterile, disposable gloves (small, medium, or large) before handling the eDNA sampling equipment, subsequently emptied a 500 ml bottle of water (bought new for this study), and closed the lid again before walking up to a pond at Abberton Reservoir. They collected an eDNA water sample by fully submerging the bottle in a large pond from a reachable distance (Figure 2c). The volunteers performed on-site filtration using a Sterivex filter (pore size 0.45 μm; Merck Millipore, Darmstadt, Germany) and a 60-ml single-use syringe (TERUMO, Tokyo, Japan; Figure 2e). They filtered the 500-ml sample until it was fully processed, or the filter clogged, then labelled a sterile plastic grip seal bag and placed the filter inside. Following the workshop, participants and researchers collected eDNA samples (Figure 1c), and the researchers carried out laboratory work (Figure 1d). The results of the project were shared with the volunteers during another workshop (Figure 1e).
Pre-sampling survey
The pre-sampling survey was conducted at the start of the workshop, after the volunteers had reviewed the information sheet and signed the consent form but before the informational seminar, outdoor workshop, and the eDNA sampling (Figure 1b). The sequence of events ensured citizen scientists’ motivations were unaffected by workshop activities and informed us about their science capital so that we could tailor the complexity of knowledge and language for future communications. The survey included 13 questions, covering volunteer demographics (age, gender, level of education, ethnic group, and physical or mental health conditions [Supplemental File 2: Table S1]), previous volunteering experiences, their related skills or knowledge, and their prior experience with eDNA, including awareness of eDNA surveys and previous involvement in sampling. Volunteers rated their level of agreement with 13 motivational statements (West et al. 2021; Supplemental File 3: Table S2) and eight statements on science capital (Archer et al. 2015; Supplemental File 4: Table S3) using a Likert scale (Likert 1932) ranging from 1 (strongly disagree) to 5 (strongly agree).
Environmental DNA methods
The ten volunteers chose one or multiple sites selected by the EWT along the rivers Colne and Blackwater (Figures 1b and 2b), and inside and downstream from the beaver enclosure (B2, B4, B5, in Figure 2b). The researchers collected the eDNA samples over three days (16th–18th November 2021), while the volunteers had the flexibility to collect their samples at any time over a two-week period (16th–30th November 2021), reflecting what would typically happen in a CS survey involving multiple volunteers.
eDNA sampling was identical to that used during the training workshop and followed protocols described in Broadhurst et al. (2021). Five 500-ml eDNA water replicates were collected from each sampling site along the rivers, by both volunteers and researchers (Figure 1c). The volunteers collected five water sample replicates from one site inside the beaver enclosure (B2), one downstream from the beaver enclosure (B4), and one from the large pond inlet (B5). The researchers collected five water replicates from each of the four sites inside and downstream from the beaver enclosure (B1–B4), and ten replicates were collected from a large pond inlet of a brook (B5; Figure 2b). The additional samples were collected opportunistically by the researchers to answer further questions, not related to this study, on the development of the beaver enclosure. Six field controls were collected by researchers, consisting of a bottle of distilled water (500 ml) opened briefly at the beginning and end of each of the three sampling days to test for field contamination. Volunteers did not collect field controls as is generally typical of CS eDNA studies (e.g., Suzuki-Ohno et al. 2023; Clarke et al. 2023), to avoid adding additional steps to their sampling methodology. Overall, three researchers collected 150 eDNA water sample replicates from 24 locations, and ten volunteers collected 135 eDNA water sample replicates from 22 locations. Volunteers stored the filters in a freezer at their homes in sterile bags until the samples were collected by the EWT staff and transported to the laboratory at the University of Salford using courier services.
Laboratory methods and bioinformatics analysis followed protocols described by Sales et al. (2020) and Broadhurst et al. (2021), and a complete description of each step is provided in Supplemental File 5: Appendix 2. Briefly, DNA was extracted from the filters following the Mu-DNA water protocol (Sellers et al. 2018). Six DNA extraction negative controls (one for each day of extractions) containing only extraction buffers were included. eDNA was amplified using the MiMammal 12S primer set (Ushio et al. 2017). All samples and controls were distributed across four sequencing libraries, and the final pool was sequenced on a single Illumina MiSeq run at 18 pM concentration for 2 × 150-bp paired-end sequencing using an Illumina v3 600 Reagent kit (Illumina, San Diego, CA, USA).
Post-sampling survey
The post-sampling survey was conducted after the volunteers had taken part in eDNA sampling using a web-based platform (Microsoft Forms; Figure 1d). The post-sampling survey included 13 questions (Supplemental File 6: Table S4). Volunteers reported the number of sampling sites they visited and responded to a series of open-ended questions aimed to capture their reflections on the eDNA sampling process. This included the aspects of the sampling that were successful to them, how they felt afterwards, whether they encountered any challenges, and how they resolved them. Volunteers were asked to describe any skills or knowledge gained through volunteering for the project, and if their motivations changed over time. To gauge their interest in learning more about the laboratory process, volunteers were asked if they would like the option to track their samples. Volunteers were asked for feedback on the project’s design to enhance future CS experiences, as well as their willingness to volunteer for the research project again. Following the post-sampling survey, a results workshop was organised at Hanningfield Reservoir (Giffords Ln, Downham, Chelmsford CM3 8HX) to share and discuss the eDNA metabarcoding results (Figure 1e).
Survey data analysis
All statistical analyses were performed using R v4.2.0 (R Core Team 2022). To determine the volunteers’ primary motivators for participating in this project, a diverging bar chart was created using ggplot2 (Wickham et al. 2016) to illustrate Likert scale responses. To calculate a science capital score for each volunteer, we followed the methods by Archer et al. (2015). The eight variables (Supplemental File 4: Table S3) were used to create a composite measure of science capital and responses were scored as follows: Strongly disagree = 1, disagree = 2, neither agree nor disagree = 3, agree = 4, and strongly agree = 5. The value for each response was summed to generate a single science capital score, which was divided into three groups: low (0–13), medium (14–27), and high (28–40) science capital. A boxplot was created using ggplot2 (Wickham et al. 2016), illustrating the volunteer’s science capital scores. Thematic analysis (Braun and Clarke 2006) was conducted on the open-ended responses in the post-sampling (Questions 2–7, 9, and 10, Supplemental File 6: Table S4) using NVivo v 1.6.1 (QSR International, Burlington MA, USA). The coding process encompassed both deductive codes that were identified from the research questions and inductive codes that emerged from the data.
Environmental DNA data analysis
Only the sample sites where both citizen scientists and researchers collected eDNA samples (sites C1–C15, B2, B4–B14 in Figure 2a,b) was retained for downstream analysis, allowing for a direct comparison of results. The read counts in the eDNA water replicates for each sampling location were combined and converted into binary presence-absence data. A bar chart was created using ggplot2 (Wickham et al. 2016) showing the number of sites at which a species was detected. To determine if the number of sites sampled by the volunteers and researchers was adequate to represent the overall species diversity along both rivers and to estimate the sampling effort needed to fully determine the species richness (Hsieh, Ma, and Chao 2016), species accumulation curves were created using the R package iNext (Hsieh, Ma, and Chao 2020). To illustrate the differences in the average species richness in sample sites between the samples collected by researchers and volunteers, box and jitter plots were created using the tidyverse R package (Wickham et al. 2019). A Wilcoxon signed-rank test was used to determine if there was a significant difference between the number of species detected by citizen scientists and researchers at sites with the same sampling effort (sites C1–C15, B2, B4, B6–B14 in Figure 2a,b).
Results
Citizen scientists’ engagement
Ten volunteers participated in the eDNA workshop, completed the pre-sampling survey, and collected eDNA samples (Figure 2d). Of these, six volunteers responded to the post-sampling survey. Of the ten volunteers, three were female and seven were male. All were white/British, had some level of education, and most were aged 55+ (8/10; Table 1). Eight volunteers had heard of eDNA before this project through university (2/10), TV programs (2/10), or EWT information (4/10). They expressed interest in seven conservation roles: Wildlife surveys (10/10), habitat maintenance (6/10), environmental work (5/10), practical work (4/10), GPS mapping (3/10), plant identification (3/10), and working with people (2/10). The highest-rated motivations, categorized as intrinsic, were “help science,” “values,” “help wildlife,” and “specific site concern.” The lowest-rated motivations were extrinsic, including “enhancement,” “career,” and “responding to a request” (Supplemental File 7: Figure S1; Supplemental File 3: Table S2).
Table 1
Citizen scientists’ information.
| CHARACTERISTIC | FREQUENCY | |
|---|---|---|
| Gender | Female | 3 |
| Male | 7 | |
| Ethnicity | White/British | 10 |
| Age | 18–24 years | 1 |
| 25–34 years | 1 | |
| 55–64 years | 3 | |
| 65–74 years | 4 | |
| 75+ years | 1 | |
| Level of education | A-levels | 4 |
| Apprenticeship | 1 | |
| Certificate of Higher Education (CertHE) | 1 | |
| Postgraduate Certificate in Education (PGCE) | 1 | |
| Degree with Honours | 1 | |
| Master’s degree | 1 | |
| Doctorate | 1 | |
Nine out of ten volunteers answered the science capital question, with scores ranging from 22 to 39. Four volunteers had medium scores (14–27), and five had high scores (28–40), with most scoring 4 or 5 for each variable (Supplemental File 8: Figure S2). Volunteers scored high in “science-related attitudes and values” and “consumption of science-related media,” but lower in “family, science skills, knowledge, and qualifications” and “knowing people in a science-related job/role,” respectively (Supplemental File 4: Table S3).
Post-sampling survey findings
Six key themes were identified in the thematic analysis conducted with responses from the six volunteers: “experience and motivation,” “emotions and feelings,” “learning and acquiring knowledge,” “Sense of purpose,” “challenges and problem-solving,” and “project outcomes and communication” (Figure 3). The themes and sub-themes are examined here with their corresponding codes and supported by unedited excerpts from the data to highlight significant aspects. The codes are in italics and evidence from survey answers are in italics and quotation marks.
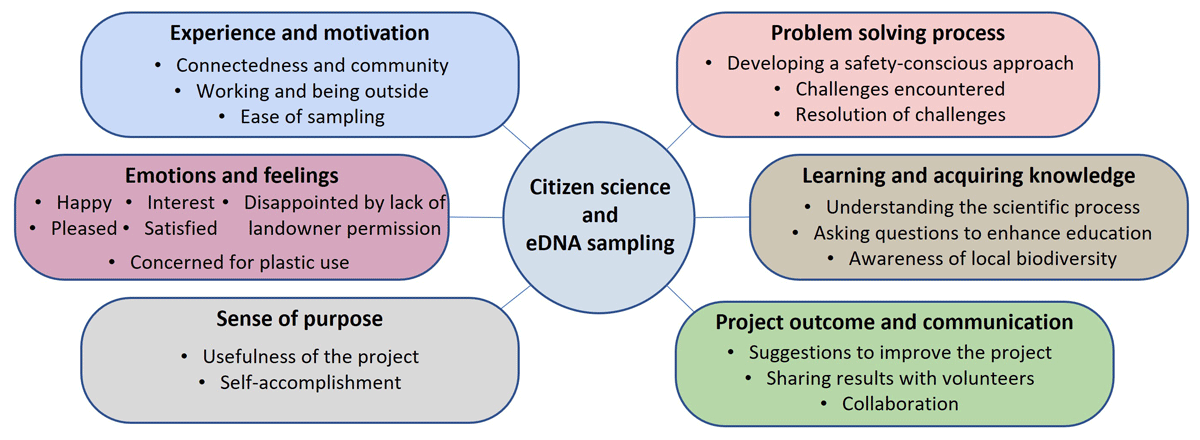
Figure 3
An illustration of the main themes identified through thematic analysis.
Citizen scientists’ experience and motivation
Six citizen scientists described the ease of collecting and filtering eDNA samples from the rivers, with one noting that visiting the site was “fairly straightforward.” Three volunteers enjoyed working and being outside and visiting new locations, another appreciated solving challenges during the project. Additionally, one volunteer enjoyed the planning and organisation aspect of the work and completed the task relatively quickly. One volunteer did not find anything useful or enjoyable about the filtering stage, despite finding the filtering easy.
Citizen scientists’ emotions and feelings
After the eDNA sampling, three volunteers felt pleased with their work, with one noting satisfaction with the “effort and result” and another pleased that the filtering was done “without contamination or loss of sample.” Two volunteers felt relief and satisfaction upon completing the filtering. However, three volunteers expressed concerns about the environmental impact of single-use plastic consumables, and one was disappointed that “most of the sites – did not receive landowner permission.”
Sense of purpose
Six volunteers reported a sense of purpose and self-accomplishment from their participation, recognizing their contributions as meaningful and valuable. One volunteer enjoyed “being involved in an interesting project, right at the beginning,” while another appreciated “the idea that this would ultimately benefit conservation.” Six volunteers also highlighted the project’s usefulness, expressing that they were “glad to be part of an important project” and felt they were “doing something to help.”
Challenges and problem-solving
Four volunteers found it challenging to collect eDNA water samples by the river, which involved “stretching” or “bending down” (Figure 4a). Three volunteers overcame this by using a long reach litter picker to hold the sample bottle to “get away from the river[‘]s edge” so the “sample wasn’t e[a]ffected by weed and detritus.” The pickers were stored in plastic bags after use and sterilized with a bleach solution (dilution unknown), then rinsed with bottled water to remove any residual bleach before the next collection (Figure 4b,c). Collecting murky water, which can be difficult to filter, was also noted as a challenge. One volunteer “moved position to collect clearer samples,” while another used a “silicon[e] gun which worked but was able to squeeze all of the samples by hand.” Additionally, one volunteer was safety conscious, suggesting “it’s best to have at least two people there with one collecting the sample and one as a safety measure.”
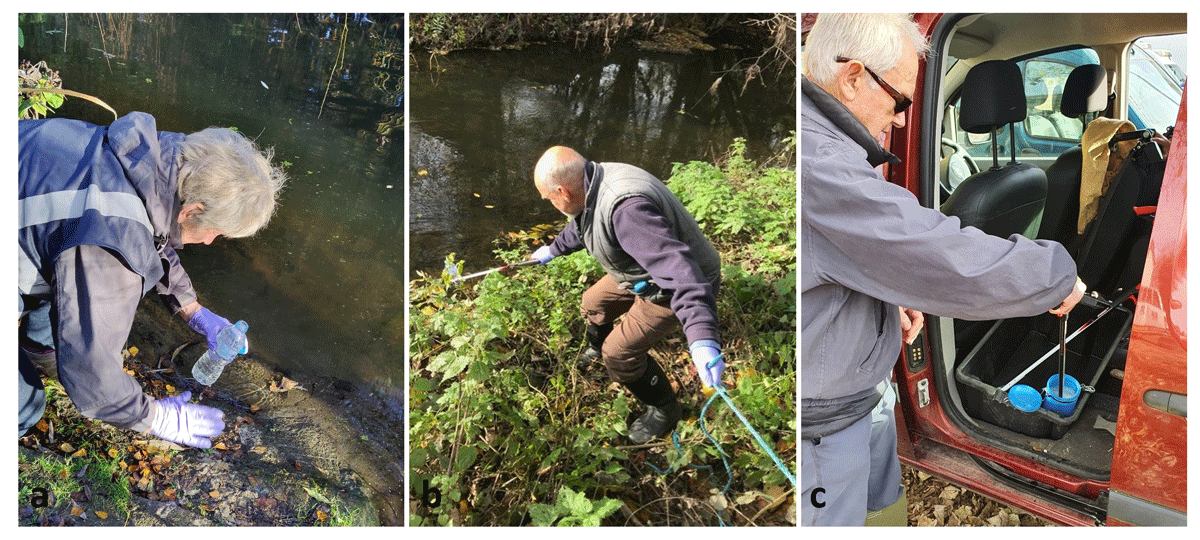
Figure 4
Citizen scientists carrying out the environmental DNA (eDNA) sampling. (a) Collecting eDNA water samples from the rivers’ edge with a water bottle and (b) using a long-reach litter pick to collect the water sample, then (c) sterilizing the litter pick.
Learning and acquiring knowledge
All volunteers expressed a strong interest in learning about eDNA metabarcoding which raised thought-provoking questions such as “How long does DNA stay in the water?”, “How far does DNA drift downstream?”, and “it would be good to see the machinery/process involved in analysing the samples.” Volunteers developed an understanding of how the scientific process works, with one volunteer developing an “appreciation of the possibilities of eDNA,” and another found it “interesting to see which mammals had been identified” using eDNA metabarcoding in a previous sampling season. One volunteer expressed uncertainty about learning anything new, and another expected to gain a better understanding of the results with further explanation.
Project outcomes and communication
Multiple suggestions were made by the volunteers to improve the project. One volunteer recommended providing larger glove sizes, while another suggested that having images of the sampling site before the start of the project would make it easier to find. The most frequently mentioned suggestion, reported by three volunteers, was to make efforts to reduce the amount of plastic used in the project. One volunteer suggested doing this by either “reusing sampling bottles/syringes or using non-plastic alternatives.” In the pre-sampling survey, four volunteers expressed an interest in learning about the results.
Comparison of wild mammals detected by citizen scientists and researchers
The Illumina MiSeq run yielded a total of 30,369,822 paired-end sequences that passed the quality filtering, across the four libraries and 341 samples (285 eDNA samples and 56 controls). We obtained a relatively equal sequencing depth across all four libraries, representing both researchers’ and citizen scientists’ eDNA samples (Supplemental File 9: Appendix 3; Supplemental File 10: Table S5). After bioinformatic analysis and subsequent quality filtering, the final dataset contained a total of 4,629,557 reads representing 21 wild mammal species, from five taxonomic orders (Figure 5; Supplemental File 10: Table S5; Artiodactyla, Carnivora, Eulipotyphla, Rodentia, and Lagomorpha) across all sampling locations by both volunteers and researchers. There were 15 species detected along the river Colne (C1–C15), 18 species detected along the river Blackwater (B6–B12) and 14 species detected inside and downstream from the beaver enclosure (B2, B4, B5 in Figure 5)
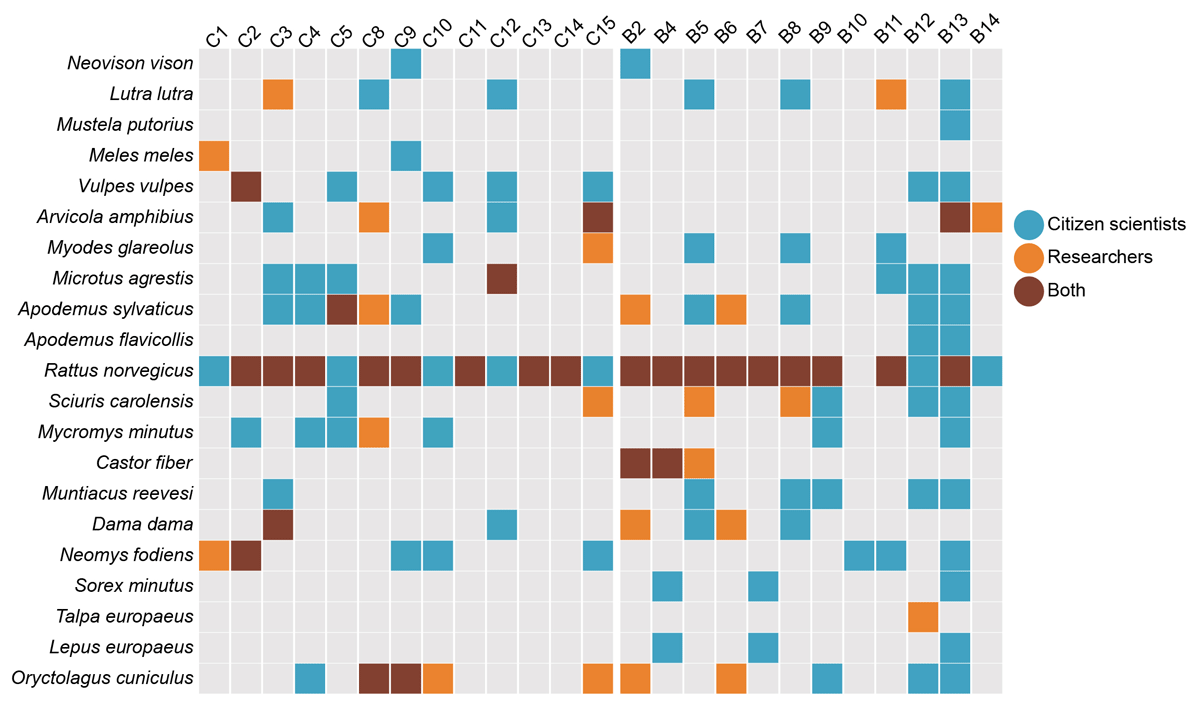
Figure 5
Mammal species detected using eDNA metabarcoding along the river Colne (C1–C15), the river Blackwater (B6–B12) and inside and downstream from the beaver enclosure (B2, B4, B5). Sites C6 and C7 were not included here because of discrepancies in the labelled sample bags.
The three researchers detected a total of 16 species across all sampling locations: 14 species along the river Colne, 13 species along the river Blackwater and 13 species inside and downstream from the beaver enclosure (Figure 5). The ten citizen scientists detected 20 species across all sampling locations, 15 species along the river Colne, 18 species along the river Blackwater, and 13 species inside and downstream from the beaver enclosure (Figure 5). Researchers detected one unique species that the citizen scientists did not, the European mole (Talpa europaea). The citizen scientists detected five species that the researchers did not, including yellow necked mouse (Apodemus flavicollis), European brown hare (Lepus europaeus), Eurasian pygmy shrew (Sorex minutus), European polecat (Mustela putorius) and American mink (Neovison vison).
Sampling site effort and species richness
The samples collected by the citizen scientists had a higher overall species richness when compared with those collected by the researchers (Figure 6a). There was a significant difference in overall richness (V = 18.5, p = 0.001; Wilcoxon signed-rank test) and in the number of sites at which a species occurred (V = 1.5, p-value = 0.001; Wilcoxon signed-rank test) between the citizen scientists and researchers’ data (Figure 6a, Supplemental File 11: Figure S3). The species accumulation curve for citizen scientists and researchers had a similar pattern that showed a slight increase initially and then reached a plateau after a few additional sampling sites (Figure 6b). These results confirm that more species were detected per sampling effort by the citizen scientists compared with the researcher sampling and that factors other than the number of sampling sites are likely contributing to the observed differences in species richness between citizen scientist and researcher data.
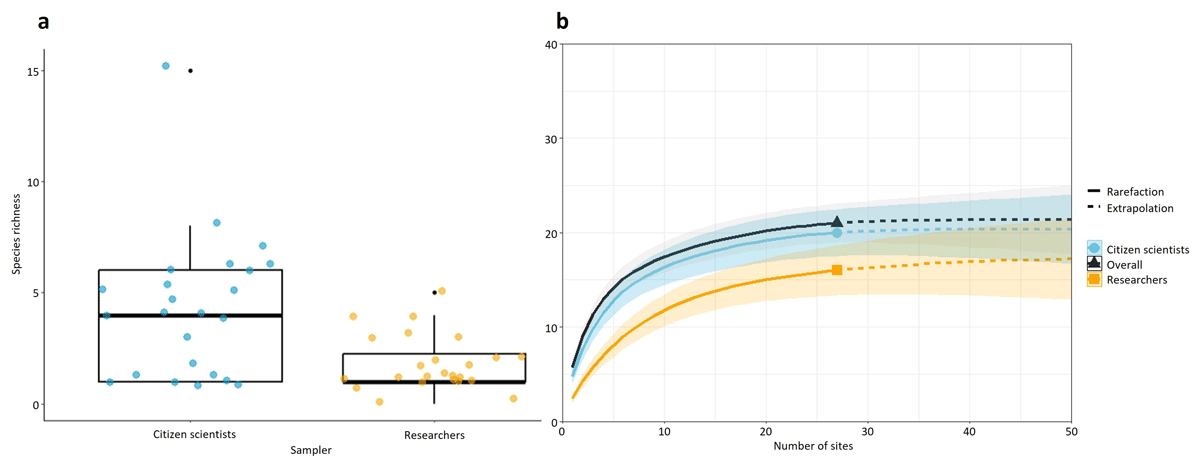
Figure 6
(a) Box plot of the overall species richness for the samples collected along the rivers Colne (C1–C15) and Blackwater (B2, B4–B14) by the citizen scientists and researchers. (b) Accumulation curve of species detected according to the number of sampled sites along the rivers Colne (C1–C15) and Blackwater (B2, B4–B14). Shaded area for each solid line shows the 95% confidence interval.
Discussion
In this case study, we highlight the importance of effective two-way communication and mutual benefits between citizen scientists and researchers, offering insights into volunteers’ motivations, science capital, and experiences in eDNA surveying. Moreover, our study facilitated a direct comparison between citizen scientists’ and researchers’ eDNA samples, providing evidence that supports the validation of CS eDNA surveys. While small sample size and low participant diversity limit the generalisability of the findings, this case study’s findings can serve as a foundation for future research with larger and more diverse citizen science populations and can inform improvements in eDNA training workshops.
Citizen scientists’ motivation and science capital
Volunteers in this project were driven by both intrinsic and extrinsic motivators, such as their desire to contribute to scientific knowledge, recognition of the value of their involvement, and their commitment to wildlife conservation. These motivators align with prior research, highlighting project goals and conservation interests as key factors influencing CS participation (Geoghegan et al. 2016), and are consistent with larger studies showing that older volunteers from white ethnic groups tend to exhibit motivations focused on values (West et al. 2021). As the participants in this study were already members and conservation volunteers for the EWT, their motivations are understandable. Their engagement with the EWT likely fostered a strong commitment to conservation goals and values, and their motivation was driven by a genuine passion for conservation and a desire to contribute meaningfully to these efforts. However, the number of participants in this case study is low, particularly for younger individuals, who might have different motivations or levels of engagement.
The high science capital scores in our study highlight the significance of perceiving science as relevant and valuable in everyday life, as well as exposure to science-related media. Interestingly, the presence of family members, friends, or peers with science-related occupations or qualifications was not prominent among our group of volunteers (Supplemental File 8: Figure S2; Kaakinen et al. 2023). CS projects often attract individuals with high science capital, indicating strong intrinsic motivation (Edwards et al. 2018; Cooper et al. 2021). However, this often leads to a potential ceiling effect in our data, a known issue in project evaluation (Cooper 2012). Our aim was to initially assess science capital to inform project design, including the complexity of knowledge and language for workshops and communications. This approach helped tailor project materials and activities to participants’ existing understanding and engagement with science.
Citizen scientists’ experiences
We gained insights into the positive aspects and challenges involved in eDNA surveying by inviting the volunteers to evaluate project components (Robinson et al. 2018). The volunteers had an overall positive experience and remained motivated to participate in eDNA sampling, finding joy in engaging with nature, working outdoors, exploring new locations, and communicating about science (Figure 3). Additionally, volunteers gained new skills and knowledge which sparked thought-provoking questions about eDNA metabarcoding (Figure 3). This shows the potential for eDNA CS projects to enhance volunteers’ understanding of eDNA and biodiversity as the method becomes more widely used. The volunteers expressed genuine concerns about plastic waste in eDNA sampling, despite understanding its necessity to prevent cross-contamination. Their feedback highlights the need to explore alternative methods, such as the direct immersion of filters into the water system for eDNA capture (Bessey et al. 2021). Additionally, volunteers encountered challenges during data collection but created innovative sampling solutions, leading to a rewarding experience (Figure 5a,b). Continued communication and integrating volunteer perspectives enriched the project and proved to be crucial in our research, enabling us to address the challenges encountered during eDNA sampling. For example, the EWT staff proactively contacted landowners in advance to obtain survey permissions for future projects.
Comparison of species detections
Validating CS-collected data is crucial for its usability (Freitag et al. 2016), particularly in the expanding field of eDNA. We directly compared the species detected between sites sampled by both researchers and volunteers, revealing that citizen scientists detected significantly more mammals (Figure 5). Both researchers and citizen scientists employed almost identical sampling methods detailed in our training workshop. Citizen scientists did not collect field controls as is generally typical in CS eDNA studies (e.g., Clarke et al. 2023; Suzuki-Ohno et al. 2023) as there were concerns about adding additional steps to their sampling protocols. However, with several volunteers visiting multiple sites (even if on separate days), the collection and filtering of a certain amount of field controls would need implementation in future CS eDNA surveying projects of this type. With that being said, citizen scientists still received extensive training and support through the interactive seminar and workshop (Pocock et al. 2014), facilitating the collection of high-quality eDNA samples.
Researchers completed their sampling in three days, while citizen scientists collected samples over two weeks, sometimes sampling the same site at different times on the same day (Supplemental File 12: Table S6). This underscores the importance of accounting for temporal variations in eDNA sampling. Our results indicate that terrestrial and semi-aquatic mammal eDNA might be susceptible to local shifts in detectability in lotic systems over relatively short periods of time (Croose et al. 2023). This could be due to daily changes in species’ movement patterns and the rate they release DNA into the environment, or short-term environmental conditions such as rainfall, which influences water flow and runoff from terrestrial ecosystems, leading to increased detections (Croose et al. 2023). These factors could contribute to the differences observed in species detections, underscoring that a single visit to a site may not fully represent the mammal community present at any given moment (Croose et al. 2023). This highlights the dynamic nature of eDNA-based ecological assessments and the importance for future research to focus on frequent and systematic sampling to capture these temporal variations accurately.
Several volunteers were long-term members of the EWT, and brought extensive experience in monitoring mammals along these rivers. At the coordinated points, volunteers exercised autonomy in selecting sampling locations they were familiar with and could access easily. Their local knowledge and familiarity with the sampling area enriched the project by offering valuable insights that complemented the specified sampling coordinates (Danielsen et al. 2018). Moreover, the engagement of local volunteers in data collection saves on significant fieldwork costs (e.g., non-local researchers would likely need to hire a vehicle and pay for accommodation during sample collection), enabling researchers to allocate resources more efficiently and potentially expand the scope of their research.
Project outcomes
The volunteers expressed interest in learning about the eDNA results, driven by their desire to understand the project outcomes from their participation (Figure 7a–d). Sharing the project results with the volunteers and the EWT was an important part of our study, as it not only conveyed our appreciation and gratitude for their contributions but also served as an educational opportunity and deepened their understanding of conservation efforts and the scientific process. As a result, the volunteers developed a heightened appreciation for eDNA surveys and found the process of species identification interesting as they discovered the diverse range of mammals they had detected. We consider it highly important for researchers to actively engage in the process of science dissemination, including training and communicating with volunteers (Robinson et al. 2018).
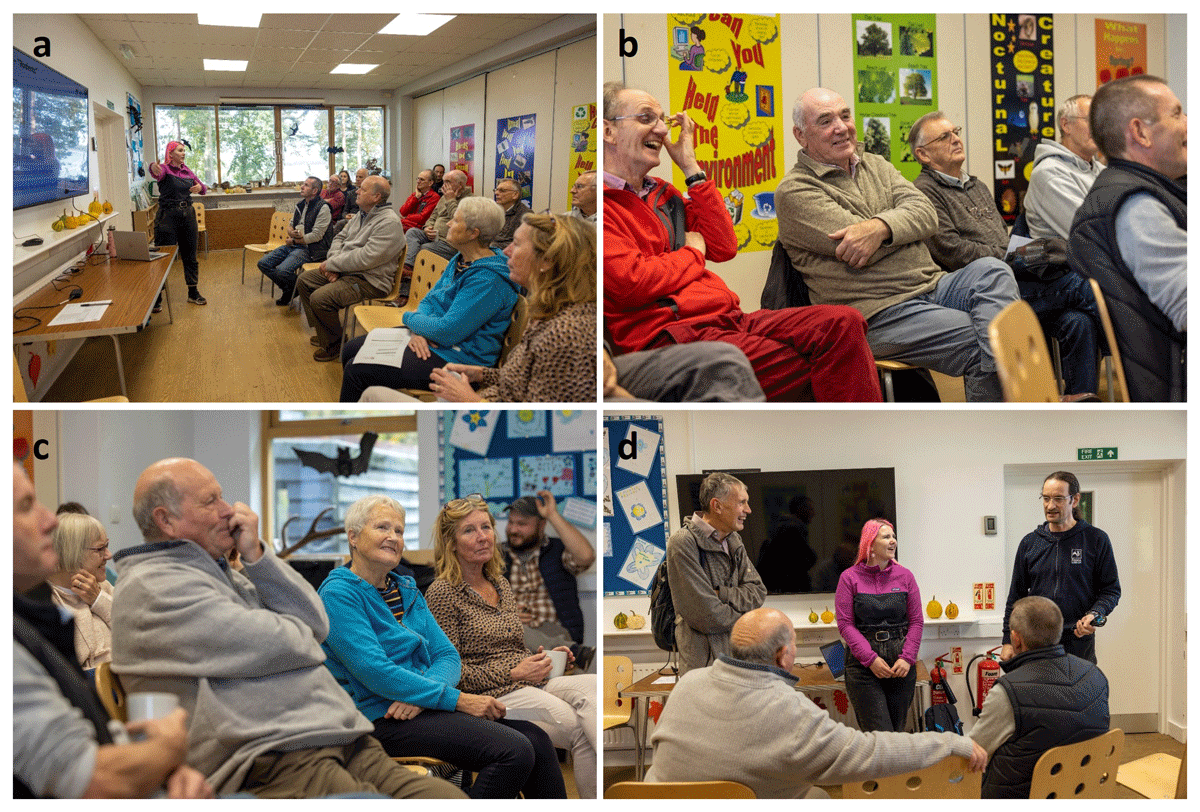
Figure 7
Citizen scientists, researchers, and the Essex Wildlife Trust (EWT) collaborating during the results workshop. Photo credit: Laura Bennetto (bennettophotography.co.uk).
Conclusion and Future Directions
CS eDNA projects support conservation efforts and provide valuable learning experiences for everyone involved. We trained ten citizen scientists to collect eDNA samples to detect mammalian communities, highlighting benefits for both volunteers and researchers. As described in this case study, our experience demonstrated that continued communication, thorough training, and robust support systems are key factors for ensuring volunteer engagement and success in sample collection. Although this study involved a small group of volunteers, the methods developed here can be adapted and scaled to engage larger groups by leveraging similar training workshops and collaborative feedback sessions. However, scaling up to a nationwide programme would require additional resources for volunteer management and logistical coordination to ensure the quality of training workshops. Furthermore, addressing the potential variation in volunteer motivations would require careful planning to maintain high levels of participant engagement and satisfaction.
While minimal training can enable volunteers to collect high-quality samples (Biggs et al. 2015), it often includes individuals with higher science capital (Edwards et al. 2018). A larger volunteer group, including individuals from diverse cultural, educational, and socio-economic backgrounds, could respond to CS projects differently and a multifaceted approach will be required to address unique needs, motivations, and ways of participating. For instance, individuals with lower science capital may require more accessible training materials and greater support to feel confident in participating, while volunteers with higher science capital may engage with the project more independently (Edwards et al. 2018). Additionally, cultural differences might shape participants’ understanding and attitudes towards conservation, potentially influencing their level of engagement and the types of conservation actions they prioritise. Understanding these differences is essential for ensuring that CS initiatives are truly inclusive and can attract volunteers from a wide range of communities. Understanding the motivations of a range of individuals in CS is crucial for creating inclusive, meaningful, and sustainable initiatives (Cooper et al. 2021). Future research should aim to engage volunteers from various backgrounds to better understand their motivations, ultimately enhancing the quality and impact of CS research while fostering more equitable and sustainable scientific practices.
Feedback from this study suggests areas for improvement, such as reducing plastic waste, offering various glove sizes, and providing detailed site information. Addressing these issues will enrich participant experiences and strengthen the scientific and inclusive nature of eDNA initiatives, supporting long-term engagement and collaboration in CS (Haklay et al. 2023). This creates initiatives that are accessible, inclusive, and welcoming to individuals with diverse backgrounds and is essential for fostering long-term participation, collaboration, and knowledge-sharing in CS-driven eDNA surveys across larger geographical scales.
Data Accessibility Statement
Raw sequence data will be made available in FigShare and bioinformatic steps and scripts will be made available in GitHub upon publication.
Supplementary Files
The supplementary files for this article can be found as follows:
Supplemental File 1: Appendix 1
Consent form for citizen scientists. DOI: https://doi.org/10.5334/cstp.803.s1
Supplemental File 2: Table S1
Questions asked in the pre-sampling survey, the type of questions, and possible answers. DOI: https://doi.org/10.5334/cstp.803.s2
Supplemental File 3: Table S2
Definition of each motivational category in the citizen science motivational scale and the statements used for the pre-sampling survey in this study and reference. Motivational categories were based on those used by West et al. (2021). DOI: https://doi.org/10.5334/cstp.803.s3
Supplemental File 4: Table S3
The eight dimensions of science capital, definition and the question asked in the survey (Archer et al. 2015). DOI: https://doi.org/10.5334/cstp.803.s4
Supplemental File 5: Appendix 2
DNA extraction and metabarcoding. DOI: https://doi.org/10.5334/cstp.803.s5
Supplemental File 6: Table S4
Questions asked in the post-sampling survey, the type of questions, and possible answers. DOI: https://doi.org/10.5334/cstp.803.s6
Supplemental File 7: Figure S1
Responses to Likert questions plotted as diverging stacked bar chart presenting the citizen scientists’ rating of the different motivational statements. DOI: https://doi.org/10.5334/cstp.803.s7
Supplemental File 8: Figure S2
Citizen scientists’ responses for each of the science capital categories. DOI: https://doi.org/10.5334/cstp.803.s8
Supplemental File 9: Appendix 3
Sequencing outputs and controls. DOI: https://doi.org/10.5334/cstp.803.s9
Supplemental File 10: Table S5
Number of reads retained after each filtering step (after bioinformatics) to account for tag-switching, removing non-target MOTUs, and MOTUs/reads originating from putative sequencing errors or contamination. DOI: https://doi.org/10.5334/cstp.803.s10
Supplemental File 11: Figure S3
The number of eDNA sample sites each species was detected across 22 sites, by citizen scientists and researchers along the river Colne C1–C15, river Blackwater B4–B12, and inside and downstream from the Beaver enclosure. DOI: https://doi.org/10.5334/cstp.803.s11
Supplemental File 12: Table S6
The date each site was sampled by researchers and citizen scientists, and the number of species detected at each site. DOI: https://doi.org/10.5334/cstp.803.s12
Ethics and Consent
Our study received ethical approval (Ref. 210) from the University of Salford Ethics Committee on 27th October 2021 and was conducted in accordance with the University’s Governance Framework. Volunteers gave informed consent through a signed form (Appendix 1). Survey responses were voluntary and anonymous, with no compulsory questions.
Acknowledgements
We sincerely thank the volunteers whose time, effort, and expertise made this study possible. We thank Laura Bennetto (Bennetto Photography) and Matthew Burrows (Engaging Environments) for capturing the workshops.
Competing Interests
The authors have no competing interests to declare.
Author Contributions
HAB, NGS, RR, EO, and ADM conceived and designed the project. HAB, ES, JMJ, DT, and NS performed the eDNA sampling. HAB and ES performed the laboratory work, and HAB carried out the bioinformatics and analyses of the eDNA and questionnaire data. HAB wrote the manuscript and all authors read and commented on the manuscript.