
Introduction
Studying the impact of citizen science experiences on the millions of volunteers who participate in these projects every year is an emerging area of inquiry relevant to research, evaluation, and assessment (Jordan et al. 2015). And rightly so; these studies are of significant value for both specific projects and the field as a whole, and have advanced our understanding of the broader societal value of citizen science (Davis et al. 2022).
Many quantitative studies of citizen science volunteers are conducted using pre-post survey methodology (Aristeidou and Herodotou 2020) designed to evaluate a variety of potential learning outcomes (Peter et al. 2021). That is, identical surveys are administered at the start of a volunteer’s engagement in a project and again after the volunteer has participated for a set amount of time. This method allows researchers to assess potential changes in constructs of interest (e.g., science literacy, curiosity) and to model these changes as a consequence of participation. The most robust quantitative evaluations (e.g., DEVISE; Phillips et al. 2018) use validated survey instruments to ensure that the items being used are reliable measures of the desired construct. Some studies of citizen science volunteers also use qualitative methods such as interviews and focus groups (Aristeidou and Herodotou 2020).
Citizen science research and evaluation studies have advanced our understanding of citizen science; however, they also have revealed key challenges associated with traditional quantitative survey methods. First, researchers have not yet begun to seriously consider how to bring citizen science evaluation into alignment with the broader philosophy of citizen science—the philosophy that volunteers can contribute to and be involved in a rewarding process of scientific inquiry (Robinson et al. 2018). While citizen science projects involve volunteers in the process of science—ideally, explaining the purpose of volunteer tasks and sharing findings resulting from volunteer efforts—in our experience, this mindset rarely extends to evaluation. This is a missed opportunity. Citizen science volunteer assessments are also science, and volunteers can be involved in that process. Rather than existing outside the purview of citizen science, evaluation could be an integral part of the participatory process (Becker-Klein et al. 2023) that embraces participatory principles such as reciprocity and direct feedback via reportbacks (communications to volunteers sharing and explaining project findings)—something most survey instruments don’t provide. This level of involvement would tap into existing motivations of citizen science volunteers to contribute to science and might even generate an esprit de corps that increases volunteers’ commitment to completing evaluations (Staus et al. 2021).
Beyond its participatory shortcomings, a second problem with traditional quantitative surveying is poor response rates, which often range from 2 to 15% across a variety of citizen science domains (Raddick et al. 2013; Masters et al. 2016; Church et al. 2018; Larson et al. 2020). Surveys that are long or are perceived as irrelevant to respondents can lead to low response rates (Fan and Yan 2010). One additional factor that might limit response rates is that surveys simply aren’t very interesting to complete, with many relying on unvarying rows of Likert-style bubble sheets, whose utility and purpose are rarely explained clearly to participants (Harms et al. 2015).
Poor response rates limit the statistical power of quantitative analyses. They also result in respondent samples that may be poorly representative of the larger volunteer population due to self-selection bias (Groves et al. 2001). For instance, one study found that highly engaged citizen scientists on Zooniverse were seven times more likely to take a survey than less engaged users (Masters et al. 2016). These biases may be exacerbated when analyses require participants to take follow-up surveys (post-tests).
A third problem with traditional pre-post survey evaluations is that they can be a coarse metric for assessing learning if they incorporate only two time points (i.e., one pre-test and one post-test). Learning as a result of informal science experiences (i.e., experiences outside of formal classroom settings) often occurs incrementally over long periods (Staus et al. 2021). A longitudinal cohort-based study of citizen scientists—if it avoided survey fatigue and attrition—would provide a richer, finer-scale measure of learning and would be more flexible in tracking the heterogeneous dynamics of citizen scientists.
Some of the challenges associated with citizen science evaluation may be amplified on multi-project platforms such as CitSci.org, Zooniverse, and SciStarter.org— widely used databases of citizen science projects that allow volunteers to discover and join projects of interest and track their participation across projects. On such platforms, volunteers may feel a stronger sense of connection or loyalty to the individual projects they contribute to than to the platform itself (which may be perceived more as a utility or aggregator than a community in its own right). As a result, volunteers may be more responsive to evaluation requests from project leaders than to those initiated by a platform. Indeed, in our own experience conducting evaluations on SciStarter, emailed survey response rates have ranged from 5 to 10% (Allf et al. 2022), and we observed approximately 81% attrition between a pre-test and post-test survey even after multiple follow-up emails and offering financial incentives such as gift cards (B. Allf, L. Larson, and C. Cooper, unpublished data).
At the same time, platform-based evaluation offers distinct advantages. In particular, because volunteers engage with many different projects, evaluations conducted at the platform level can provide a more generalized understanding of learning outcomes than findings tied to a single project. Creating an evaluation that garners an enthusiastic response on a platform could facilitate a more robust understanding of learning through citizen science.
Herein, we describe our attempt to create an evaluation tool for the platform SciStarter that would address a persistent challenge we have encountered in evaluating SciStarter users: low response rates. Our approach to this challenge centered on making survey-based evaluations more interesting and motivating for platform users to complete. In addition, we aimed to make this tool better aligned with the participatory ethos of citizen science, and capable of measuring long-term, longitudinal changes in volunteer learning. Through an iterative process that we outline below, this evaluation tool eventually took the form of a citizen science project embedded in the SciStarter multi-project framework, using the same infrastructure as conventional projects hosted on SciStarter (project page, volunteer protocol, data collection process, etc.). That is, we made assessment itself a form of scientific inquiry: a citizen science project about citizen science that gathered data about volunteer learning just as conventional citizen science projects collect data about wildlife or pollution.
We named this project “SciQuest.” Volunteers participate in SciQuest by taking interactive surveys adapted from existing validated instruments. We focused specifically on learning related to pro-environmental attitudes and behaviors, a common focus of citizen science evaluation, though the project is designed to add new surveys over time that assess other dimensions of learning. Our goal in designing SciQuest as a citizen science project was to make it more participatory than conventional, emailed surveys. In addition, by maintaining the project on a dedicated, accessible project page we hoped to facilitate sustained, longitudinal evaluation, with volunteers completing surveys repeatedly over the course of years as they explore the larger ecosystem of citizen science projects on SciStarter (Allf et al. 2022).
Our primary goal for this paper is to outline our approach to developing a more creative and engaging citizen science evaluation tool on SciStarter that still provides scientifically useful evaluation data. Some of the dimensions of that approach are unlikely to be broadly adaptable outside the context of platforms (such as creating an entire evaluation-based citizen science project), while other dimensions (e.g., focusing on the volunteer experience and designing for “fun”) may have more general applicability for evaluators of standalone citizen science projects, and indeed for citizen science projects themselves (see Discussion).
A Theory of Fun
Early in the development of SciQuest, we hypothesized that one way to increase volunteer motivation to complete surveys repeatedly over the course of years would be to make SciQuest surveys more fun to complete than conventional bubble sheet-style evaluations. There is abundant literature showing that activities that people identify as “fun” foster high rates of participation. For instance, having fun while doing a learning activity is linked to increased motivation to continue with that activity (Lucardie 2014), and having a fun workplace environment is linked to improved job commitment and employee retention (McDowell 2004). Thus, developing evidence-based strategies for making SciQuest fun might be one avenue through which to boost response rates and retention. In addition, given that “having fun” is an important intrinsic motivation for participating in citizen science (Allf 2023), making surveys fun could be one way to better align evaluation with citizen science principles and participant motivations.
A number of fields have explored the concept of fun, both as a theoretical construct (e.g., psychology; McManus and Furnham 2010) and as a practical design goal (e.g., game design; Hunicke et al. 2004). In addition, some researchers have attempted to make surveys more fun through gamification — for instance, by incorporating game-like visual elements or mechanics into traditional survey formats (Harms et al., 2015). However, as yet, there is no well-established, “theory of fun,” and indeed much of the fun literature is isolated in disciplinary silos, while the literature on gamified surveys often treats gamification as synonymous with fun, when fun may be a broader and more nuanced concept. Thus, we aimed to construct an evidence-based characterization of fun activities drawing from multidisciplinary insights that could center the concept of fun explicitly and holistically and inform the design of fun surveys to assess citizen science learning outcomes.
Specifically, we conducted a literature review using the Web of Science database with the search term “fun definition,” which yielded 219 results. We screened the titles and abstracts of these initial results and retained articles that met our inclusion criteria: (1) the study defined or characterized fun activities, and (2) it employed either empirical methods or a formal literature review. For those articles that met these criteria, we conducted backwards and forwards citation tracing to identify additional relevant studies. This step was designed to ensure greater depth and coverage, given the diffuse and interdisciplinary usage of the term “fun.” Between the initial search and the citation tracing, we reviewed 132 studies in depth, of which 20 met our inclusion criteria and were retained for full analysis (Supplemental File 1: Supplemental Table 1). These articles spanned a range of domains, including video game design, education, museum studies, and tourism marketing. We analyzed the retained articles using the constant comparative method (Fram 2013) to identify themes that repeatedly emerged across articles. From this analysis, we identified six emergent themes that characterize fun, which we have named: autonomy, social connection, playfulness, challenge, transport, and curiosity (Table 1). Activities that are fun tend to involve elements from one or more of these themes.
Table 1
Emergent themes that characterize fun activities, derived from a literature review, and ideas for implementing the themes into SciQuest. These themes relate to established factors from three bodies of existing theory: Self-Determination Theory (SDT), Gamification (G), and Flow (F).
| THEME | DEFINITION | IDEAS FOR IMPLEMENTING THEME | RELATED FACTORS |
|---|---|---|---|
| Autonomy | Opportunity for choice, freedom, control, exploration, and expression | Ability to provide feedback, answer in own words; creative response options for answering through drawing/storytelling; free choice in pursuing surveys of interest; opportunity to shape the design of surveys/themes | Autonomy (SDT); Control (G) |
| Social connection | Opportunity to interact with others, build community, cooperate | Forum for volunteers to communicate with one another and with project owners; ability to compare survey responses to others; opportunities for recognition | Relatedness (SDT); Interpersonal motivations (G) |
| Playfulness | Opportunity for reduction of hierarchies, humor, risk-taking, loss of inhibition, silliness or spontaneity | Incorporate humor into survey design; make reportbacks relatable, non-judgmental, with a relaxed tone; use playful visual designs | Some overlap with autonomy (SDT); Loss of self- consciousness (F) |
| Challenge | Opportunity to feel empowered to achieve goals by matching skills to appropriate difficulty level; opportunity to show competence, compete, achieve | Provide performance feedback; make project goal-oriented using task-completion visualizations; use easy-to-understand language; opportunity to learn something new or test knowledge; report changes in survey responses or participation patterns over time to demonstrate growth/change | Competence (SDT); Challenge (G); Challenge/control (F) |
| Transport | Opportunity to experience immersive emotion, make-believe, or use imagination | Utilize storytelling, imagery; engage participant emotions | Fantasy (G); Distortion of temporal experience (F) |
| Curiosity | Opportunity to feel perceptual and cognitive stimulation (e.g., surprise, interest in learning more) | Utilize creative audiovisual elements; utilize progressive disclosure or incomplete information to encourage completion; reference timely/newsy topics | Curiosity (G); Intrinsic reward (F) |
Autonomy describes features of activities that lead participants to experience a sense of freedom, exploration, and expression. For instance, a study of children enrolled in physical education courses found that a common impediment to having fun was feeling a lack of choice in the activities students wanted to do (Dismore and Bailey 2011). Social connection refers to the opportunity to relate to and interact with other people. When 201 people were asked to describe a fun activity, for instance, just four individuals told a story that involved being alone (Fincham 2016). Playfulness refers to activities with an element of silliness or mischief such as humor, risk-taking, loss of inhibition, or spontaneity. For example, one study revealed that sharing jokes and acting silly were core elements of workplace fun (Cook 2009). Challenge describes activities with a clear goal, which participants can achieve through developing skills. For instance, a study of youth sports participants found that two primary predictors of having fun were how well one played and how challenging the opposing team was (Wankel and Sefton 1989). Transport encompasses elements of imagination and emotion in an activity. Tasci and Ko (2015), for instance, found that fun activities tend to make participants feel emotionally involved. Finally, curiosity refers to activities that are stimulating, whether perceptually stimulating via colors or audiovisual effects, or cognitively stimulating such as activities that are surprising or that invite closer inspection. Poris (2005), for instance, found that a key theme of fun activities was being surprised by something or trying something new.
Although our review was inductive, the themes that emerged from the fun literature had significant overlap with three existing bodies of theory: self-determination theory (SDT) (Deci and Ryan 2012), gamification (Malone and Lepper 1987), and flow (Csikszentmihalyi 2013). That is, fun activities share characteristics with intrinsically motivating activities, gamified activities and activities that lead to a feeling of flow—core ideas from these frameworks (Table 1). Indeed, at least one of these theories was explicitly referenced by 16 of the 20 studies in our review. While no single theory fully encompasses all six fun dimensions identified in our synthesis, we drew on insights from these frameworks to complement our use of the six emergent themes in designing fun surveys, given that they are well-established and validated across domains. For example, gamification research informed some of our choices in designing for fantasy (Transport) and feedback mechanisms (Challenge).
Building a Fun Evaluation
Given that the majority of projects on SciStarter are focused on the environment (Allf et al. 2022), and that measuring learning related to nature and the environment is a common focus of citizen science participant surveys, we decided to focus the initial SciQuest surveys on environmental constructs, specifically validated instruments measuring: environmental concern, connection to nature, wildlife valuation, nature interest/affinity, and pro-environmental behavior (Kals, Schumacher and Montada 1999; Cheng and Monroe 2012; Larson et al. 2015; Phillips et al. 2015; Imbault Shore and Kuperman 2018; Cruz and Manata 2020; Manfredo et al. 2020; Kleespies et al. 2021).
We used the six fun themes identified in our review as guiding heuristics for adapting existing instruments measuring these environmental constructs into a series of redesigned fun surveys (Table 1). Some of these themes were more readily implemented than others, and we acknowledge that the success of our implementation likely varied across themes. In some cases, our design decisions were directly informed by specific strategies identified in the literature. For example, Perry (2012), one of the 20 retained studies in our literature review, described the use of progressive disclosure to foster curiosity-related fun in museum exhibit materials. We drew on this idea directly by incorporating slider-style survey questions that gradually reveal new information to respondents. In other cases, our implementation was more exploratory, inspired by the broader definitions of the themes rather than by specific prior applications. For instance, we assigned participants to playful persona categories based on their responses—an approach intended to evoke playfulness, though we did not find this exact strategy in the literature we reviewed. Across all six themes, our goal was to bridge conceptual insights from diverse literatures with practical design choices that could enhance the participant experience. We briefly outline these design choices below for each fun theme.
To provide opportunities for autonomy, we enabled SciQuesters to respond in their own words to certain survey queries or share anecdotes. We made these questions optional, to allow participants who wanted to express themselves to do so, without encumbering participants who might experience a longer writing task as burdensome. We also allowed participants some degree of free choice in which surveys they pursued, and asked SciQuesters for feedback, within the reportbacks, on what topics they were interested in and would like to focus on in future surveys.
To foster opportunities for social connection, we created a feedback section on the SciQuest homepage where volunteers could post public comments about SciQuest. We also provided mini-reportbacks within the surveys showing how a respondent’s answers compare with the answers of other SciQuest volunteers (Figure 1). Although this feature is a rather impersonal means of connecting with others, it at least provides a way for volunteers to better understand their relationship to others within a collective, which may inspire them to feel more connected to the broader community of contributors (Baumeier 2020).
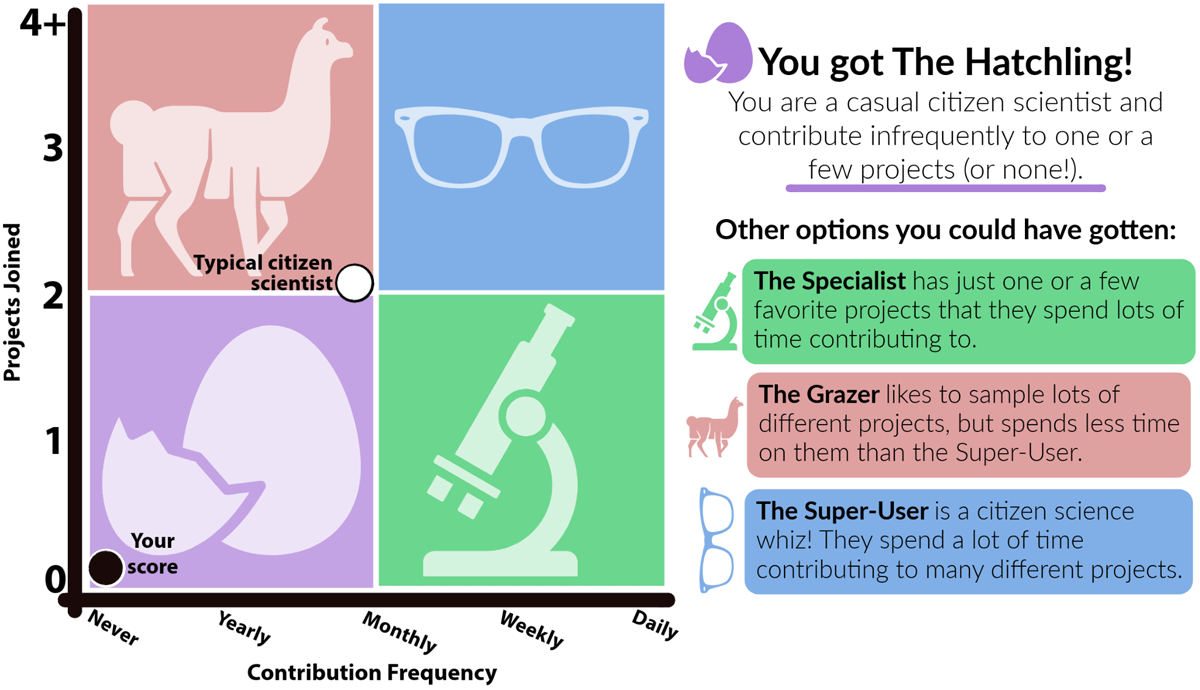
Figure 1
Example of a playful mini-reportback element within the SciQuest Journey Prep survey, featuring fun design elements such as playful graphics and tone (playfulness), a means of relating to other volunteers (social connection) and a means of engaging in self-assessment (challenge).
Playfulness was the most difficult theme to incorporate into SciQuest, given the tension between a task feeling light-hearted and it seeming fatuous, which is an important consideration given that SciQuest is meant to be (and understood by volunteers to be) a serious tool for data collection. Still, we attempted to incorporate some elements of humor into question design, such as assigning respondents to playful category designations based on their responses (Figure 1). We also attempted to use a tone in reportbacks that was conversational, non-didactic, and non-judgmental, particularly in relation to people with low scores on outcomes of interest.
For challenge, we tried to make SciQuest goal-oriented by including personalized progress visualizations in reportbacks sent to volunteers after they completed surveys, with checkmarks superimposed over icons representing each of the surveys participants had completed. These reportbacks also explained how volunteer responses have changed (or may change) over time, to foreground how SciQuest tracks personal growth (e.g., changes in nature-related values). In addition, we attempted to recognize participants and promote their contributions by quoting their qualitative responses (anonymously) in sections of the reportback emphasizing the diverse perspectives of SciQuest volunteers. Lastly, we designed reportbacks to share broader, lateral knowledge about each survey’s domain of focus—such as a reportback that explained how a question on the Environment survey was inspired by a US Supreme Court case—in order to make the reportbacks themselves a kind of learning experience that empowered volunteers to learn something new.
To incorporate the transport theme, we designed survey questions that drew on narratives, characters, and/or emotion. For instance, we assessed affinity for nature using questions that asked respondents how a photograph of a natural scene or wild organism made them feel (Figure 2a). In another question set, we assessed respondents’ anthropocentrism by inviting them to respond to a fictional narrative in which a development is planned that could impact a rare species (Figure 2b).
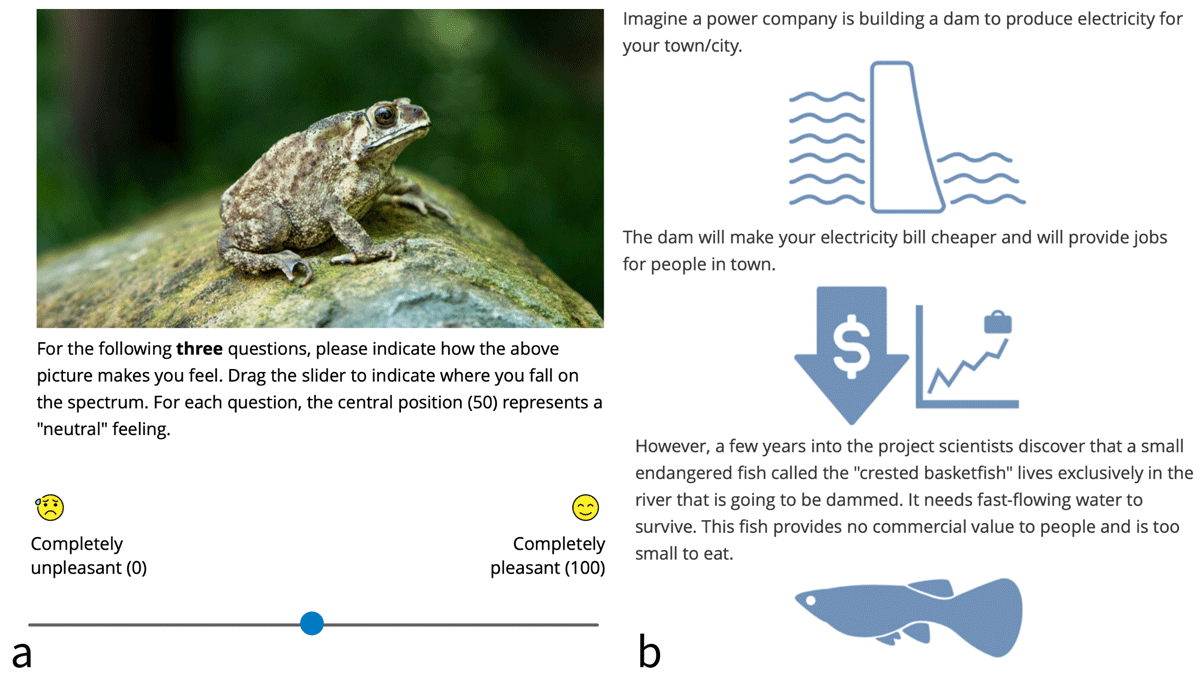
Figure 2
Examples of SciQuest survey questions that incorporate elements of transport using (a) emotion and (b) narrative.
Finally, to design for curiosity we included visual elements in nearly every survey question, particularly slider-style questions, which progressively reveal different graphics as respondents move the slider, as well as questions that require tactile manipulation of objects (Figure 3). We also used reportbacks to relate findings from the surveys to potentially relevant current events when such overlap existed.

Figure 3
Examples of survey questions that engage curiosity through graphics and progressive disclosure (respondents move the slider to read descriptions of three different avatars before answering the question).
Validating the Fun Evaluation
After drafting our fun surveys, we tested their utility using a group of paid survey-takers from Qualtrics (Qualtrics “Panelists”) who also completed the conventional survey instruments they were derived from. Our goal was not to robustly validate new instruments with high fidelity to the original instruments; rather, the goal was to establish that the overall modifications resulted in instruments that were still scientifically useful. Similar online panel survey approaches are becoming increasingly popular in social science research (Boas, Christenson, and Glick 2020). We compared Panelist responses to the fun and conventional versions of the same construct by averaging together items within a given construct for both the fun and conventional instruments and evaluating correlation between these means using a two-way random effects model of intraclass correlation coefficients (ICC; R package “irr” [Gamer et al. 2019; R Core Team 2024]), an established method for validating agreement between raters (Shrout and Fleiss 1979). We also analyzed Panelists’ responses to questions comparing their experience taking the fun and conventional survey versions.
In May 2021, 440 Panelists completed the survey. We discarded 197 low-quality responses that were clearly rushed (> 95th percentile response speed for > 10% of question sets) for a final sample of 243 responses. Respondents included 160 women and 83 men, and 88% of respondents were white non-Hispanic, 4% were Black, 4% were Hispanic of any race, and the remaining 4% of respondents identified with another race/ethnicity. The mean respondent was 60 years old, and 40% of respondents’ highest level of education was a high school diploma. Respondents were evenly split between conservative-leaning, liberal-leaning, and independent. Approximately 16% of respondents worked in STEM fields, and 8% of respondents had prior experience with citizen science. All respondents lived in the United States. Qualtrics Panelists were similar to SciStarter users in terms of race and gender; however, typical SciStarter users are younger, more highly educated, and more likely to work in STEM (Allf et al. 2022).
Details about the fun instruments and the conventional instruments they were derived from are described in Supplemental File 2: Supplemental Table 2. ICC statistics indicated that most of the fun instruments were reliable measures of the validated instruments, with ICC scores falling within the 0.50–0.75 range indicating “moderate” reliability (Table 2; Koo and Li 2016). Three fun instruments had ICCs at a level indicating “good” reliability (0.75–0.90). Fun items that performed poorly were dropped from SciQuest except for the Ecocentrism Slider, which approached the 0.50 threshold (ICC = 0.47), and the Food Behavior Graphic, which was clearly unreliable (ICC = –0.20). We kept this measure of conservation behavior because, although it was not an effective predictor of conservation behavior as measured by established instruments, reducing meat consumption is one of a few individual consumer choices that is known to have a significant impact on reducing carbon emissions, unlike other more commonly measured conservation behaviors of relatively low climate value (recycling pastic, turning off lights, etc.; Wynes and Nicholas 2017). The average respondent took about 11 minutes to complete the fun survey and six minutes to complete the boring survey.
Table 2
Correlations between validated survey instruments and modified versions of these instruments used to measure environment-related social science constructs in SciQuest. Each Qualtrics Panelist completed both instruments.
| SCIQUEST INSTRUMENT | VALIDATED INSTRUMENT | R | ICC |
|---|---|---|---|
| Environmental concern | |||
| Affective environmental concern | Environmental concern | 0.63 | 0.75 |
| Connection to nature | |||
| Distance from nature | Illustrated inclusion of nature in self | 0.50 | 0.65 |
| Wildlife valuation | |||
| Ecocentrism slider | Wildlife valuation orientation | 0.36 | 0.47 |
| Basketfish narrative | Wildlife valuation orientation | 0.47 | 0.52 |
| Basketfish slider | Wildlife valuation orientation | 0.55 | 0.61 |
| Interest in nature/nature affinity | |||
| This or that preference test | Interest in nature/nature affinity | 0.45 | 0.61 |
| Cartoon character nature interest | Interest in nature/nature affinity | 0.65 | 0.77 |
| Nature photo feelings | Interest in nature/nature affinity | 0.43 | 0.60 |
| Pro-environmental behavior: conservation behavior | |||
| Drag and drop conservation | Conservation behavior | 0.45 | 0.55 |
| Food behavior graphics | Conservation behavior | –0.09 | –0.20 |
| Consumer choice graphics | Conservation behavior | 0.38 | 0.50 |
| Pro-environmental behavior: land stewardship | |||
| Land stewardship graphics | Land stewardship | 0.67 | 0.80 |
| Pro-environmental behavior: social environmentalism | |||
| Avatar social environmentalism slider | Social environmentalism | 0.46 | 0.60 |
| Pro-environmental behavior: environmental citizenship | |||
| Avatar environmental citizenship sliders | Environmental citizenship | 0.49 | 0.65 |
[i] Note: In cases where the scale differed between the validated instrument and the SciQuest version, scales were standardized before computing ICCs. See Supplemental Table 2 for details about each instrument; R, Pearson correlation coefficient; ICC, intraclass correlation coefficient; n = 243 survey-takers.
When asked whether they would rather take a survey similar to the fun survey instruments or the conventional survey instruments, 67% of respondents indicated they had no preference, 21% preferred the fun instruments, and 12% preferred the conventional instruments. When asked which survey they enjoyed more, 53% of respondents had no preference, 30% enjoyed the fun instruments more, and 17% enjoyed the conventional instruments more. Among those respondents with a preference, according to both questions, significantly more respondents preferred/enjoyed the fun instruments than would be expected by chance (binomial test, p < 0.01).
Releasing the Fun Evaluation
Having confirmed that SciQuest surveys were reliable and preferred to conventional surveys, we next released finalized versions of the SciQuest surveys onto SciStarter (Supplemental File 3: SciQuest Video), as a series of separate survey “modules.” Specifically, we made a landing page on SciStarter (https://scistarter.org/SciQuest) where volunteers could read about the project, watch a video introducing them to SciQuest’s goals (e.g., “While we know how important members of the public are to science, we know surprisingly little about what it means for you, the participants in these projects. That’s why we started SciQuest, a citizen science project about citizen science…”), and click graphics to complete different surveys evaluating the different environmental constructs (Figure 4). We used an API interface between Qualtrics and SciStarter to identify unique SciQuest participants and track which surveys a given participant had completed. We promoted SciQuest to SciStarter users between March 2021 and March 2023. Starting in May 2021, SciQuest was one of three projects featured in emails welcoming new users to SciStarter. SciQuest was also featured on and/or promoted to various SciStarter volunteer hubs (e.g., university, church, and corporate volunteer groups).
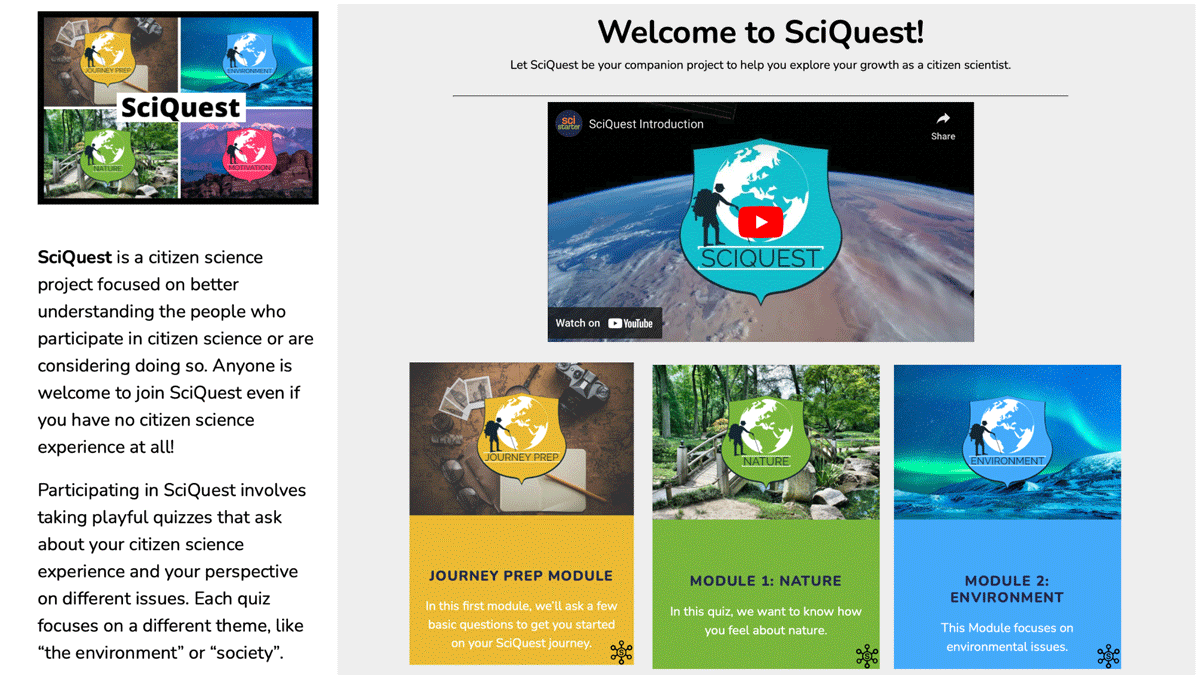
Figure 4
Screenshot of the SciQuest landing page on SciStarter, featuring an introductory video and icons for the surveys currently available.
We made the first survey (“Journey Prep”) available starting in March 2021. This brief survey introduced users to SciQuest and collected baseline data on volunteer demographics, amount of citizen science experience, etc. The questions in this survey were not validated because they were not adaptations of instruments. The second survey, “Nature,” was released in January 2022 and measured environmental concern, connection to nature, and wildlife valuation; the third survey, “Environment,” was released at the same time and evaluated environmental interest/affinity and pro-environmental behaviors (Supplemental File 2: Supplemental Table 2). In September 2022, we conducted a preliminary analysis of responses to the Journey Prep survey and shared these results with participants in an emailed reportback, which also encouraged participants to complete the new surveys. This reportback was automatically emailed to participants who completed the Journey Prep survey after this date. Similarly, in March 2023 we conducted a preliminary analysis of the Nature and Environment surveys, emailed these results to volunteers who had completed these surveys, and created an email distribution that would share results with subsequent survey respondents. In March 2023, we downloaded all responses to all surveys and calculated volunteer attrition from one survey to the next.
After removing substantially incomplete and duplicate surveys, 181 people completed the SciQuest Journey Prep survey (approximately 1% of active SciStarter members). Of these, 49% (n = 89) went on to participate in the Nature survey. Of the 89 respondents who completed Journey Prep and the Nature survey, 67% (n = 60) went on to complete the Environment survey, representing a 33% retention rate from the first to the third survey. There was no difference in retention rates between volunteers with (n = 97) and without (n = 84) prior citizen science experience (χ2 = 0.55–0.70; p = 0.40–0.46). In addition to the quantitative data we collected about respondents’ pro-environmental attitudes and behaviors, the SciQuest surveys also collected rich qualitative data about respondents’ experiences with citizen science (e.g. “A big reason I’m motivated to do this is my son (6) is so curious about science…”; “I found a large amount of fossils in my yard, and now im obsessed…”; “I’ve always been interested in chimps so being able to watch them for hours in camera trap footage is the next-best thing to actually being in the forest with them.”; “Citizen science projects consistently remind me of the amazing diversity of the natural world around me…”).
Discussion
Herein, we have outlined the process of creating an exploratory evaluation tool for a citizen science platform that aimed to attract and retain surveytakers using a more engaging format than past evaluations conducted on that platform. This tool took the form of a citizen science project itself, and in doing so attempted to adopt a more participatory approach than conventional citizen science surveys, while setting the stage for long-term, longitudinal evaluation. The design of this tool was informed by heuristics derived from the literature for making activities fun—meeting needs for autonomy, social connection, playfulness, challenge, transport and curiosity— characteristics that have been shown to lead to more engagement and retention in an activity (Lucardie 2014; McDowell 2004).
According to data from approximately 250 pilot testers, the fun instruments used in SciQuest were reliable compared with existing validated instruments, suggesting that more creative approaches to surveying can still generate useful, high-quality data. Nearly twice as many pilot testers preferred SciQuest to the conventional instruments; however, most respondents (53–67%) had no preference. Given the significant effort that went into developing SciQuest as an evidence-based fun evaluation tool, we hoped to find much stronger preferences for it. This finding may relate to the sample used for the pilot test: Qualtrics Panelists. Perhaps because respondents are paid for each survey they complete (Boas, Christenson, and Glick 2020), they prioritize quickly completing survey instruments—something easier to do with conventional Likert-style bubble sheets than with the interactive elements in the fun instruments (indeed, we found that the average user took nearly twice as long to complete the SciQuest version of the survey compared with the conventional survey). It would be worthwhile to follow up with a sample of citizen scientists and ask them to complete the same task, comparing SciQuest instruments to traditional instruments, to see if there is a clearer preference towards SciQuest. Nevertheless, we cannot discount the possibility that SciQuest may simply be less fun than we hoped.
On the other hand, we observed high retention rates in the surveys, with 49–67% of respondents continuing from one survey to the next. This retention rate is much higher than the 19% retention rate we have achieved in prior surveys of SciStarter volunteers using conventional instruments (B. Allf, L. Larson, and C. Cooper, unpublished data) and the retention rate actually increased as participants progressed through the surveys, meaning SciQuest shows promise as a tool for truly longitudinal citizen science volunteer studies (importantly, with only three surveys completed, we have not yet achieved fine-scale, longitudinal evaluation at this stage in the development of SciQuest). Additionally, SciQuest retained volunteers with and without prior citizen science experience at equal rates, meaning even people completely new to citizen science were interested in contributing to the project and sticking with it. This is a promising finding given that many citizen science evaluations oversample highly engaged volunteers, and as a result, these evaluations may miss important learning that occurs among newer participants, who often have the most to gain (Masters et al. 2016). By helping to overcome this sampling bias, SciQuest positions itself to capture a broader and more representative range of volunteer experiences, including early-stage shifts in attitudes and behaviors.
We cannot definitively attribute the successes of SciQuest to its “fun” elements since we did not directly assess whether volunteers experienced the surveys as fun. For example, the participatory framing (e.g., treating the survey as a form of citizen science, sharing results) may have also played a role. However, given that SciQuest achieved retention rates two to three times higher than conventional surveys administered to this same population, it is clear that some aspect of the new approach was effective. Since SciQuest was specifically designed to capture fun, following an evidence-based framework, and because past work has found that fun activities boost response rates, it is reasonable to anticipate that designing “for fun” contributed at least in part to this increased volunteer retention.
While our primary goal in this study was to design and test a new evaluation tool for SciStarter specifically, we believe our results may be informative for other contexts as well. First, other citizen science platforms such as CitSci.org and Zooniverse, may be able to follow our model of adapting platform infrastructure to create their own embedded, longitudinal citizen science evaluations in a similar manner as SciQuest. Platforms have significant potential to advance cross-project learning outcomes research if they can find sustainable methods for attracting and retaining surveytakers; our approach offers one such method. Second, this study offers broadscale insight into making citizen science-related initiatives fun. We conducted an extensive literature review to develop strategies for making evaluation fun and our findings offer a general framework for doing so (opportunities for transport, curiosity, etc.) as well as specific examples (including narrative-style questions, progressive disclosure, etc.). This framework may be useful for evaluators of standalone projects (i.e., as opposed to platforms) for whom designing an entire citizen science project for evaluation is unlikely (and almost certainly unnecessary). Indeed, this fun framework may even be useful for designing traditional citizen science projects themselves to better consider the volunteer experience. That is, our implementation strategies for making SciQuest fun (providing performance feedback, fostering opportunities for interactions with others, etc.; Table 1), might also be tangible strategies for making a variety of science-related activities more fun, whether those activities are completing surveys or monitoring birds. Lastly, our validated fun survey instruments are freely available (Supplemental Files 4–6), and others could adapt or use them directly for evaluating pro-environmental attitudes and behaviors, since the questions are designed to be project agnostic and thereby useful for measuring learning in any project in which environment-related learning may occur. In a more general sense, we hope this paper advances the idea that citizen science evaluation doesn’t have to be tied to conventional ways of surveying.
Importantly, we recognize that evaluation using new approaches comes with risks. For instance, participatory methods that clearly share evaluation goals and results with participants could “contaminate” future responses by increasing social desirability bias (Larson 2019). This is an important concern for data quality, and one we tried to avoid in our own reportbacks by stressing that there was no “right” answer to questions and providing examples of a wide range of responses to survey questions. However, this bias may be less of a concern for citizen scientists specifically, compared with other types of survey respondents, given citizen scientists’ interests and motivations to participate in authentic scientific research (Larson et al. 2020). Citizen scientists are routinely trusted to produce high-quality data for science; presumably the same can be true for citizen science evaluation, if these volunteers are given the opportunity to understand the purpose of the tasks they are assigned. Thus, citizen scientists may be uniquely positioned to benefit from more fun, creative approaches to evaluation, while minimizing the data quality risks associated with such an evaluative approach. Future research should assess the extent to which reportbacks might bias the results of longitudinal evaluation among citizen scientists. In short, citizen science participant evaluation doesn’t have to exist outside of the broader citizen science context (Robinson et al. 2018). Indeed, if the goal of evaluation is to gain new knowledge by leaning on the efforts of volunteers, evaluators owe it to their participants to share what those efforts are helping to achieve. We suspect this transparency would also bolster response rates.
Conclusion
Learning outcome surveys of citizen scientists are a valuable tool for better understanding the broader societal value of partnerships between scientists and the public. Herein, we outline a new approach to citizen science evaluation that aims to address some of the shortcomings of traditional evaluation methods by making the survey-taking experience more engaging and participatory. More generally, we take a volunteer-centric approach to evaluation (Allf et al. 2022) that tries to carefully consider the volunteer experience within the context of evaluation. Rather than existing in isolation, assessments and evaluations can form a cohesive dimension of project owners’ overall vision of their citizen science program—a dimension that could be engaging (and, perhaps, fun), should generate a meaningful and enthusiastic response, and which can be embedded within existing protocols and practices.
Data Accessibility Statement
De-identified survey data from the Qualtrics Panelists, along with a data analysis R script, are available on DRYAD (10.5061/dryad.7d7wm3843).
Supplementary Files
The supplementary files for this article can be found as follows:
Supplemental File 1
Supplemental Table 1. Studies included in a review of articles focused on defining “fun,” alongside key takeaways and methods. DOI: https://doi.org/10.5334/cstp.796.s1
Supplemental File 2
Supplemental Table 2. Validated instruments and SciQuest-modified instruments used in validation with Qualtrics panel. DOI: https://doi.org/10.5334/cstp.796.s2
Supplemental File 3. SciQuest Video. A screen recording of the SciQuest landing page and annotated walk-throughs of each survey. Video file available here: https://doi.org/10.5061/dryad.7d7wm3843
Supplemental File 4. Qualtrics file for Journey Prep survey. File available here: https://doi.org/10.5061/dryad.7d7wm3843
Supplemental File 5. Qualtrics file for Nature survey. File available here: https://doi.org/10.5061/dryad.7d7wm3843
Supplemental File 6. Qualtrics file for Environment survey. File available here: https://doi.org/10.5061/dryad.7d7wm3843
Ethics and Consent
This research was approved by the North Carolina State University Institutional Review Board (IRB #20934). Informed consent was obtained from all participants before being surveyed.
Acknowledgements
We are thankful to the hundreds of volunteers who have participated in SciQuest. Thanks also to the SciStarter team, including Darlene Cavalier, Caroline Nickerson, and Daniel Arbuckle, for providing valuable feedback and support in developing this project.
Competing Interests
CBC serves as the (unpaid) Director of Research Partnerships for SciStarter. All other authors have no competing interests to declare.
Author Contributions
BCA: Conceptualization, design, methodology, project administration, analysis, original draft writing, review and editing; LRL: conceptualization, design, methodology, review and editing, funding acquisition, supervision; JG: conceptualization, review and editing; RRD: conceptualization, review and editing; CBC: conceptualization, design, methodology, review and editing, funding acquisition, supervision.