
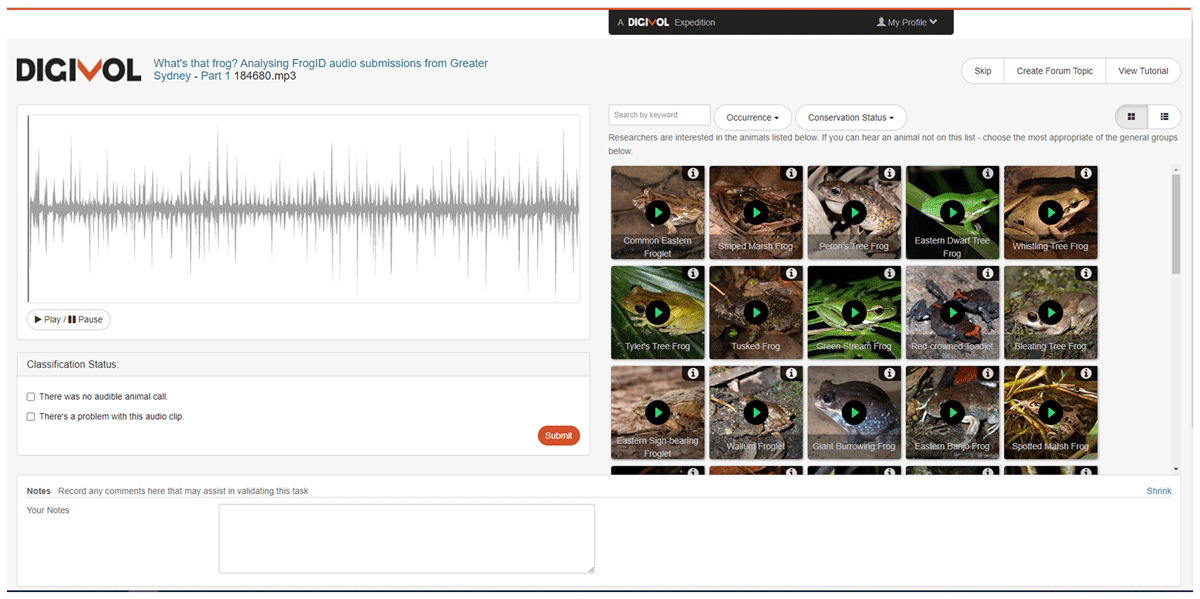
Figure 1
User interface of the FrogID Audio Analysis project on the DigiVol crowdsourcing platform, including a visual oscillogram of the 20–60 second FrogID sound recording, and sample photographs and audio of potential frog species.
Table 1
Accuracy of responses according to the number of frog species calling.
| NUMBER OF SPECIES CALLING | CORRECT | PARTIALLY CORRECT | INCORRECT |
|---|---|---|---|
| Zero (not a frog) | 69% | N/A | 31% |
| One | 69% | 4% | 27% |
| Two | 35% | 48% | 17% |
| Three | 24% | 63% | 13% |
| Four | 12% | 88% | 0% |
| Five | 4% | 91% | 5% |
| Six | 2% | 92% | 6% |
| Seven | 10% | 60% | 30% |

Figure 2
Histogram of the 28 frog species identified by the expert validators in the FrogID Audio Analysis project, displayed as the percentage of the total number of records of each species which received a correct identification. Red line indicates the overall accuracy of all species combined.

Figure 3
Mean percentage (with 95% confidence interval) of tasks which reach the threshold for retirement according to each consensus threshold and number of volunteer responses.
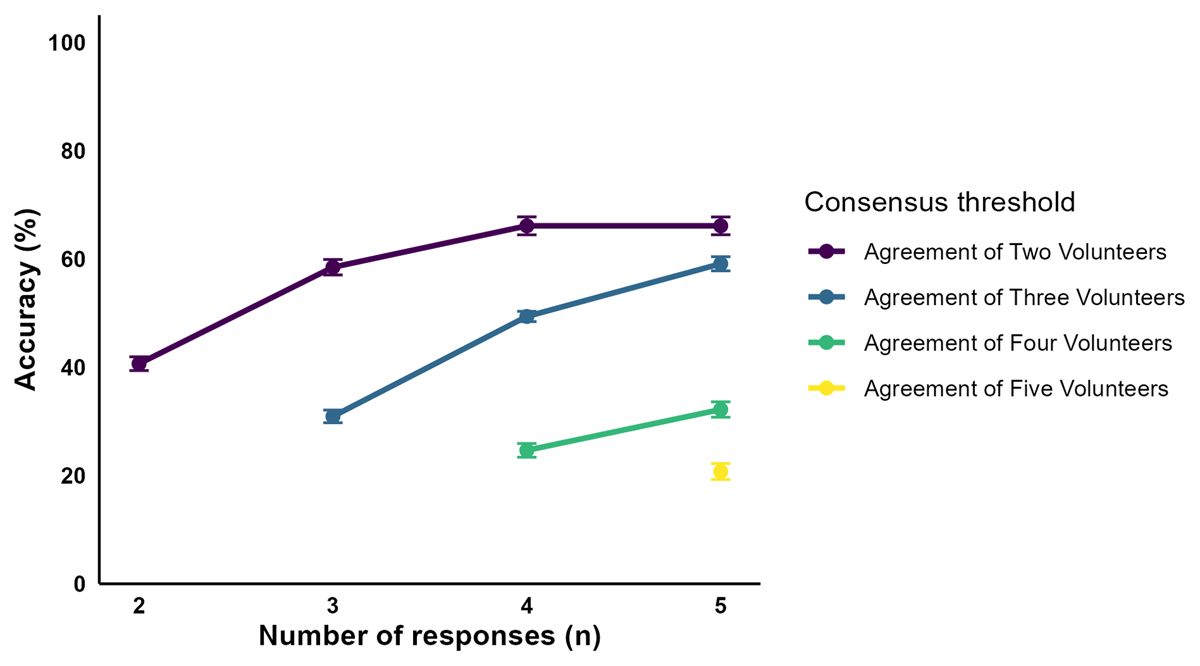
Figure 4
Mean percentage (with 95% confidence interval) of tasks that reach the threshold for retirement and are identified correctly according to each consensus threshold and number of volunteer responses.
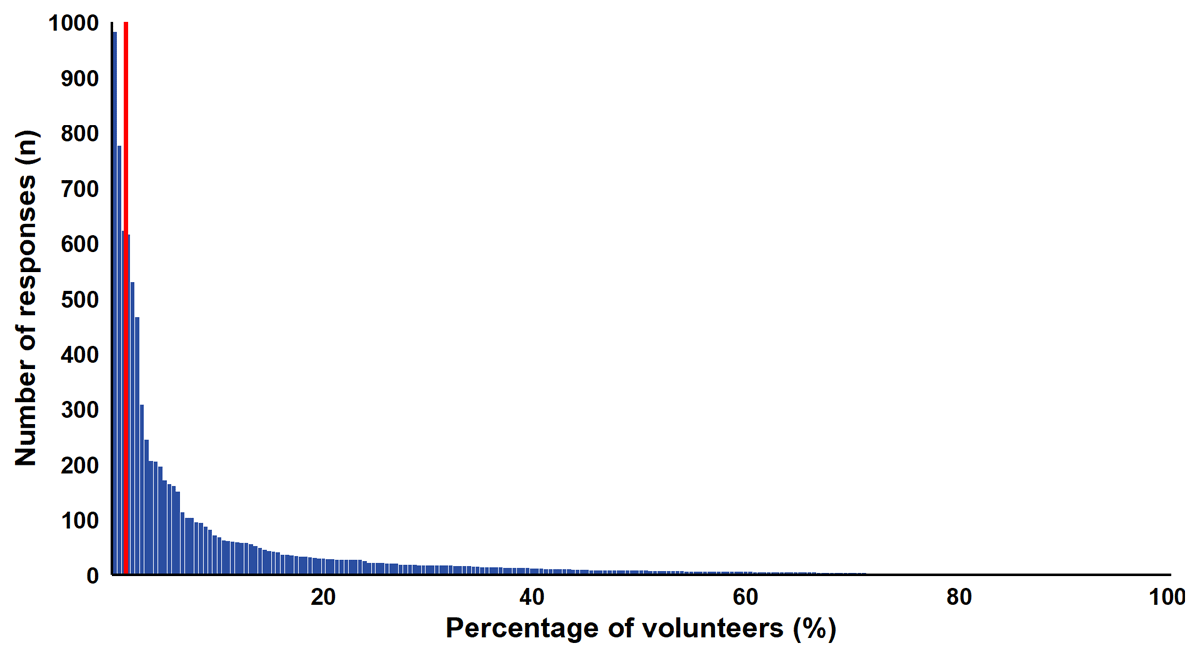
Figure 5
Histogram displaying the number of responses recorded by each individual volunteer, ordered from most to fewest contributions, and indicated by the total percentage of all volunteers. Red line indicates the position of 50% of all responses, which was contributed to by the top 3% of volunteers.

Figure 6
Scatterplot of individual volunteer accuracy according to the number of responses contributed to the audio analysis project, including a regression line derived from a Pearson’s Correlation Test.
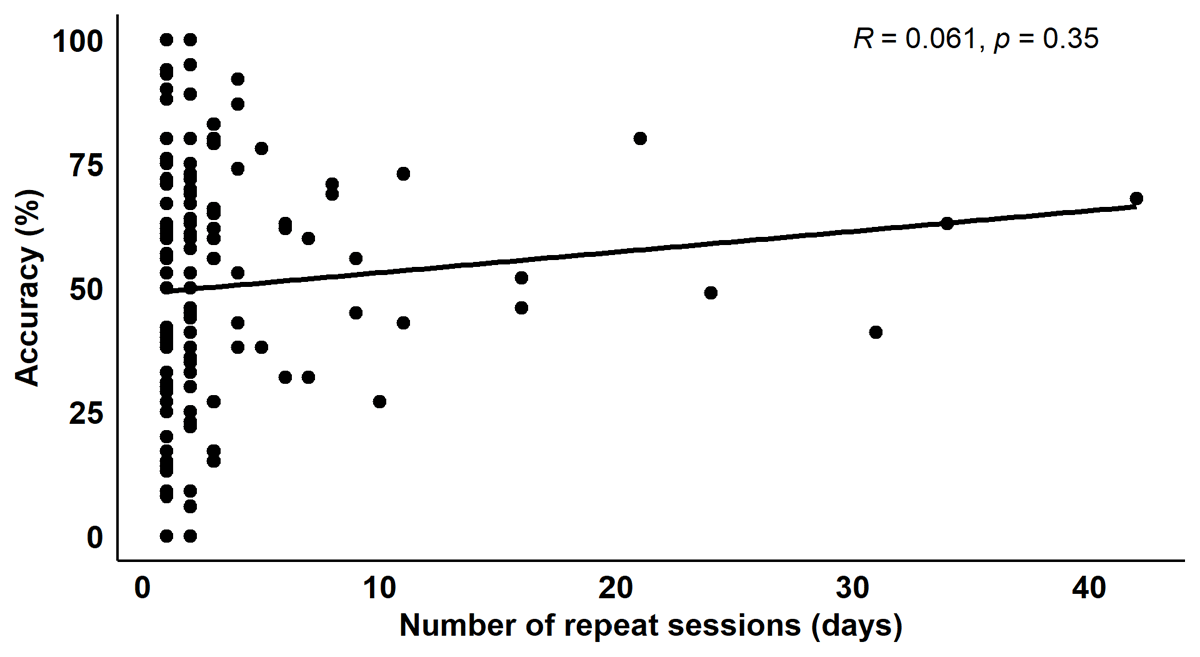
Figure 7
Scatterplot of individual volunteer accuracy according to the number of repeat identification sessions (days), including a regression line derived from a Pearson’s Correlation Test.