
Introduction
The multi-dimensional nature of food (e.g., nutrition, health, agriculture, and culture) can make it a powerful draw for citizen engagement (Ryan et al. 2018). Food provides a wealth of opportunity for connection and learning, and in recent years there has been a growing interest in the use of citizen science methods in food research (Reynolds et al. 2021). One key food safety issue is food hypersensitivity (FHS) – objectively reproducible symptoms or signs, initiated by exposure to a defined stimulus at a dose tolerated by normal subjects (Johansson et al. 2001). FHS is a significant health issue requiring constant vigilance that has extensive impacts on quality of life and mental health, causing stress, anxiety, and depression (Knibb et al. 2019).
FHS can be further divided into food allergy and non-allergic food hypersensitivity (formerly referred to as food intolerance). Food allergy can be sub-divided into immunoglobulin E (IgE)-mediated food allergy (for example to milk, eggs, and peanuts) and non-IgE-mediated food allergy (such as coeliac disease, which does not have an immunological basis). Between 1.1 and 10.8% of the global population has a food allergy, and the prevalence of food intolerances is higher (Durban et al. 2021). Additionally, rates of food allergies appear to be increasing (Tang and Mullins 2017). In the UK, an estimated 2% of adults and 8% of children suffer from food allergies (FSA 2015). In the UK there were more than 30,000 hospital admissions related to a food allergen trigger between 1998 and 2018, and over the same period, hospital admissions for food related anaphylaxis saw an annual increase of 5.7% (Conrado et al. 2021). In addition to the estimated 800,000 people clinically diagnosed with a food allergy, approximately 300,000 people are living with coeliac disease and 1.2 million with food intolerance and other FHS conditions in the UK (FSA and RSM UK Consulting 2022).
One of the most challenging settings for managing FHS is eating food prepared outside of the home, referred to here as “eating out,” and is associated with an increased likelihood of accidental consumption of allergens (Barnett et al. 2020; Leftwich et al. 2011). Eating out in cafés and restaurants was found to account for 21–31% of accidental allergen ingestion with a further 13–23% linked to other environments (Versluis et al. 2015). Studies about experiences of eating out with FHS have used surveys and questionnaires as well as interviews and focus groups (Sommer et al. 2012); however, these methods tend to rely on general retrospective assessments of eating out experiences rather than conveying relatively immediate and context-specific responses.
Citizen science methods may offer several advantages when exploring experiences of FHS. Firstly, the engagement of citizens (not only those who are allergen sufferers) in food allergen research has the potential to raise awareness of food allergies and sensitivities and promote a better understanding of the challenges faced by individuals with these conditions (Spitz et al. 2018; Reynolds et al. 2021). This can help reduce stigma and discrimination towards those with food allergies and sensitivities and promote more inclusive eating out practices (Cummings et al. 2021). Involving the public in food allergen research can also lead to more diverse and representative data (Den Broeder et al. 2018) that can be collected in real- or near real–time (McCormick 2012) and over a wide geography (Strasser and Haklay 2018) – in this case, at a multitude of eating out establishments. Indeed, citizen science could be a way to study behaviours related to food at a household level in a more direct (and thus more accurate) and detailed way than retrospective self-reports, as exemplified by Pateman et al. (2020). Conversely, such stigmas could deter people suffering from food allergens from participating for fear of judgement, and the care required in picking eating out destinations may self-select for more sympathetic destinations.
The personal connection that allergen sufferers have with the issue of FHS may result in a more motivated audience for participation in a citizen science project (Geoghegan et al. 2016; Del Savio et al. 2016). Such motivations may be influenced by factors such as gender, age, and employment status (Pateman et al. 2021). By taking part, participants would contribute to research to help them better understand their condition and find ways to manage it. The result of participation may also be a sense of empowerment and ownership over the research process, which can be a motivating factor itself (Bonney et al. 2016). With appropriate coordination and facilitation, a citizen science project can provide individuals with opportunities to connect with others who share their experiences and concerns, leading to a sense of community and support (Vohland et al. 2019). Thus, involving the public in food allergen research could help promote collaboration between researchers and the public, leading to more effective and impactful research outcomes.
Our study forms part of a pilot research project that was funded by the Biotechnology and Biological Sciences Research Council (BBSRC) under the call “Citizen science for Food Standards Challenges.” The project vision was to utilise citizen science to identify the best ways of supporting people with FHS to make safe and informed choices when they are eating food prepared outside the home. Here, we respond to one of two project aims – to assess the future feasibility of engaging those with FHS as citizen scientists. To determine how well citizen science performed in this new area of application we i) assessed factors that influenced the extent and depth of participation, and why people were motivated to participate using qualitative and quantitative approaches, and ii) explored both participant and practitioner feedback for indications of their perceived value of the project and the citizen science approach. The second project aim, to explore specific contributions to FHS research, is discussed in Barnett et al. (in preparation).
Methods
Prior to the data collection, a co-design process was carried out with project partners (Coeliac UK, Anaphylaxis UK, Allergy UK, The Natasha Allergy Research Foundation, Allergy Action) and two cohorts of prospective citizen scientists who registered their interest in participation. Thereafter, citizen scientists recorded their experiences of eating out between the 27th of May and 30th of September 2022. During these four months of data collection, participants could submit data about discrete eating out experiences on multiple occasions. Post-project, project partners and participants took part in workshops and semi-structured interviews.
Recruitment
The goal for recruitment was to obtain data from people across a broad socio-demographic spectrum with a diverse range of FHSs regarding the allergens people reacted to and the nature and severity of their reaction. To achieve this goal, the project was promoted through the project partner and co-investigator networks, and on social media (e.g., Twitter, Facebook). Demographic information was gathered through our eligibility survey (administered through Qualtrics once they had consented to take part in the study). Participants had to be aged over 16, and either have FHS or be caring for someone under the age of 16 with FHS.
Recruitment of the citizen scientists ran from the 21st of April to the 1st of August 2022. A total of 121 individuals with FHS registered as citizen scientists. Half of the project participants registered via Coeliac UK (n = 44; 36.4%) and Allergy UK (n = 19; 15.7%), while others were recruited via Twitter (18; 14.9%), Facebook (17; 14.0%), Instagram (10; 8.3%), word of mouth (6; 5.0%), The Natasha Allergy Research Foundation (5; 4.1%), and Anaphylaxis UK (2; 1.7%).
Co-design process and outcomes
Sixteen citizens (from 31 invites) took part in one of two workshops in May 2022, facilitated by Zoom (California, USA). These 16 workshop participants were seeking to avoid at least one of nine allergens, were between 25 and 75+ years old, and 12 identified as women and four as men. For full details of the co-design process see Supplemental File 1.
Due to the compressed project timeframe necessitated by the funding, it was not possible to fully co-create the survey tool. Therefore, an initial draft had been developed first by the research team, and then with project partners. During the citizen scientist workshops, participants had the opportunity to contribute their views through multiple choice surveys, Likert responses, and word clouds (Mentimeter, Stockholm, Sweden) or via chat messages or microphone.
As a result of the citizen scientist co-design workshops, 17 changes were made to the survey, ranging from minor alterations (e.g., adding an option within a multiple-choice question) to altering our “eating out journey” template (Supplemental File 2). Notably, a section designed to capture observations once at the venue was removed as it was considered redundant.
Survey structure and data collection
Following the co-design process, a survey tool was developed in Qualtrics that could be filled out through a smartphone or other portable device, or in a web-browser. Participants were encouraged, but not required, to record their experience in real time. The survey had five components: i) prior knowledge of the establishment, the type of establishment and cuisine, ii) the pre-planning steps taken prior to visiting an establishment, iii) arrival at an establishment, iv) the ordering process when at the table, and v) an overall reflection of the eating out experience (Supplemental File 2). Further participant information gathered upon registration included the nature of the allergen (type, symptoms), speed and severity of reaction, age, gender, ethnicity, and how the registrant found out about the project.
Each participant was provided with a unique ID (UID) that allowed personal information to be detached from each survey response and securely stored in a different file on University of Bath servers. All identifiable information (e.g., relating to eating venues) was deleted from the survey file.
Post-survey workshops and interviews
To explore participant and practitioner feedback for indications of their perceived value of the project and the citizen science experience, we carried out a second round of online workshops with project participants and partners after the data collection period ended. Here, we recruited participants based on their participation in multiple phases of the project (pre-survey workshop, survey contribution, and interview) and 7 out of the 16 invited individuals attended (23rd November 2022). We also held a workshop with 3 project partners (2nd December 2022). For full details of the post-survey workshops, see Supplemental File 1.
Furthermore, semi-structured interviews were completed online with nine citizen scientists between 3rd October and 1st November 2022. The nine interviewees were those who responded from a targeted sample of 25 who had either low (submitted one observation) or high (submitted more than one observation) rates of participation and had attended the initial citizen scientist workshop or not, whilst also trying to maintain a range of allergy status. The definition between low and high rates of participation correspond to 30 (45.5%) and 36 (54.5%) participants, respectively.
The interviews were recorded, transcribed through intelligent verbatim, and anonymised. The interview data was analysed following a “codebook” approach to thematic analysis (Braun and Clarke 2022) using NVivo 12 (QSR International, Massachusetts, USA). Meeting notes during the post-survey workshops were taken by the researchers and mapped against themes from the interviews. An overview and guide to the workshops, interviews, and codebook is included in Supplemental File 1: Table 3.
Coordination of the citizen science project
A project website was launched in April 2022 (https://sites.google.com/view/eating-out-foodhypersensitive/home) that included a registration link to support recruitment and provide a reference point for project information. To further enhance a sense of community, to support coordination, and to share news and updates, all participants were invited to join a Facebook group. One member of the research team assumed the role of project coordinator, was the main point of contact, and communicated bi-weekly project updates to all project participants. Further data that could complement the main qualitative analyses (i.e., post-project focus group and interviews) was collected via the Facebook group and via email.
Data analyses and statistical methods
The extent and depth of participant engagement was assessed in several ways. First, a conversion rate was calculated as the percentage of registered people who went on to submit at least one observation. Secondly, the distribution of observations per participant was analysed, where a less skewed (or shorter tailed) distribution indicates a more equal division of labour amongst participants (August et al. 2019). The returned observations were also assessed for their completeness across each stage of the eating out journey. This was achieved by i) calculating the average proportion of optional responses given per stage, and ii) calculating the proportion of skipped questions at two critical junctures of the survey.
Binomial regression was used to identify statistically important predictors of whether a registrant would go on to participate or not using the participant profile for independent variables that included how regularly a reaction occurs after encountering the index allergen(s) and how severe the participant reaction; and their age, gender, ethnicity (reduced to White British or Irish [n = 102], and other [n = 19]), working status, and how the participant heard about the project.
To assess the depth of engagement of those who did participate, we calculated a participant activity ratio metric based on one of four engagement metrics posed by Ponciano et al (2014) and adapted by Boakes et al (2016). This ratio was calculated as the number of data submitted by a given participant, divided by the length of time available to submit further data (i.e., until the data collection period ended). This number was normalized to a value between 0 and 1. We then calculated the percentage of participants whose activity ratio was less than or equal to 0.33 (“dabblers”), between 0.33 and 0.66 (“steady”), and greater than 0.66 (“enthusiasts”). We then fitted a Generalized Linear Model (GLM) with Gamma errors and a log link function to predict the activity ratio using the same set of predictors as for the binomial model outlined above. Model residuals were checked for conformity with model assumptions. All statistical modelling was carried out in R Statistical Software (R Core Team, 2022).
Results and Discussion
Participant overview
Out of the 121 participants that completed the registration process, there was a relatively equal distribution of participants across all age ranges (Table 1), with 14 of those registered answering on behalf of a child’s experiences of eating out. Most participants identified as women (105, 86.8%), with 15 (12.4%) identifying as men and one as non-binary. Of those who disclosed their ethnicity (119), most were white British, Irish or other white background (105, 88.3%), with the remaining 11.7% including mixed white and Asian, white and Caribbean, and Asian-Indian. Participants were employed full time (54, 45.0%), part-time (20, 16.7%), or were retired (19,15.8%), self-employed (13, 10.8%), or students (10, 8.3%).
Table 1
Overview of project participants, including demographics and hypersensitivities.
| CATEGORY | N | % |
|---|---|---|
| Age | ||
| <16 | 14* | n/a |
| 16–24 | 16 | 13.2 |
| 25–34 | 17 | 14.0 |
| 35–44 | 27 | 22.3 |
| 45–54 | 26 | 21.5 |
| 55–64 | 21 | 17.4 |
| 65 + | 14 | 11.6 |
| Gender | ||
| Female | 105 | 86.8 |
| Male | 15 | 12.4 |
| Other | 1 | 0.8 |
| Ethnicity | ||
| White British | 98 | 82.4 |
| White Irish | 4 | 3.4 |
| Mixed white and Asian | 3 | 2.5 |
| Other white background | 3 | 2.5 |
| Asian – Indian | 2 | 1.7 |
| Mixed white and Caribbean | 2 | 1.7 |
| Other ethnic group | 2 | 1.7 |
| Other mixed background | 2 | 1.7 |
| Prefer not to say | 2 | 1.7 |
| Did not answer | 2 | 1.7 |
| American/Canadian | 1 | 0.8 |
| Employment status | ||
| Employed (full time) | 54 | 45.0 |
| Employed (part time) | 20 | 16.7 |
| Retired | 19 | 15.8 |
| Student | 10 | 8.3 |
| Self-employed (no employees) | 10 | 8.3 |
| Self-employed (with employees) | 3 | 2.5 |
| Homemaker | 2 | 1.7 |
| On disability allowance | 1 | 0.8 |
| Did not answer | 1 | 0.8 |
| Unemployed | 0 | 0.0 |
| Allergens avoided** | ||
| Cereals | 75 | 25.1 |
| Cow’s milk products | 33 | 11.0 |
| Peanuts | 31 | 10.4 |
| Other nuts | 27 | 9.0 |
| Eggs | 23 | 7.7 |
| Fruits and vegetables | 22 | 7.4 |
| Soya | 15 | 5.0 |
| Sesame | 15 | 5.0 |
| Crustaceans | 14 | 4.7 |
| Molluscs | 13 | 4.3 |
| Other | 31 | 10.4 |
[i] *Reported for by registered parent or guardian.
**Participants were often avoiding multiple allergens.
On average (median), those who registered were avoiding two allergens (a maximum of 11). A total of 18 allergens were listed, and several participants indicated others that were not stated. A range of potential reactions were reported and included stomach cramps (70, 57.9%), other digestive symptoms (70, 57.9%), tiredness (63, 52.1%), and diarrhoea (47, 38.8%). Reactions were likely to occur whilst eating out at the venue (70, 57.9%), or afterwards (51, 42.2%).
A review of 8,220 UK residents identified those aged between 25 and 34 to participate the least in citizen science, with an overall positive bias as age increased (Pateman et al. 2021). The trend was similar here, but the age distribution was perhaps more even, with only 9.1% difference between the most and least represented age groups. The influence of gender is discussed in greater depth below; however, dominance of white participants (≥89.3%) is again typical of participation in citizen science projects in both the UK (Pateman et al. 2021) and in the United States (Dibner and Pandya 2018).
Citizen scientist engagement
From registrant to participant
A total of 241 observations were collected, of which 197 (81.7%) reported on an eating out experience. The remaining 44 (18.3%) related to take-away meals. Data was submitted by 66 UIDs (with seven observations submitted without a UID), although 127 people indicated a willingness to participate in the project by at least beginning the registration process. Thus, the conversion rate from registrant to participant was at least 52.0%.
Although it should be noted that the context for, and definition of, conversion rate varies, a conversion rate from registrant to contributing citizen scientist of 52% appears high. There are examples from citizen science in the natural sciences, where 43% of engaged citizens submitted data on precipitation around Lake Tahoe (Arienzo et al. 2021), and 38% of registrants went on to submit ecological data to Evolution MegaLab (Worthington et al. 2012). Of those that undertook training for FreshWater Watch, a global citizen science water quality programme, only 20% went on to submit data (August et al 2019), and only 10% of survey packs distributed by the Open Air Laboratory Project (OPAL) were ever returned (Lakeman-Fraser et al 2016), with several other projects having conversion rates of less than 10% (Cohnstaedt et al. 2016; Brodie et al. 2023).
Extent and depth of participation
The median survey contribution from those who submitted at least one observation was two (min. 1, max. 27), with 30 (45.5%) contributing once and 36 (54.5%) contributing more than once (Figure 1). Half (49.9%) of the observations were submitted by 11 participants, with one super responder contributing 27 observations (11.2%). However, 42.4% (n = 28) of participants who submitted the most data were required to achieve 80% (80.3%) of the whole data set (where a UID was entered).
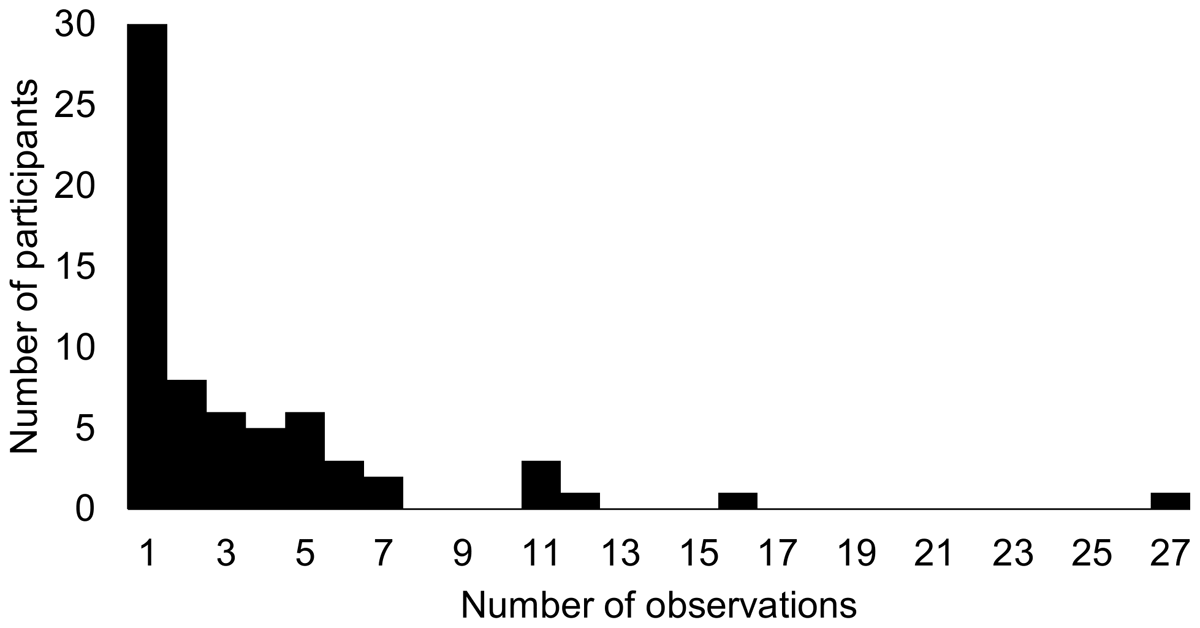
Figure 1
Frequency distribution of the number of samples collected by project participants (n = 241).
According to the activity ratio, 57 (86.4%) of participants could be considered dabblers, 8 (12.1%) steady participants, and 1 (1.5%) an enthusiast. This volunteer engagement profile was comparable to those across three well-established UK biodiversity recording schemes (Boakes et al. 2016), with a very similar distribution to iRecord. There was a relatively high proportion of dabblers in this project (86.4%), especially when compared with a project on the popular crowdsourcing platform Zooniverse (Anhalt-Depies et al. 2022), where 65.7% were classed as such (short or long term). However, activity ratio is only one of four engagement metrics that might be applied if more information on participation was available (Ponciano and Brasileiro 2014). To this end, the availability of opportunities for participation in this project (i.e., when eating out) is unusually constrained when compared with conventional citizen science projects. Decisions to eat out are influenced by financial freedom, logistics, work commitments, and social factors (e.g., Adams et al. 2015), and those with FHS have additional cause to be cautious about eating out (Leftwich et al. 2011; Worsfold 2006). Consequently, a number of participants labelled as dabblers may have a higher activity ratio if the project duration was longer.
Alongside the survey component, relatively few interactions were observed through the dedicated private Facebook group (n = 23; 19% of project participants). The types of interactions were 11 posts (3 of which were made by the participants, and one of which was a picture displaying cross contamination), seven comments (4 of which were made by participants), and 41 reactions (23 of which came from participants). Out of the 117 participants who responded to their willingness to take part in future research on this topic, 115 (98.3%) agreed to be contacted.
Predictors of conversion rate and activity ratio
Binomial regression identified several factors that were significant predictors of whether the 121 registrants would go on to submit data (i.e., “convert”). Those registered aged between 25 and 34 and between 35 to 44 were less likely to submit data (Z = –1.917, P = 0.06 and Z = –2.112, P = 0.03, respectively). Similarly, participants aged under 16 (with data being inputted by an adult), were unlikely to submit observations (Z = –1.995, P < 0.05). Female subjects were marginally more likely to go on to participate than males (Z = 1.821, P = 0.07). Those registrants who heard about the project via the Coeliac UK website (Z = 2.425, P = 0.02), and to a lesser extent via Facebook (Z = 1.824, P = 0.07) were also more likely to go on to submit data.
A GLM used to predict activity ratio (n = 66) identified several important influences on participation, which mostly reflected employment status. Whether participants were retired (F = 2.05 P < 0.05), worked full time (F = 2.21 P = 0.03), or were students (F = 2.50, P = 0.02) had a statistically significant and positive influence on activity. However, the relatively low number of participants may underestimate the importance of predictors in both modelling processes.
Male participation is frequently cited as being higher in citizen science projects, across subject areas (Pateman et al. 2021), in wildlife observations (Edwards et al. 2018; Jönsson et al. 2023) and in online crowdsourcing (Ibrahim et al. 2021). However, this disparity appears less pronounced for iNaturalist (Strasser et al. 2023). Moreover, female participation was significantly higher in citizen science projects about chronic disease (Marks et al. 2022), and intrinsic motivations such as those identified here, may be more important for female participation (Lakomý et al. 2020). However, the effect of employment status on participation rates is unclear. Indeed, previous research has found employment status to be a poor predictor of eating out habits (Thornton et al. 2013; Sam et al. 2019).
Within the pre-planning section, the average completeness of five non-mandatory questions was 98.9%, and completeness was similarly high during the ordering phase (93.1%), meaning questions were rarely skipped during these phases. By contrast, the average completeness during the arrival phase was 82.5% (1.4 questions skipped from 8). Most people responded to the three questions asked once the eating out experience was complete (completeness = 86.0%). The opportunity to provide qualitative answers was taken on 93% of occasions across all stages of the survey.
Participant motivations
A reason for such apparent high conversion from registrant to participant, and for the high degree of completeness demonstrated by the participants carrying out the surveys is likely due to intrinsic motivations – the desire to volunteer because it is in some way inherently interesting or satisfying (Finkelstein 2009). Intrinsic motivations are anticipated to be positively related to contribution quantity (Nov et al. 2014), and are a well-established driver of volunteerism (Deci and Ryan 2000). Intrinsic motivations can be divided into egoistical (i.e., caring for oneself) and altruistic (i.e., caring for others or the world around you). Here, the personal nature of the topic likely drives a strong level of egoistical intrinsic motivation and accords with previous findings in environmental monitoring (Kragh 2016).
Enabling reflection
Documenting a detailed account of eating out experiences was found to be personally beneficial for some participants who expressed how it aided reflection of their methods of assessing risk and making decisions:
“I suppose it probably made me stop and think a bit, because I got diagnosed what, 10 years ago, just over 10 years ago, and I’m probably quite used to going out and eating in restaurants […] So yeah, it made me more aware of what the restaurants offer, but also I probably didn’t realise how much I rely on my own knowledge of what goes into dishes, and being able to make an informed decision.” (Interviewee P008)
“…I’ve just not thought about because it’s just normal to me to do those things, and so I found it really interesting […] especially with the repeated experiences, you’re getting trends and so I feel like a bit like how I said I felt trends in my own behaviour…” (Interviewee P001)
Thus, participants reflected on their own circumstances, and the structured process of the survey component acted as a framework for the participants to consider their personal behaviour. Similar individual reflection has been noted as important for evaluation of the impact of a citizen science programme (Constant and Roberts 2017). Such a dialogue was possible only through the workshop and interview process. However, this could be extended further to explore in greater depth the outcomes or actions that resulted from such individual reflection, using, for example, Gibbs reflective cycle (Golumbic et al. 2022), or developing a deeper narrative with the participants (Constant and Roberts 2017).
Sense of importance and community
More altruistic intrinsic motivations were also indicated by participant descriptions of their feelings of community and of their contribution to something important, as well as the perception that their contribution was valued. Supporting science has previously been identified as an important motivating factor in community-driven research (Davies et al. 2011) and in biodiversity recording (Hobbs and White 2012). Social networks and community have similarly been shown to be an effective driver of participant engagement in several other citizen science projects (Asah and Blahna 2013; August et al. 2019).
“…we have to eat food every day so it’s something that is with you all the time and it’s [FHS] also something that while it’s on the increase and there are a lot of organisations talking about it, there’s also still a lot of real lack of awareness around and so for me, any time where there’s something like a survey or something going on, it’s like ‘wow, people are listening to us, people are interested in the problems we have’…” (Interviewee P001)
“It has to do with being part of a community as well. One thing about food hypersensitivity is that it’s chronic. You live with it, it affects your decision-making every day, and will carry on affecting your whole life. So it’s worthwhile investing time and energy in camaraderie, making connections, building relationships and finding out where you can fit in and maybe contribute.” (Allergy Action)
Having meaningful opportunities to contribute
There were also some indications of the communal nature of the project that reflected the coordination and co-design process and degree to which participants felt involved:
“I also liked the fact that some of the things that we suggested became part of the questionnaire, I know something I suggested was there and a couple of other people said things that I then saw in the questionnaire when it was finalised.” (Interviewee P002)
“…I think just kind of listening to the things that you wanted to know about was really helpful and other people’s views on [it] […] I felt very listened to. There was a lot of listening in the sessions and a lot of kind of cross-checking about what people had said that you’d got it right, that that’s what they meant and I think that’s why those sessions, it felt quite structured but also very free to say what you wanted to say and people didn’t judge each other” (Interviewee P005)
Similarly, project partners underlined the importance of knowledge-sharing about FHS, of adopting new strategies to manage risk, and of feeling heard:
“I think the allergic community like that opportunity to have their voice heard, give their perspective. And sometimes I think when their experiences are that they’ve been marginalised in some way because of their allergies, it’s an opportunity, a bit of a relief really to let some of that out and actually ‘my view is valued’…” (Anaphylaxis UK)
Co-design of projects can increase the social relevance of citizen science projects by ensuring that they address topics of societal interest and enhancing in-depth participation and ownership (Shirk et al. 2012; Ballard et al. 2017). Although often used interchangeably, co-design and co-creation are different. Central to the concept of co-creation is the belief that all people are creative and seek outlets for creativity in their lives (Sanders and Simons 2009), and co-creation occurs at all project stages (Vargas et al. 2022). Nevertheless, the co-design process employed here that attempted to represent a diverse set of stakeholders was generally applauded by active participants and did allow for some collaboration, though not with all eventual participants. The effect of not being able to undertake a co-creation process upon conversion and participant engagement, however, cannot be assessed.
Receiving feedback
The interviews highlighted the importance of updating participants on results through fortnightly newsletters, which made them feel continuously part of the research:
“We were getting the bi-weekly emails and seeing the graphs and stuff and also, another thing that was really nice about the bi-weekly emails was the fact that it quoted specific things because then I’d be like, ‘Mum, look, they’ve quoted something that I wrote’, which was quite nice! It was like ‘Ah look, my data’s doing something’, that was nice because it felt like what you were doing wasn’t going into a robot somewhere, it was actually being looked at…” (Interviewee P001)
The importance of feedback in citizen science is not a new concept, but the participant responses further affirm how good communication demonstrates a mutual respect between participant and researcher (Phillips et al. 2019). Perhaps more insightful was the facilitation of participant-to-participant communication via the newsletters. Such value of peer networks for the retention of volunteers has previously been identified (Robinson et al. 2021; Dickinson et al. 2012). Citizen scientists appreciated being able to hear about the experiences of others at the workshops and through the newsletter updates and to reflect on how similar or different those were from their own patterns:
“I think I liked seeing what we knew so far, like and the areas of interest were good because it was sometimes things I hadn’t thought about and things I started looking out for.” (Interviewee P009)
Similarly, project partners highlighted how the process enabled citizens to hear other people’s experiences and to learn from those:
“I think the community element of it is really important because it is a lonely world when you are by yourself, when you are going out to eat and having to advocate for yourself constantly, […] it can be really powerful and empower them to know it’s not just them who are struggling, it’s everyone else.” (Coeliac UK)
Opportunities for improvement
Interviewees also provided more pragmatic feedback in terms of the survey design and implementation, offering, for example, that they enjoyed the Qualtrics software, appreciated the use of multiple choice and free text and photos to provide answers, and enjoyed the different opportunities for elaboration. They provided feedback on what could have been improved in terms of question design (possible repetitiveness, length), use of alternate methods to implement the project (e.g., WhatsApp or creating an app), other social media preferences, and appreciation of the length of time (4 months) to re-enter data:
“…if there was like an app or something that you could log it in on there, if that would have made it a little bit easier for most people. Because then, if you could put all the bits in beforehand, like the restaurant and the place, then you would just do a bit afterwards…” (Interviewee P007)
“…partly I think Facebook is kind of dying technology, social media wise but actually, maybe something like a text message or a WhatsApp message where again, email doesn’t, I know partly because of my work in IT, emails are actually usually ignored these days, a text message or a WhatsApp message saying, ‘Don’t forget to do your survey this week’ […], that sort of, a bit of variance would have helped trigger that, encourage it.” (Interviewee P002)
Both the usage statistics and qualitative feedback indicated that Facebook was not the ideal platform to provide a forum, although it was a valuable location to recruit participants, as elsewhere (Thomas et al. 2022). This indication contrasts with several studies in the natural sciences that highlight the value of Facebook for generating observations and facilitating the near-real-time sharing of information (e.g., Marcenò et al. 2021). Alternatively, the relatively short period of time that the project was live, and with relatively few registrants, may have compromised the ability of such a platform to generate momentum – certainly in comparison to larger-scale initiatives (Liberatore et al. 2018). In this study, most active participants were aged 35+ (63.6%), a demographic whose social media preference typically remains Facebook (Statista 2022). However, younger cohorts are increasingly demonstrating a preference for alternative platforms (e.g., WhatsApp and Instagram), as indicated by several participants in this study.
Open science
In the project partner workshop, attendees described the benefit of having the data available for their organisations and the subpopulation they represent:
“I definitely think the data could be very useful […] it’s always nice when we’re doing campaigns like that, we’re always very evidence-based, as I know everyone else is, to back up the claims with this research is helpful. […] I think it would be incredibly useful especially if we can separate out people with Coeliac from other food hypersensitivities” (Coeliac UK)
The responses from the project partners aligned well with those received from the participants; however, there was also a strong emphasis on availability of data to be able to carry out further bespoke analyses, and the transparency of the analyses undertaken. Both reflect the desire for citizen science to align with open science. Without such openness, participants are deprived of the results of their labours and the opportunity to explore the data further (Hecker et al. 2018b). Furthermore, open science generates trust in the process and builds stronger links between all stakeholders (Anhalt-Depies et al. 2019). There are, however, tensions between citizen science, open science, and the need to comply with ethical processes and data protection (Suman and Pierce 2018). An appropriate format and location must also be identified that is findable, accessible, interoperable, and reusable (FAIR) (Bowser et al. 2020).
Conclusions
Our study explored the performance of a citizen science approach to generating knowledge about the experience of people suffering FHS when eating out. Feedback from the project participants highlighted how the involvement in the co-design of the survey method, the extent of feedback, and the coordination of the project all contributed to a good experience. These results reflect well the anticipated norms of ethical practice in the field of citizen science (Robinson et al. 2018; Rasmussen et al. 2019).
There is some evidence to suggest that older, female participants were more likely to convert from registrants to participants, and to go on to submit multiple observations of their eating out journey when compared with other citizen science projects. The mix of quantitative and qualitative analyses indicated that participants were intrinsically motivated to take part, given the personal nature of the subject. To this end, there was positive feedback regarding the way the project was carried out, and the inclusivity of the co-design process. Overwhelmingly, participants and project partners felt a sense of community and empowerment because of the project coordination.
In combination with a high conversion rate and the extent and depth of participation achieved in a relatively short time frame, this project suggests that there is considerable promise for citizen science in supporting food allergen research. Several practical insights have been identified around the design and conduct of citizen science studies that that may be built upon in future research in this area:
Engage with prospective citizen scientists as soon as possible within the co-design process, and evidence the influence of their involvement.
Understand the communication preferences of your project participants (i.e., choice of media and regularity of contact).
Ensure that surveys are designed with minimal redundancy, with clear delineation between survey elements.
Enable opportunities for participants to personally reflect on their participation through varied forums (e.g., interviews, focus groups, or within survey).
Create a community and facilitate participant-to-participant communication and networking.
Create a safe space for participants to offer their opinions through multiple modes of dialogue, both anonymous and open.
Provide regular and tailored feedback to demonstrate project progress and the importance of the information being generated.
Make data available to promote transparency and trust, and to reduce power imbalances between coordinators and participants.
There were, however, logistical challenges that limit the depth of insight available, owing to constrained eating out “sampling” opportunities that were influenced by external factors (time, cost, and social factors) and to the scope of the funding. There were fundamental logistical barriers to achieving co-creation in this project due to the established funding proposal process that required project specifics before any co-design process could be undertaken, and to the need to provide a detailed ethics assessment before engaging with prospective citizen scientists. Thus, critical stakeholders could be engaged only after the research aims and general method were decided. Therefore, to an extent, the project environment could not accommodate the time, resources, and needs required for co-creation to involve all relevant groups to increase the chance of balancing interests and maximizing impact (Hecker et al. 2018a).
Data accessibility statement
This anonymized data will be made openly accessible through the data repository available at the University of Bath (Pure).
Supplemental Files
The Supplemental files for this article can be found as follows:
Supplemental File 1
Workshops and interview guide and overview. DOI: https://doi.org/10.5334/cstp.644.s1
Ethics and Consent
Ethical approval for the present study was obtained from the University of Bath Social Science Research Ethics Committee on the 4th of April 2022 (ref: S22–036).
Acknowledgements
We extend our appreciation and gratitude to the participants of this study who gave their time and insights to make it possible. We would also like to thank our project partners for their input into the research design and reaching out through their networks to potential citizen scientists.
Funding Information
This study was funded through the Biotechnology and Biological Sciences Research Council (BBSRC), “Engaging food hypersensitive communities in citizen science” project (BB/W009102/1).
Competing Interests
The authors have no competing interests to declare.
Author Contributions
Ian Thornhill: Conceptualisation, Writing – Original Draft, Methodology, Formal Analysis, Funding Aquisition. Estelle Corbett: Writing – Original Draft, Methodology, Formal Analysis, Project Administration, Data Curation. Julie Barnett: Writing – Review and Editing, Funding Acquisition, Conceptualisation, Supervision.