
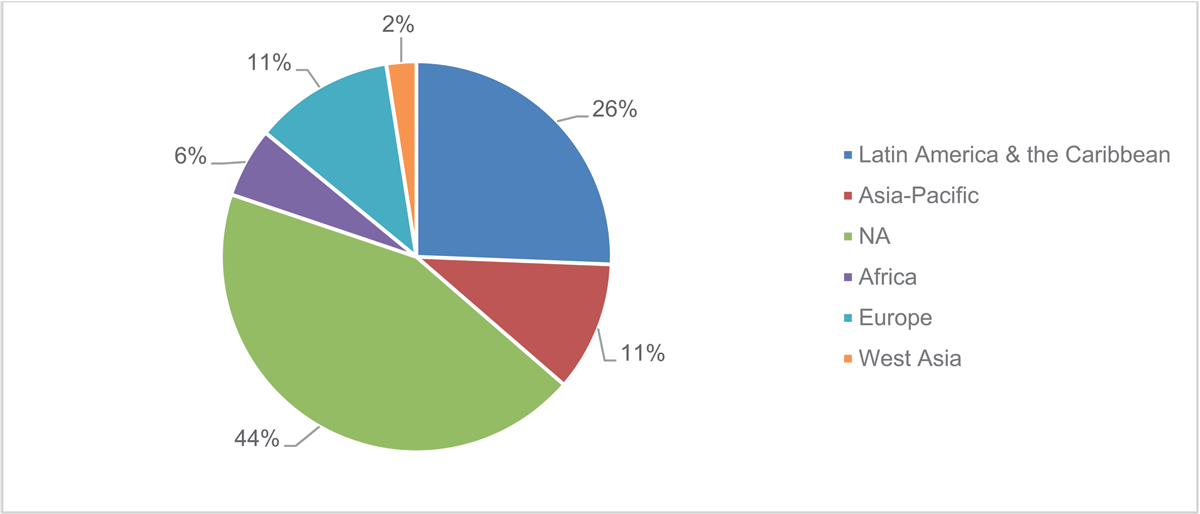
Figure 1
The regional breakdown of the survey respondents as a percentage of the total (n = 121).
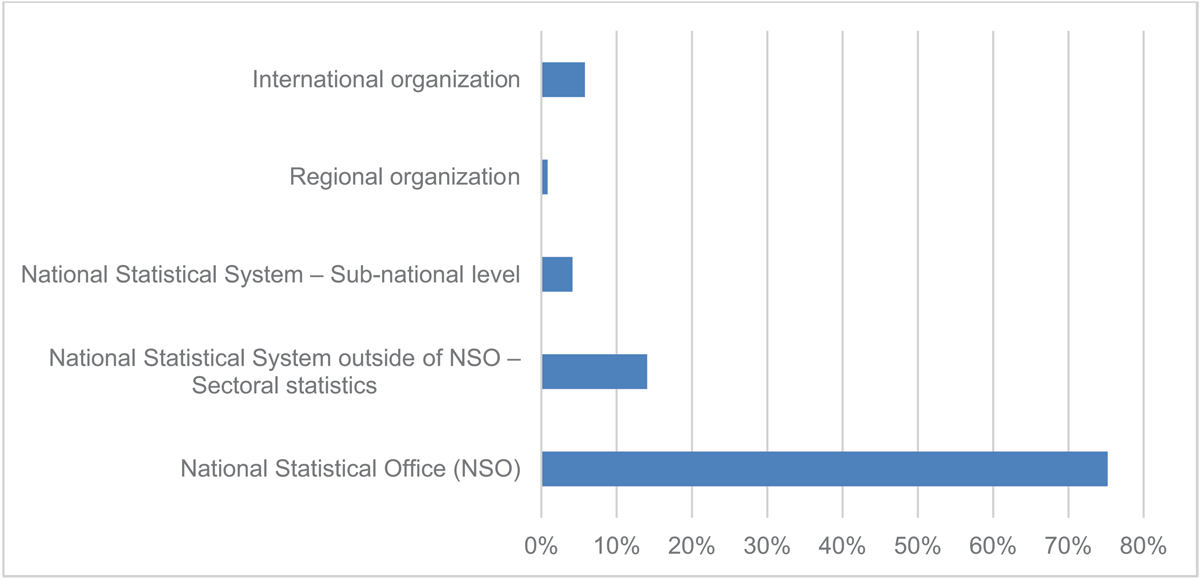
Figure 2
The distribution of survey respondents as a percentage of the total by the type of organization within the official statistics community that they are in (n = 121). Regional organizations refer to UN Regional Commissions or other regional organizations such as development banks while international organizations included UN agencies and other organizations that serve as custodians for SDG indicators.
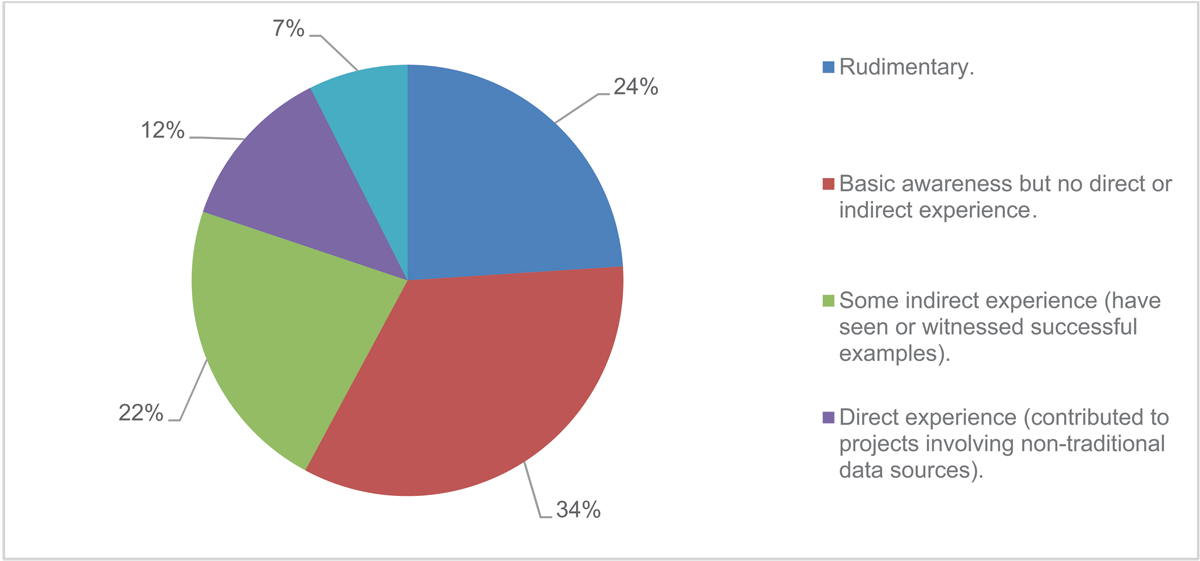
Figure 3
The degree of familiarity with nontraditional data sources (with administrative and Earth observation data excluded) among survey respondents as a percentage of total responses (n = 121).
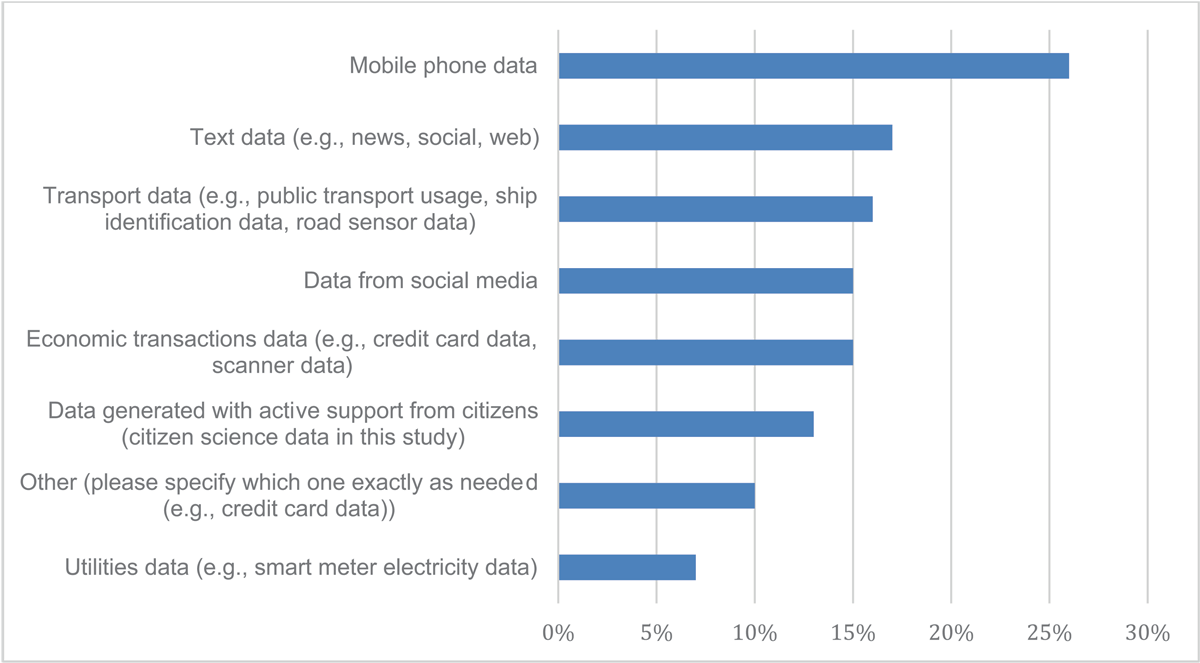
Figure 4
The types of nontraditional data sources that survey respondents have worked with, either directly or indirectly, as a percentage of the total number of respondents (n = 121).
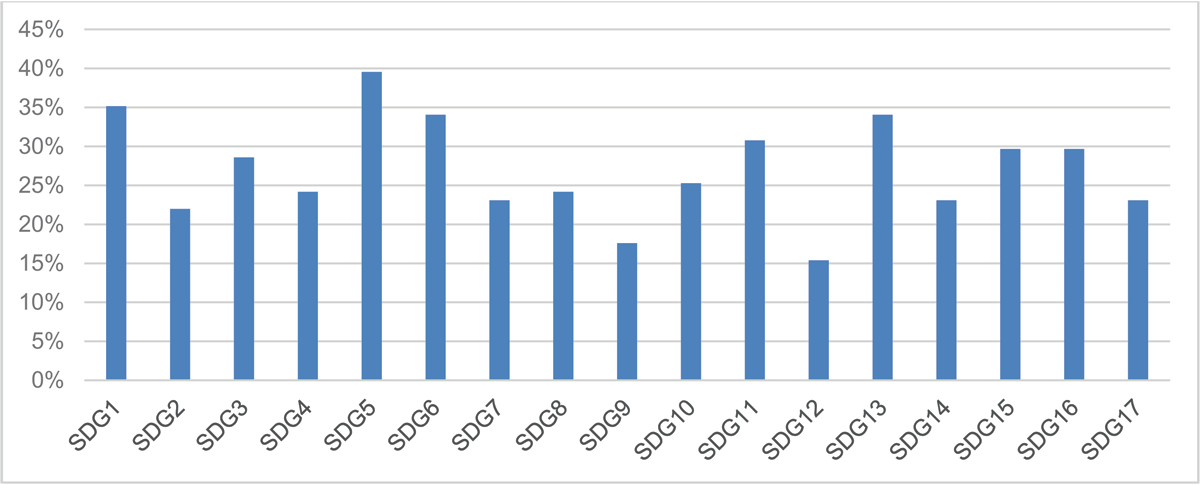
Figure 5
SDGs with indicators to which citizen science data could contribute identified by survey respondents as a percentage of the total number of responses (n = 91). SDG: Sustainable Development Goals.
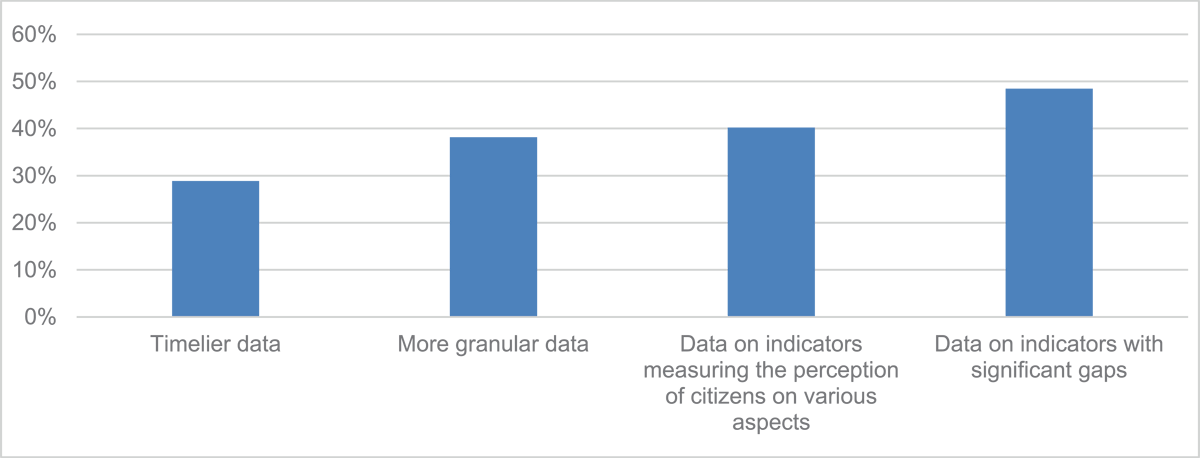
Figure 6
Ways in which citizen science data could be useful to NSSs identified by survey respondents as a percentage of the total number of responses (n = 91). NSS: National Statistical Systems.
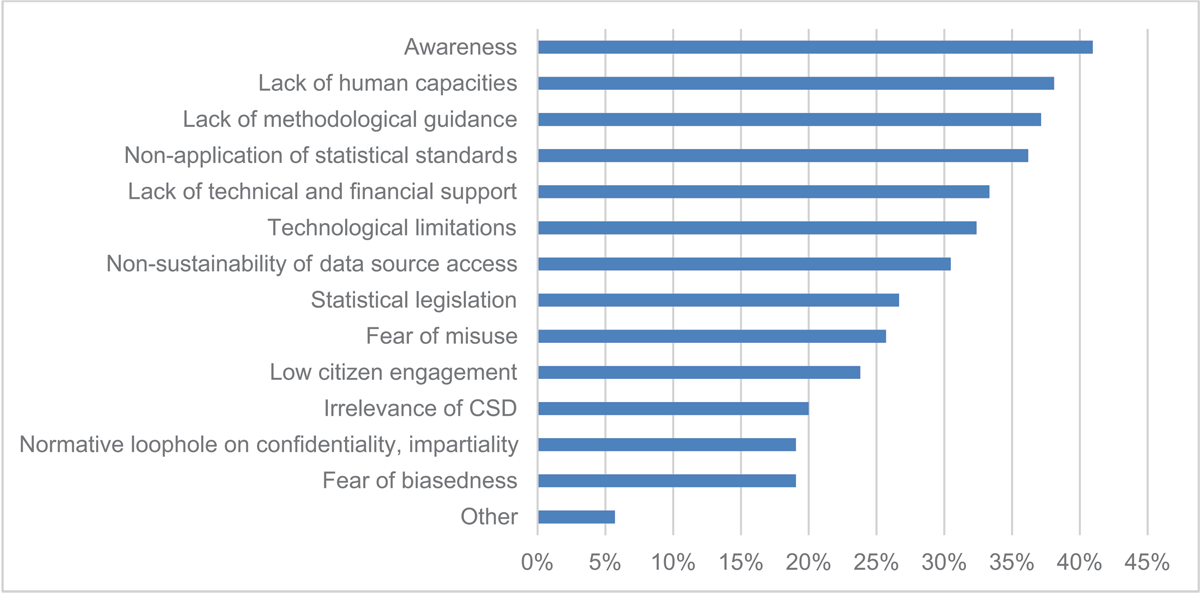
Figure 7
The perceived impediments to the use of data from citizen science by respondents with no experience as a percentage of the total number of responses (n = 105).
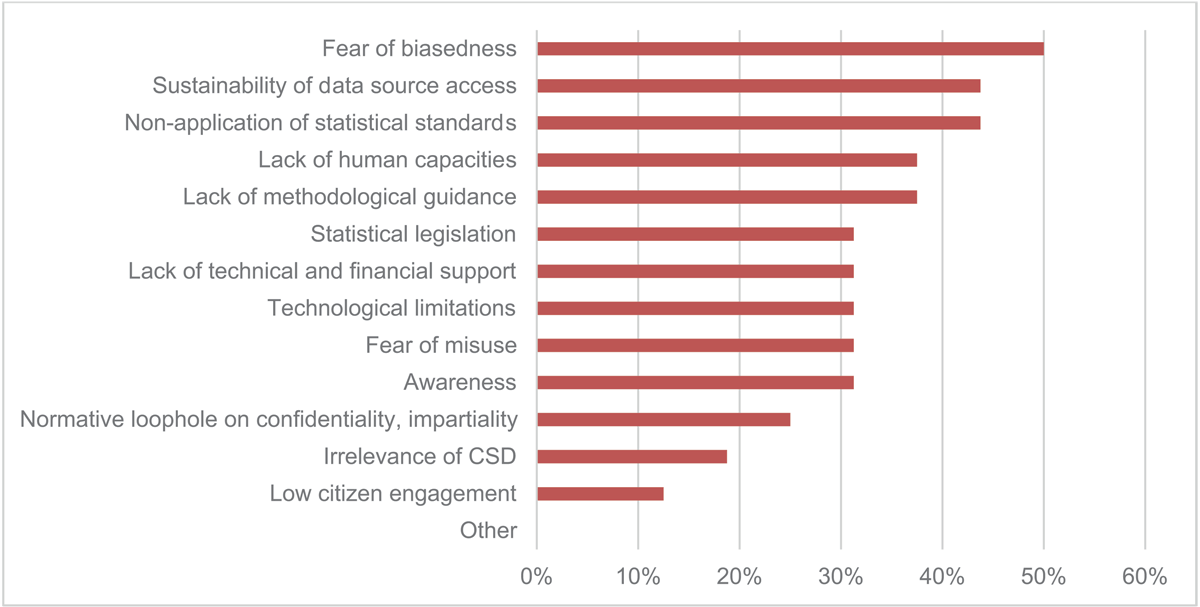
Figure 8
The identified impediments to the use of data from citizen science by respondents with experience in this area as a percentage of the total number of responses (n = 16).
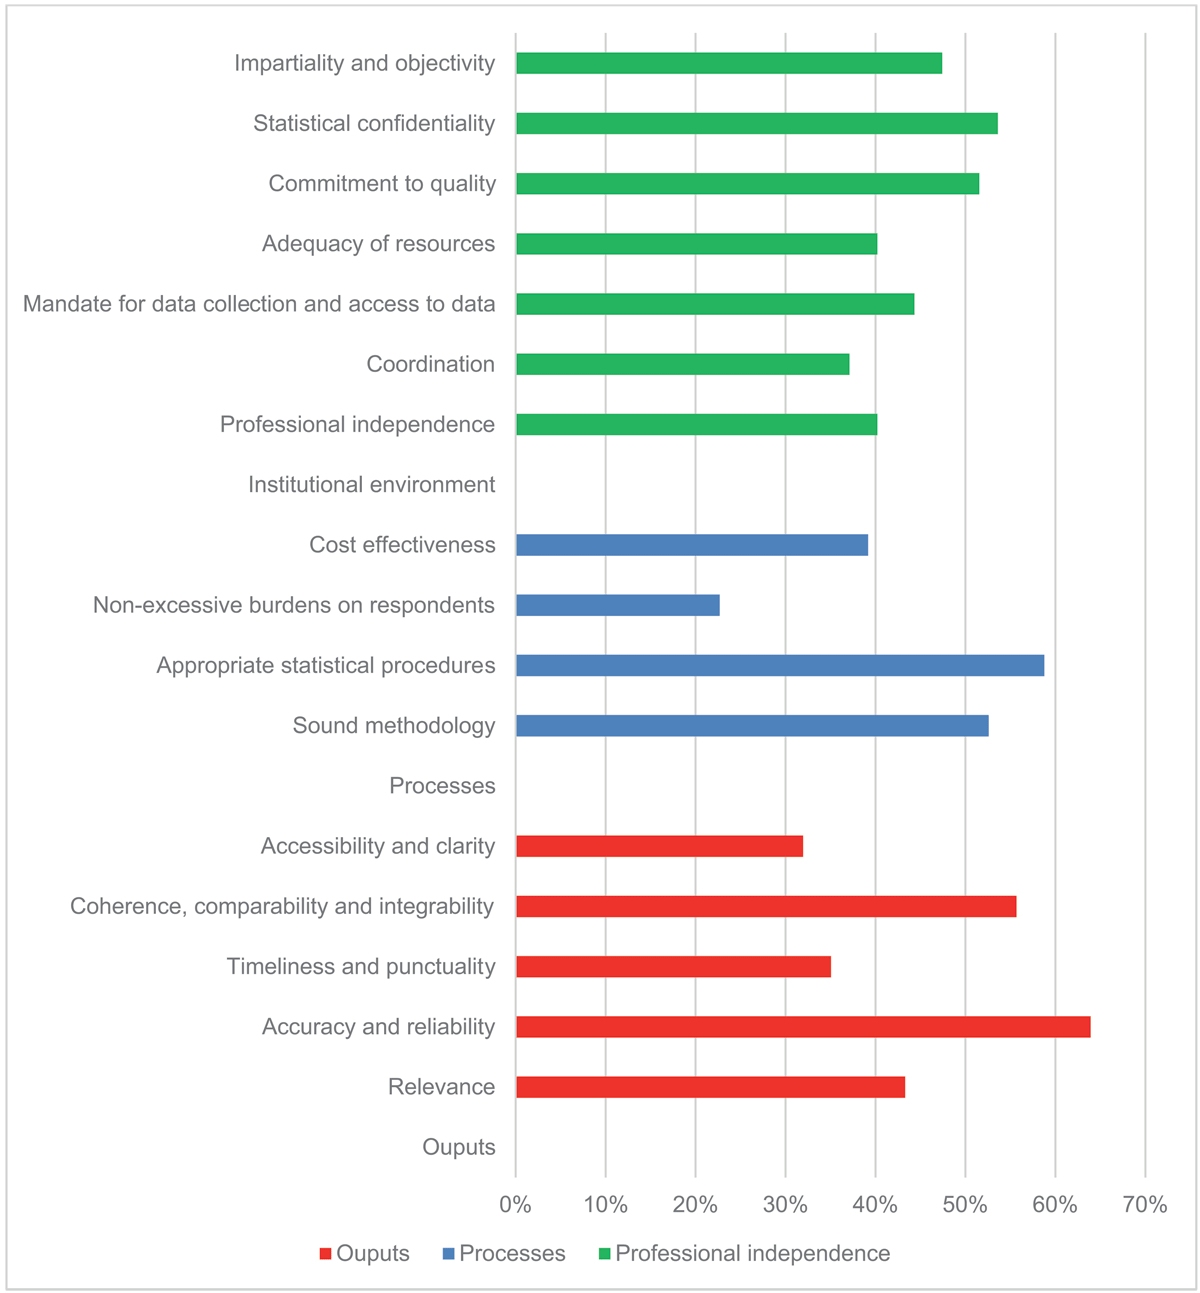
Figure 9
The types of quality issues that survey respondents expect may arise in citizen science projects, grouped into three categories: institutional environment, processes, and outputs, as a percentage of the total number of responses (n = 91).
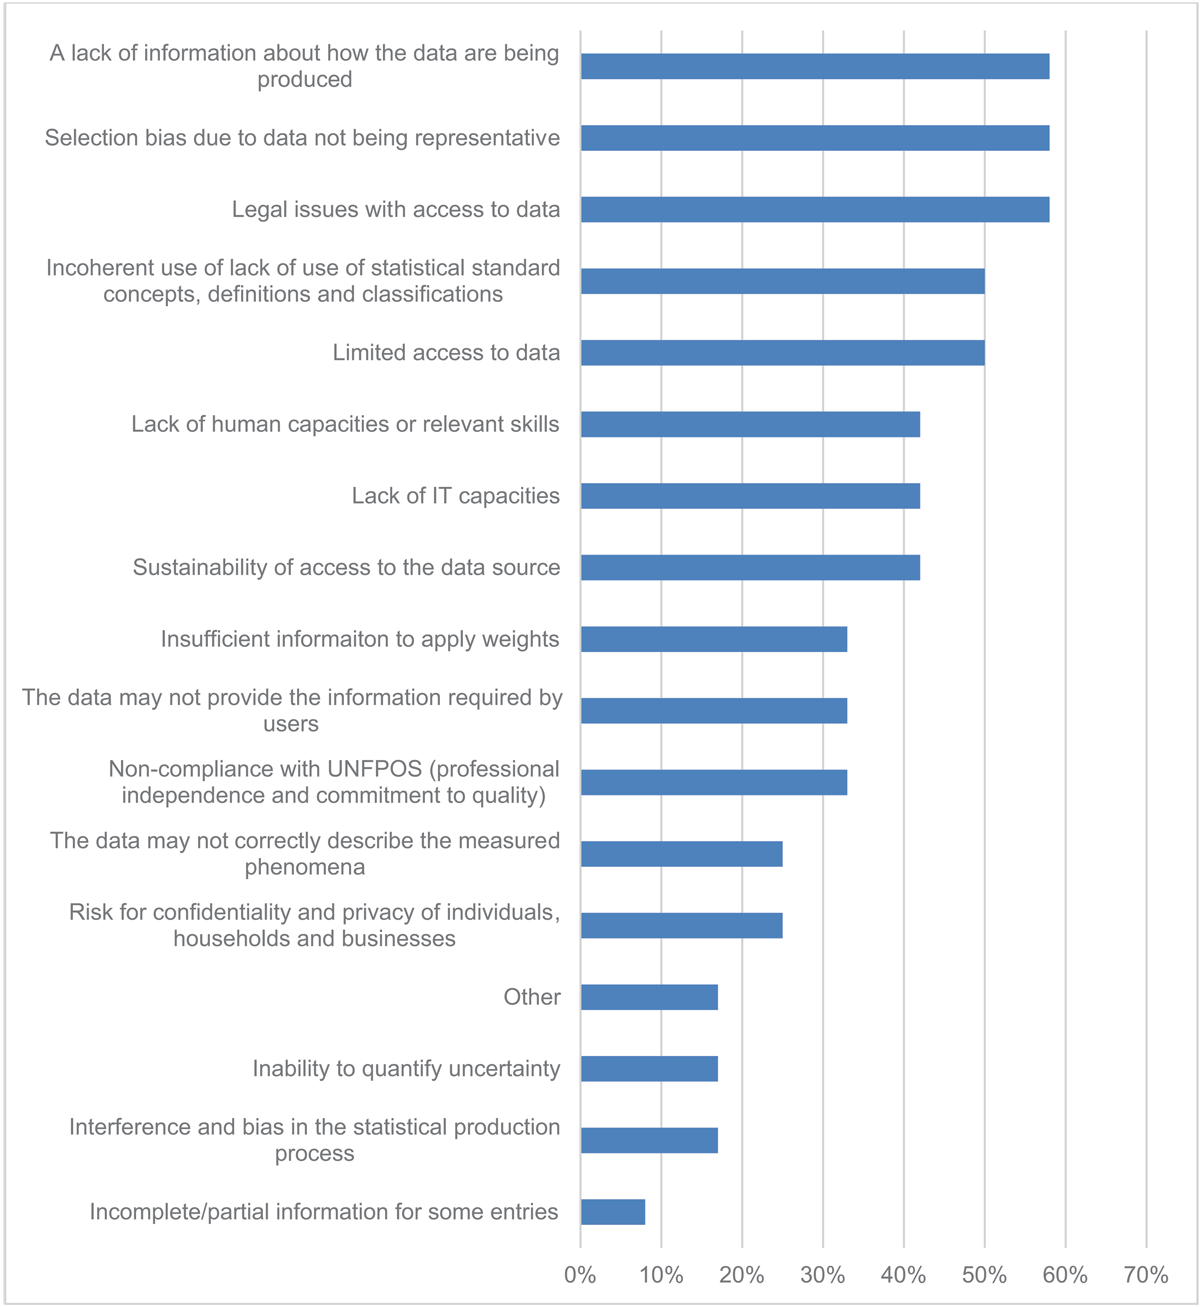
Figure 10
Challenges encountered with regards to the quality of data generated by the citizen science projects run by the organizations of the survey respondents (n = 12).