
Table 1
Manufacturing date, usage, and light and sound sensor data for the iPhone 6S, Samsung Note 5, and Samsung Galaxy S8.
| iPhone 6s | Samsung Note 5 | Samsung Galaxy S8 | |
|---|---|---|---|
| Release date | September 9, 2015 | August 13, 2015 | April 21, 2017 |
| Phones in circulation | 773 million (ca 2015) | 11 million (ca 2017) | Over 20 million |
| Operating system | iOS 11.2.5 (2018) | Android v5.1.1 (Lollipop) | Android 8.8.0 |
| Camera | 12.2 megapixel f/2.2 | 16 megapixel f/1.9 | 12.2 megapixel f/1.7 |
| Camera array | Sony iSight 1.22 µm pixels | SonyExmor RS-IMX240 1.2 µm pixels | LSI S5K2L2 or Sony IMX333, 1.4 µm pixels. |
| Microphone | Knowles 530&532/D5307 | Knowles electret | Knowles electret |
| Light sensor | AMS #TSL2586 | AMS TMD4903 | AMS #TMD4906 |
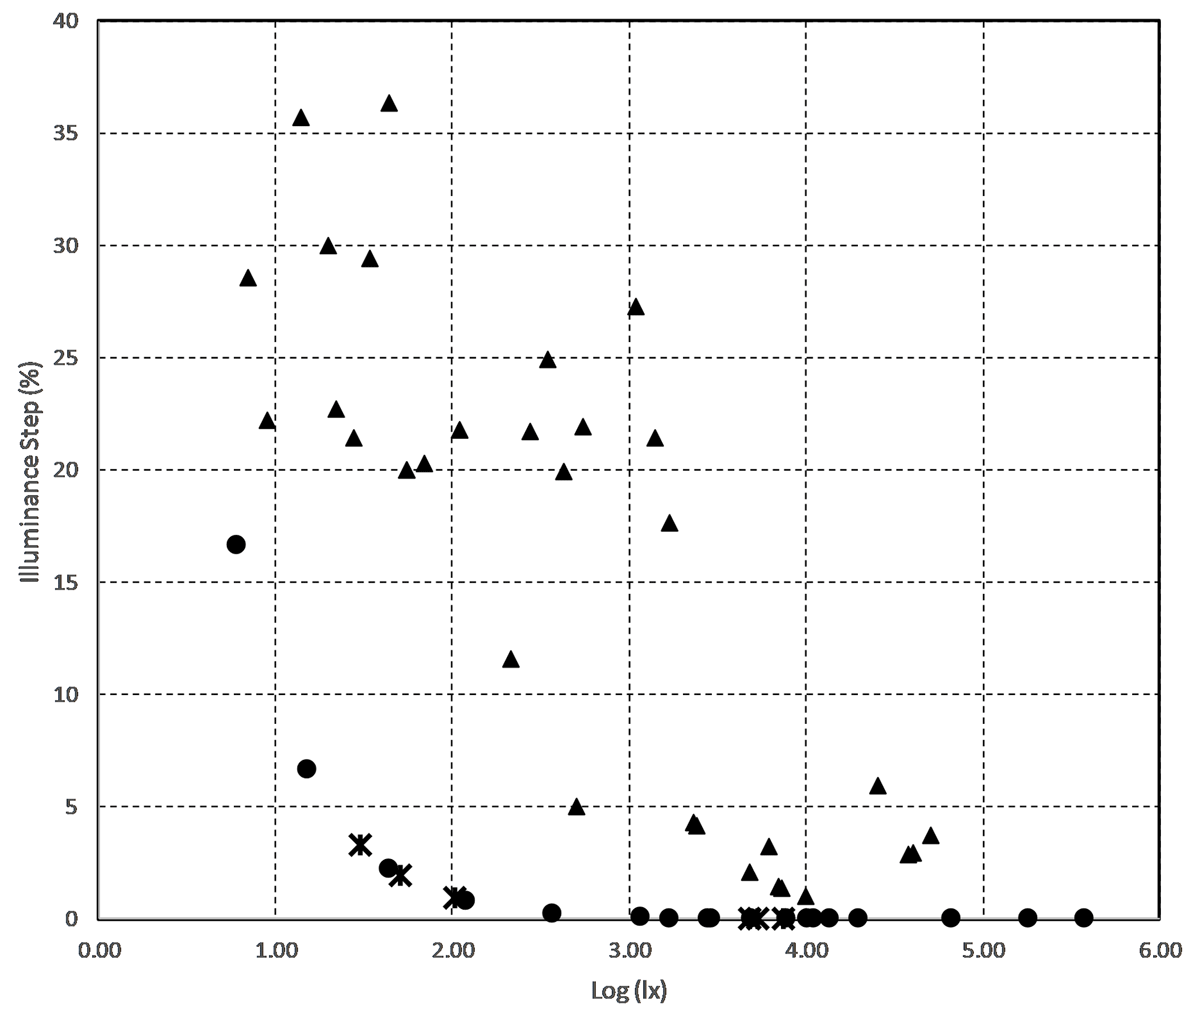
Figure 1
The percentage change of the measurement step interval to applied illuminance for the camera-based iOS apps: Galactica (triangle), Light Meter by Polyanskaya (asterisk), and the sensor-based Android app Light Meter by WBPhoto (dot).
Table 2
Comparisons of standard light-meter readings with two Samsung phones models for three light levels.
| Three light conditions for the LM and Lux Apps | Extech meter (lx) | Extech meter (lx) | Samsung S8 (lx) | Samsung Note 5 (lx) |
|---|---|---|---|---|
| Direct | Reflected | N = 4 | N = 4 | |
| Twilight | ||||
| LM (incident) | 2.0 | 1.0 | 7± 1 | 9.5± 0.5 |
| Lux (reflected) | 2.0 | 1.0 | 1.5± 0.5 | 0.5± 0.5 |
| Albedo | 0.24 | 0.05 | ||
| Indoor daylight | ||||
| LM (incident) | 114 | 81 | 117± 1.5 | 112 |
| Lux (reflected) | 114 | 81 | 100± 3.7 | 67± 7 |
| Albedo | 0.85 | 0.6 | ||
| Outdoor shade | ||||
| LM (incident) | 16,300 | 11,600 | 27,000± 1000 | 29,200± 870 |
| Lux (reflected) | 16,300 | 11,600 | 11,000± 680 | 11,100± 570 |
| Albedo | 0.41 | 0.38 | ||
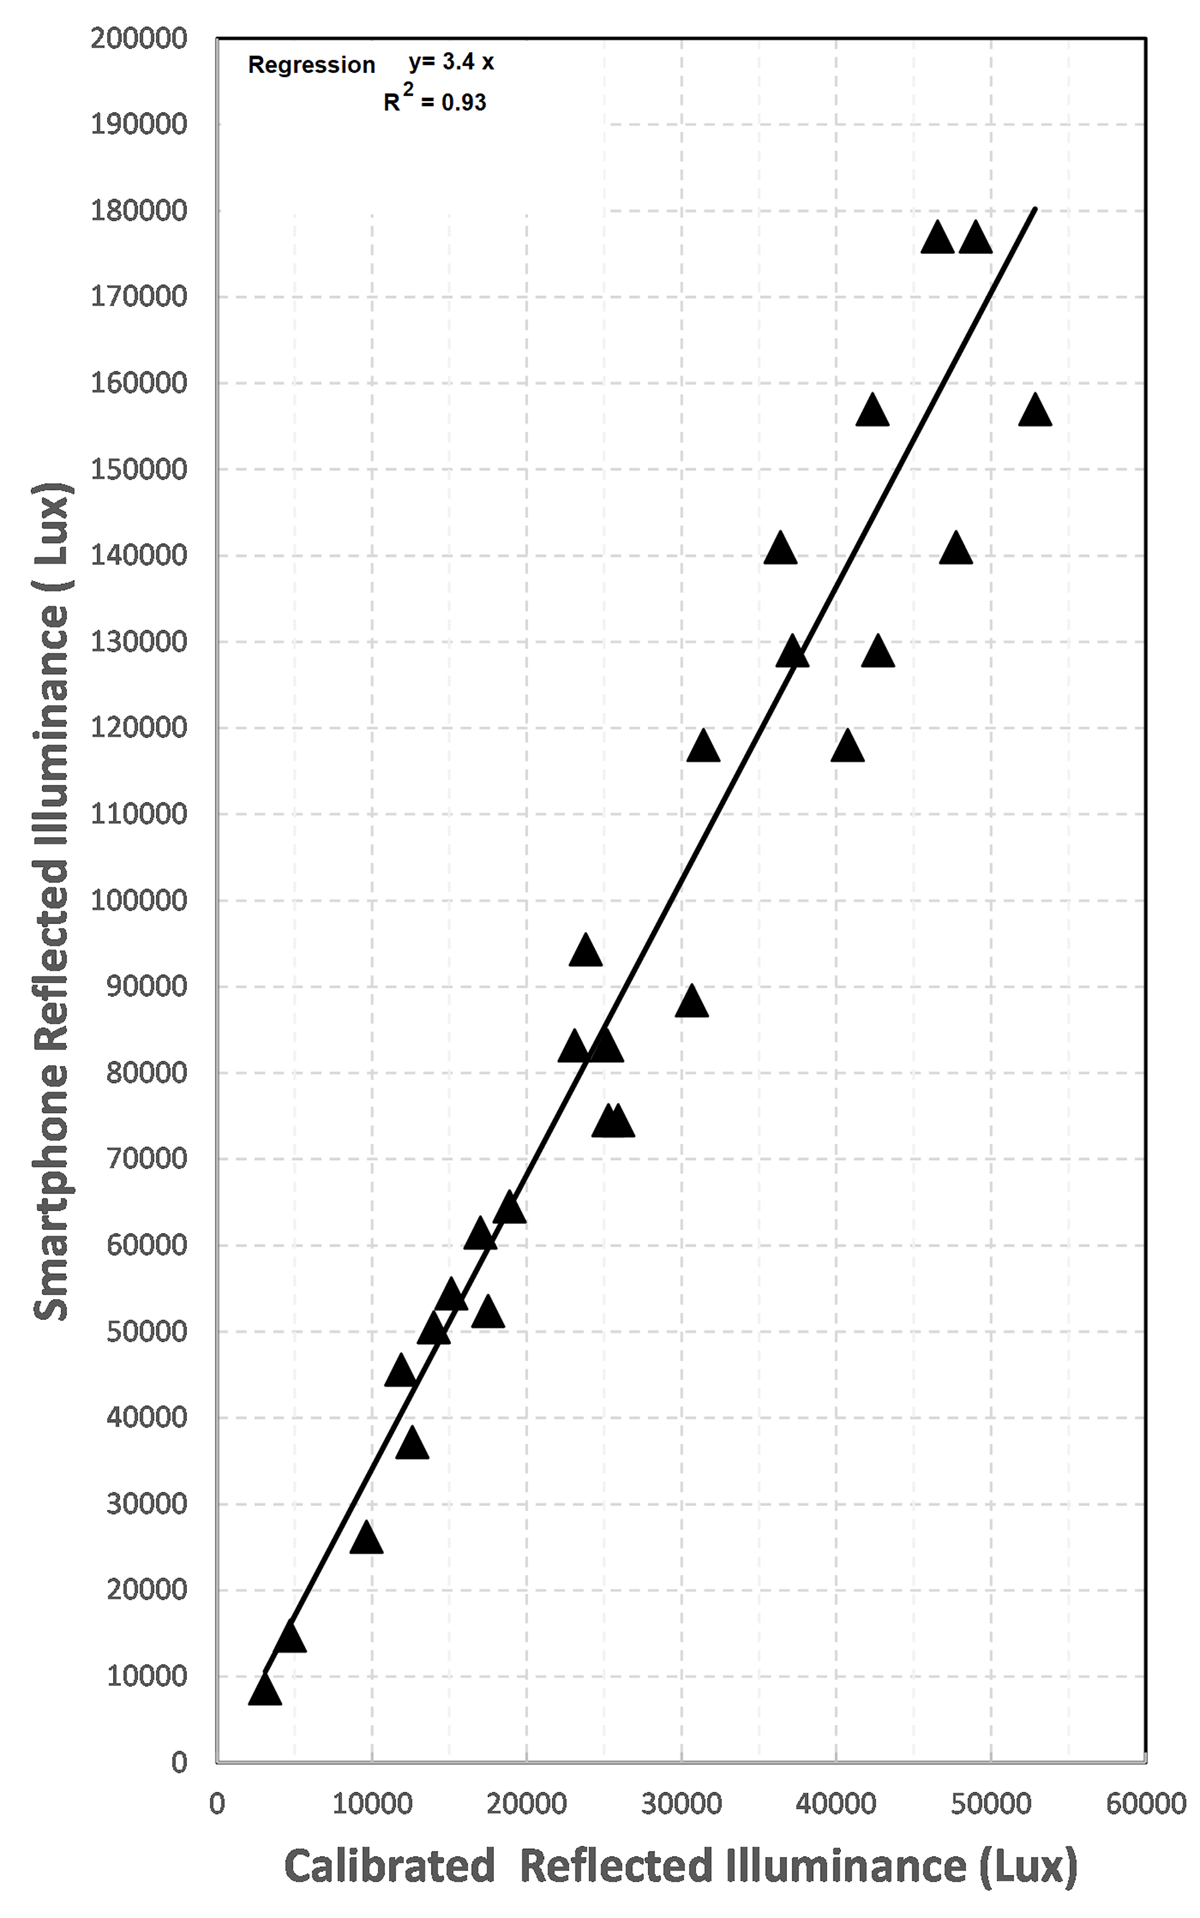
Figure 2
Comparison of reflected illuminance levels between calibration (LT-300) and iPhone 6s camera-based Galactica app (triangle).
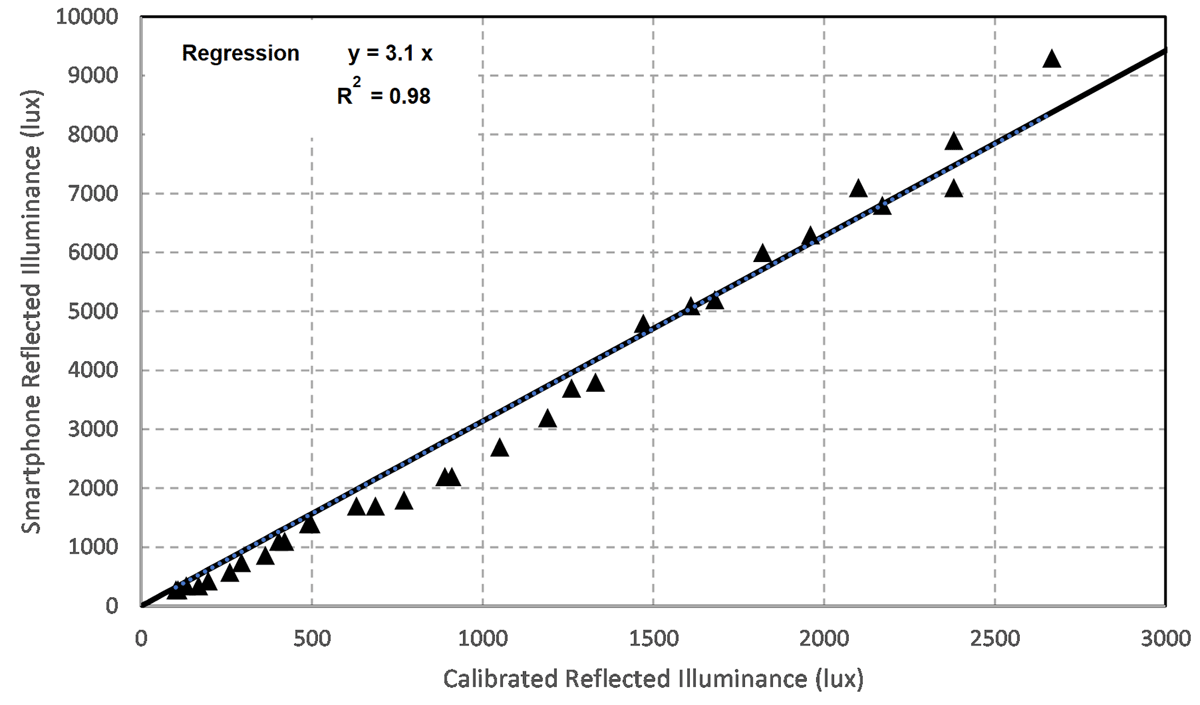
Figure 3
Data for Galactica (triangle) with linear regression forced to a 0 lx y-intercept to avoid an unphysical, negative illuminance as the y-intercept.
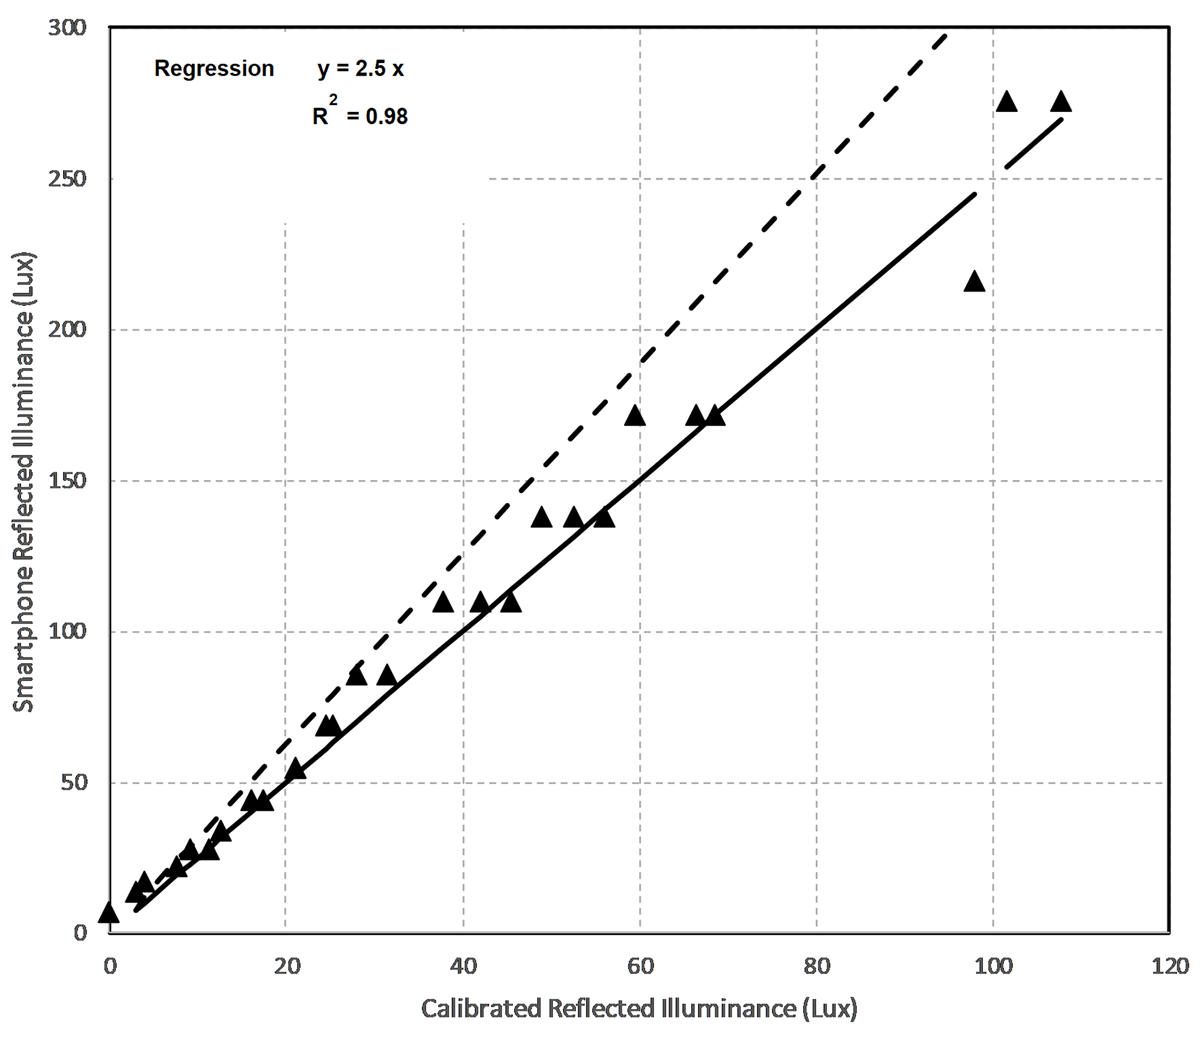
Figure 4
Data for Galactica (triangle). The regression curve (solid line) with linear regression forced to a 0 lx y-intercept to avoid an unphysical, negative illuminance as the y-intercept. Also shown is the regression used for the medium illuminance levels in Figure 3 (dashed).
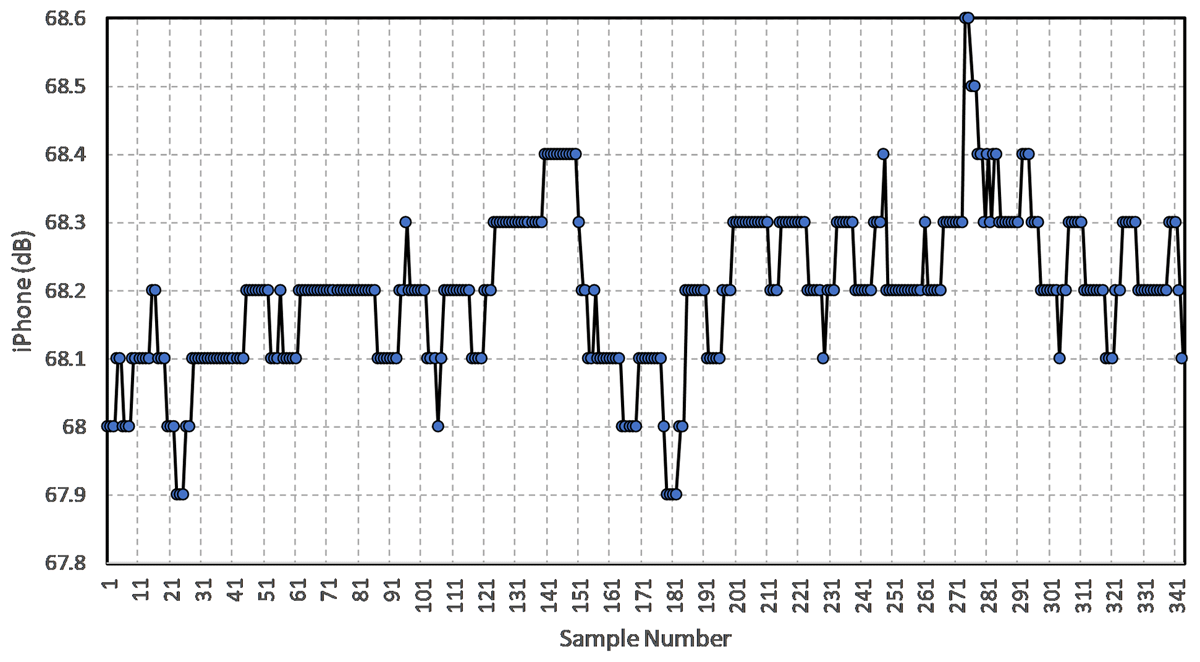
Figure 5
Representative fixed sound intensity data for the iPhone 6s with samples every 0.2 seconds. <S> = 68.2 ± 0.11 dB.
Table 3
Sound comparisons with Samsung phones.
| Sound Source | Galaxy S8 | Note 5 | |||||||
|---|---|---|---|---|---|---|---|---|---|
| BK-Meter | A | B | C | D | E | F | G | H | |
| Quiet room | 29.8 | 30.3 | 29.9 | 32.9 | 29.9 | 50.9 | 50.2 | 50.6 | 37.0 |
| Inside idling car | 55.0 | 60.5 | 61.2 | 62.3 | 61.5 | 82.0 | 82.2 | 82.4 | 68.6 |
| Electric lawn mower | 89.2 | 82.1 | 77.0 | 78.5 | 76.8 | 104.5 | 105.0 | 105.5 | 91.3 |
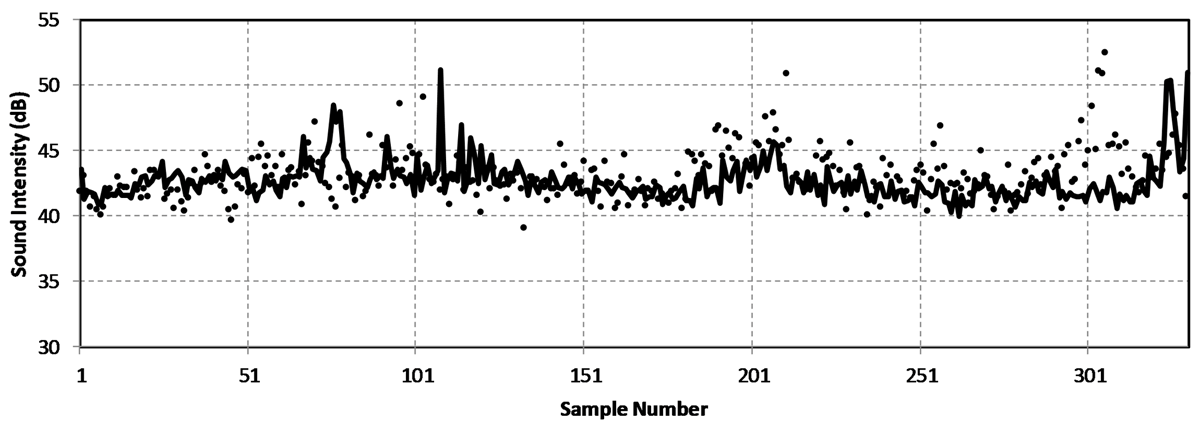
Figure 6
Quiet environment data for Decibel 10th comparison. Solid curve is the Samsung Note 5 and dots are the iPhone 6s. Sampling interval is 0.2 seconds.
Table 4
Acoustic levels measured on an iPhone 6s at a variety of locations.
| Source | Decibel meter | Decibel level | Decibel sound meter | Decibel-10th |
|---|---|---|---|---|
| Summit of Mt. Greylock | 63 | 65 | 38 | 39 |
| Quiet room | 58 | 59 | 30 | 43 |
| Toyota Corolla engine | 75 | 76 | 55 | 65 |
| Jet plane interior | 92 | 88 | 70 | 86 |
| Electric lawn mower | 89 | 86 | 70 | 86 |
| Jack hammer @ 10 meters | 89 | 67 | 73 | 86 |
| Queen rock concert | 95 | 85 | 75 | 109 |

Figure 7
iPhone 6s (dot), Samsung Note 5 (square) and Galaxy S8 (triangle). The smartphone data obtained by the Decibel 10th app has been shifted by: Note 5 (–12 dB), Galaxy S8 (+5 dB), and iPhone (–8 dB) to place them as close as possible to the same linear regression calibration curve (solid line).