
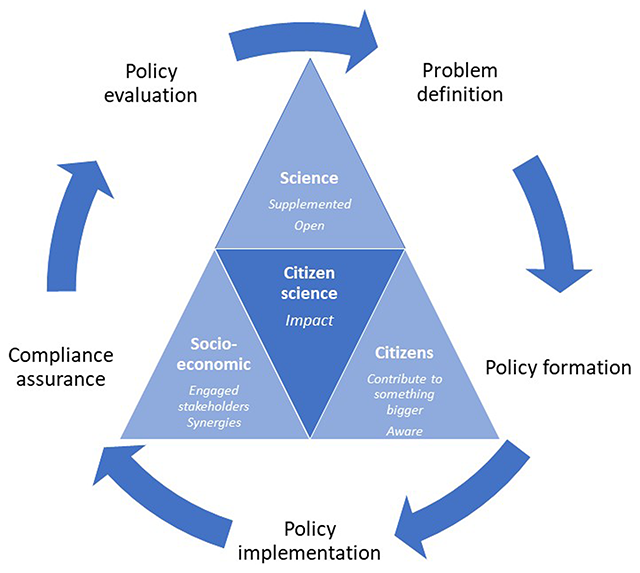
Figure 1
The three key dimensions of citizen science (citizen scientist, scientific, socio-economic) interact with the policy process to generate impact and improve policy relevance. Citizen science can contribute to each step of the policy process: Problem definition (identification of new environmental issue or formulation of new hypothesis about known issues); Policy formation (definition of the structure of the policy); Policy implementation and monitoring (putting into effect policies or describing their implementation); Compliance assurance (measures to promote, monitor, and enforce compliance with existing environmental regulation, such as through awareness raising, inspections, fines, and warnings); Policy evaluation (assessing the outcomes of policy interventions).
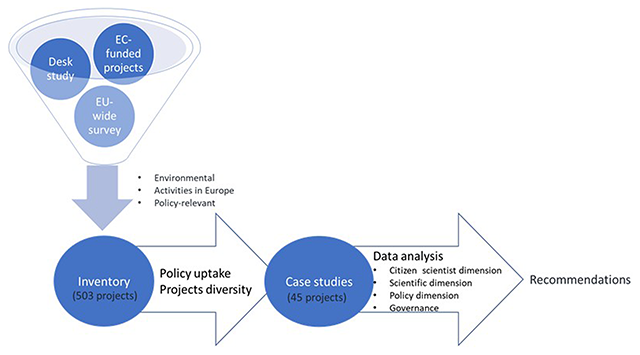
Figure 2
Workflow used to identify citizen science initiatives for the inventory and to select environmental citizen science case studies that have high policy relevance and represent a diversity of environmental areas to be used for in-depth analysis.

Figure 3
Coverage of environmental domains by the citizen science initiatives in the inventory. The size of the squares represents the share of citizen science initiatives in each environmental domain.
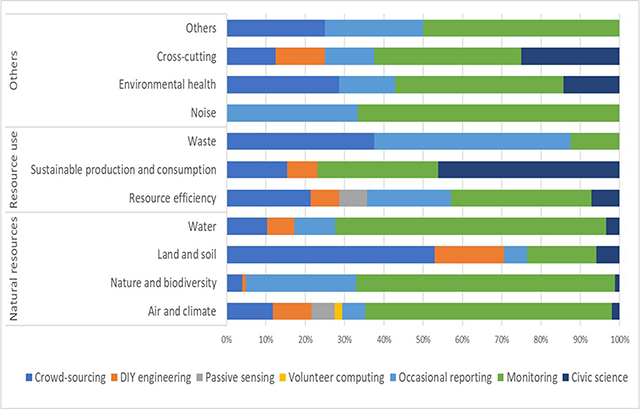
Figure 4
Share of the different types of citizen science projects in the inventory by main environmental domain.
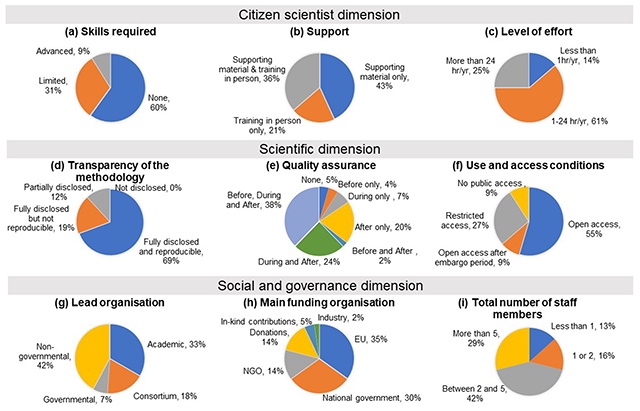
Figure 5
Characterisation of the policy-relevant citizen science case studies along the three dimensions of citizen science. Citizen scientist dimension: levels of (a) skills, (b) training, and (c) effort required; Scientific dimension: levels of (d) transparency, (e) quality assurance, and (f) use and access conditions; Socio-economic dimension: including (g) lead organisation type, (h) main funding organisation, and (i) total number of staff members (FTE).
Table 1
Effect sizes and standard errors of minimum adequate models explaining the impact on the citizen scientist dimension (1 – Number of participants), scientific dimension (2 – Number of peer-reviewed publications) and policy dimension (3 – Policy uptake), and 4 – (Diversity of policy phases used) for the case studies.*
| Attributes | 1 – Number of participants (Log+1) | 2 – Number of peer-reviewed publications (Log + 1) | 3 – Policy uptake | 4 – Diversity of policy phases used | ||
|---|---|---|---|---|---|---|
| Linear model, n = 39 (R2 = 38%) | Linear model, n = 33 (R2 = 75%) | Binomial model, n = 39 (R2 = 12%) | Linear model, n = 39 (R2 = 27%) | |||
| Intercept | 2.35 ± 0.61*** | –0.77 ± 0.26 | 4.91 ± 2.59. | –0.48 ± 0.83 | ||
| General characteristics | Project category | Crowd-sourcing (reference) | – | NS | NS | NS |
| Monitoring | 1.34 ± 0.57* | – | – | – | ||
| Occasional reporting | 0.31 ± 0.64 | – | – | – | ||
| Other | –0.60 ± 0.76 | – | – | – | ||
| Age of the project | NS | 0.00 ± 0.00. | 0.08 ± 0.07* | NS | ||
| Spatial extent (n countries) | 0.01 ± 0.01. | 0.00 ± 0.00* | NS | 0.02 ± 0.01* | ||
| Citizen scientist dimension | Number of records (Log + 1) | Not in model | 0.28 ± 0.04*** | Not in model | Not in model | |
| Index Ease of engagement | NS | Not in model | –2.43 ± 1.46* | NS | ||
| Social media page | No | NS | Not in model | Not in model | Not in model | |
| Yes | – | – | – | – | ||
| Scientific dimension | Index of scientific quality | Not in model | NS | NS | 0.16 ± 0.11 | |
| Access conditions | None | Not in model | NS | Not in model | Not in model | |
| Restricted | – | 0.18 ± 0.22 | – | – | ||
| Open | – | 0.35 ± 0.21* | – | – | ||
| Governance aspects | Lead organisation | Academic (reference) | – | NS | NS | NS |
| Consortium | –0.05 ± 0.51 | – | – | – | ||
| Governmental | –2.65 ± 0.80** | – | – | – | ||
| Non-governmental | –0.11 ± 0.40 | – | – | – | ||
| Personnel | 2 or less | NS | Not in model | Not in model | Not in model | |
| More than 2 | – | – | – | – | ||
| Academic endorsement | No | NS | – | NS | – | |
| Yes | – | 0.26 ± 0.17* | – | 1.26 ± 0.54* | ||
| Governmental endorsement | No | Not in model | Not in model | NS | NS | |
| Yes | – | – | – | – | ||
[i] * Significance levels are shown: . p < 0.1, * p < 0.05, ** p < 0.01, *** p < 0.001, NS p > 0.1. Not in model signals variables that were omitted during the model selection process.
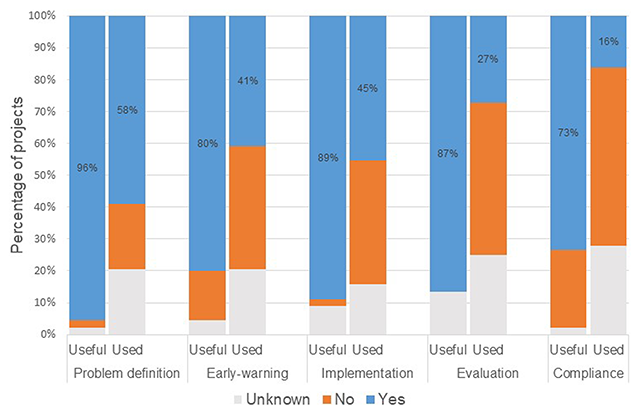
Figure 6
Comparison of potential and realised contributions to policy. Distribution of answers (Yes, No, Unknown) to the question of whether a given citizen science project had the potential to be useful for policy or was effectively used for policy. For instance, whereas 96% of respondents thought their project could contribute to problem definition, only 58% of projects actually did so.

Figure 7
Factors affecting the impact of citizen science initiatives on the policy dimension, based on the 45 case studies. (a) Policy uptake (mean ± SE) significantly increases with ease of engagement. Projects contribute to significantly more policy phases when (b) they have high scientific standards and (c) receive academic endorsement. Predicted means and standard errors are from the linear models.

Figure 8
Importance attributed by survey respondents of the case studies to (a) different challenges potentially preventing linking citizen science projects to policy and (b) opportunities to be gained from successfully linking to policy. Bars represent different barriers/opportunities, and shading differentiates the four dimensions (citizen-scientist, scientific, socio-economic, and policy).