
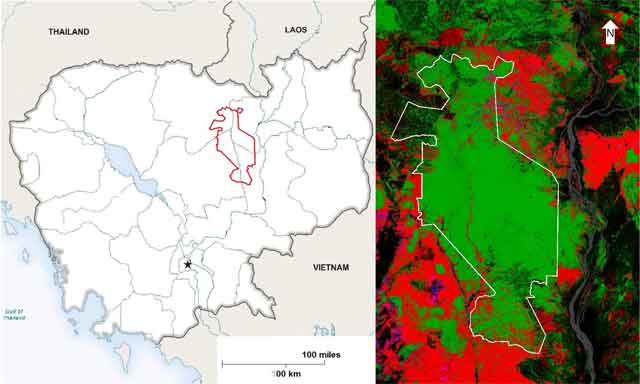
Figure 1
Cambodia’s Prey Lang Wildlife Sanctuary (left) and classified satellite image (right) showing forest loss in years 2000 to 2016 (red), forest cover in 2016 (green), forest gain in years 2000 to 2016 (blue), both gain and loss in years 2000 to 2016 (purple), and other land uses (black). An asterisk shows the location of the capital city, Phnom Penh. Source: Global Forest Watch – University of Maryland; Hansen et al. 2013.
Table 1
Data on forest crimes and forest resources collected by the Prey Lang Community Network in Prey Lang, Cambodia, using the Prey Lang app from 1 Feb. 2015 till 31 Jan. 2017. Data are shown within the three main categories: Illegal activities (top), existing resources and biodiversity (middle), and interactions with authorities (bottom). For each category is shown the number of validated, human error rejected, and technical error rejected entries, along with the number of submitted entries (validated entries + human error rejected entries) and total entries (submitted entries + technical error rejected entries). % are percentages of the total number of entries.
| Validated | Human error | Submitted entries | Technical error | Total entries | ||||||
|---|---|---|---|---|---|---|---|---|---|---|
| n | % | n | % | n | % | n | % | n | % | |
| Logging evidence | 1,848 | 17.0 | 569 | 5.2 | 2,417 | 22.3 | 2,125 | 19.6 | 4,542 | 41.9 |
| Logging interactions | 98 | 0.9 | 78 | 0.7 | 176 | 1.6 | 298 | 2.7 | 474 | 4.4 |
| Mining, hunting and fishing | 35 | 0.3 | 37 | 0.3 | 72 | 0.7 | 192 | 1.8 | 264 | 2.4 |
| Standing timber | 2,097 | 19.3 | 335 | 3.1 | 2,432 | 22.4 | 1,750 | 16.1 | 4,182 | 38.6 |
| Biodiversity | 363 | 3.3 | 24 | 0.2 | 387 | 3.6 | 205 | 1.9 | 592 | 5.5 |
| Reporting to authorities | 87 | 0,8 | 46 | 0.4 | 133 | 1.2 | 244 | 2.3 | 377 | 3.5 |
| Other | 32 | 0.3 | 214 | 2.0 | 246 | 2.3 | 165 | 1.5 | 411 | 3.8 |
| Total | 4,560 | 42.1 | 1,303 | 12.0 | 5,863 | 54.1 | 4,979 | 45.9 | 10,842 | 100 |
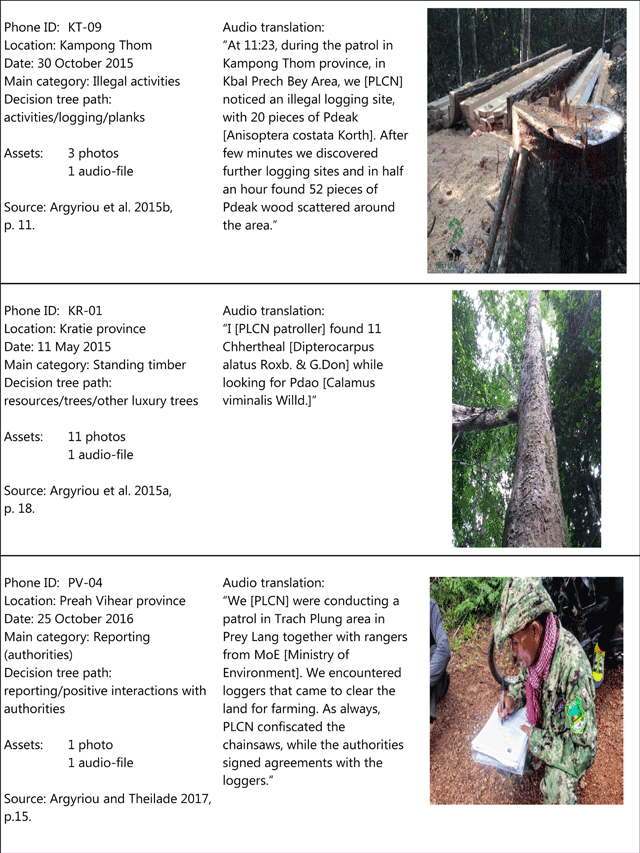
Figure 2
Three examples of validated data entries from the database about forest crimes and forest resources in Prey Lang, Cambodia, from each of the three main categories: Illegal activities, existing resources, and interactions with the authorities.
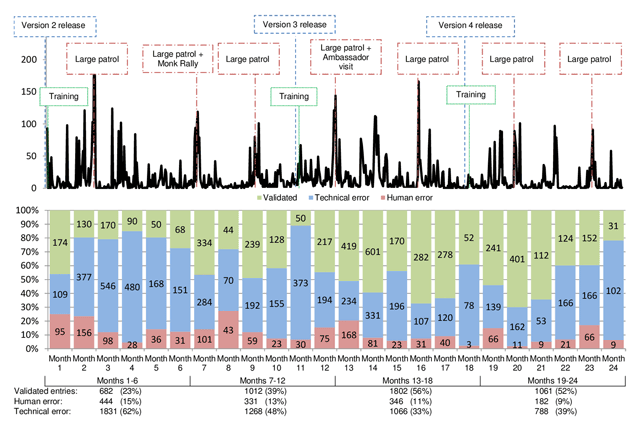
Figure 3
Data on forest crimes and forest resources collected by Prey Lang Community Network in Prey Lang, Cambodia, 2015–2017 (N = 10,842 entries). The black line (top) shows the total number of entries recorded per day within each month and the timing of app version releases (blue), large organized patrols (red), and training sessions (green). Bars show monthly percentages (%) of valid entries (green), entries excluded because of human error (blue), and entries excluded because of technical error (red), with the number of entries (n) within the three categories labeled on each bar.
Table 2
Changes that have occurred within the 4 versions of the Prey Lang App in Prey Lang, Cambodia, 2015–2017. Shown are the number of unique decision tree end points available; the number of unique basic functions used (i.e., push button, drop down menu, camera, audio recording); the percentage of valid entries; the percentage of entries rejected due to human errors; and the percentage of entries rejected due to technical errors within the operation period for the associated version of the app. See also Appendix 1B, supplemental materials.
| Operation period | Version 1 | Version 2 | Version 3 | Version 4 |
|---|---|---|---|---|
| None | Month 1–Month 11 | Month 11–Month 18 | Month 18–Month 24 | |
| Total unique decision tree end points | 34 | 614 | 1663 | 1663 |
| Total unique basic functions | 4 | 9 | 9 | 10 |
| Percent valid entries | 31% | 50% | 52% | |
| Percent human error rejections | 14% | 10% | 8% | |
| Percent technical error rejections | 55% | 40% | 40% |
Table 3
Entries on forest crimes and forest resources in Prey Lang, Cambodia, recorded by age groups and gender (N = 36 persons). Shown are average number of total entries of data per patroller and average proportion of valid entries out of submitted entries per age group and gender in the community monitoring program February 2015 to January 2017.
| Age group | N | Average number of total entries (std. dev.) | Average percent of submitted entries validated (std. dev.) |
|---|---|---|---|
| 19–24 | 9 | 212 (103) | 71.5 (13.9) |
| 25–35 | 9 | 256 (136) | 74.0 (11.5) |
| 36–51 | 9 | 341 (148) | 84.4 (9.2) |
| 52–61 | 9 | 395 (367) | 70.4 (14.7) |
| Female | 6 | 189 (103) | 73.1 (11.7) |
| Male | 30 | 324 (230) | 75.5 (13.7) |
Table 4
Costs of the community-based monitoring program with use of ICT in Prey Lang, Cambodia. Shown are actual costs incurred during the start-up phase (August 2014–January 2015) and in each of the two years of monitoring (February 2015–February 2017, in $US, as of September 2017). PLA, Prey Lang App. UCPH, University of Copenhagen.
| Start-up | 1st year | 2nd year | Total | |
|---|---|---|---|---|
| Development costs | 23,217 | 17,436 | 20,771 | 61,424 |
| PLA development (UCPH) | 17,047 | 4,106 | 4,106 | |
| PLA programming (IT company) | 6,170 | 13,330 | 16,665 | |
| Operating costs | 12,949 | 33,674 | 28,587 | 75,210 |
| PLA support (IT company) | 0 | 1,875 | 1,875 | |
| Data management (UCPH) | 952 | 9,521 | 9,521 | |
| Materials | 9,141 | 3,237 | 3,237 | |
| Training and consultation | 2,856 | 11,041 | 5,954 | |
| Patrolling | 0 | 8,000 | 8,000 | |
| 36,166 | 51,110 | 49,358 | 136,634 |
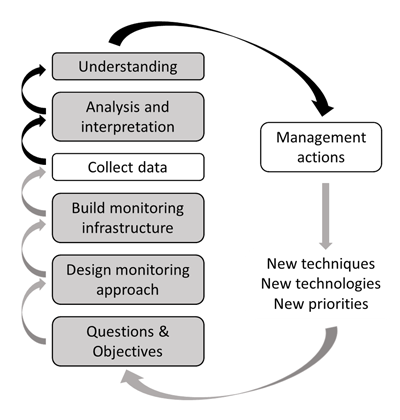
Figure 4
A schematic presentation of the community-based monitoring program in Prey Lang, Cambodia, showing where ICT facilitated the monitoring process (black arrows). Local community contributions are in white, and a combination of community and university scientist contributions are in grey. Adjusted from Brammer et al. 2016, based on the spectrum of stakeholder participation in environmental monitoring approaches (Danielsen et al. 2009; 2013b), mapped onto a modified adaptive-monitoring framework (Lindenmayer and Likens 2009).