
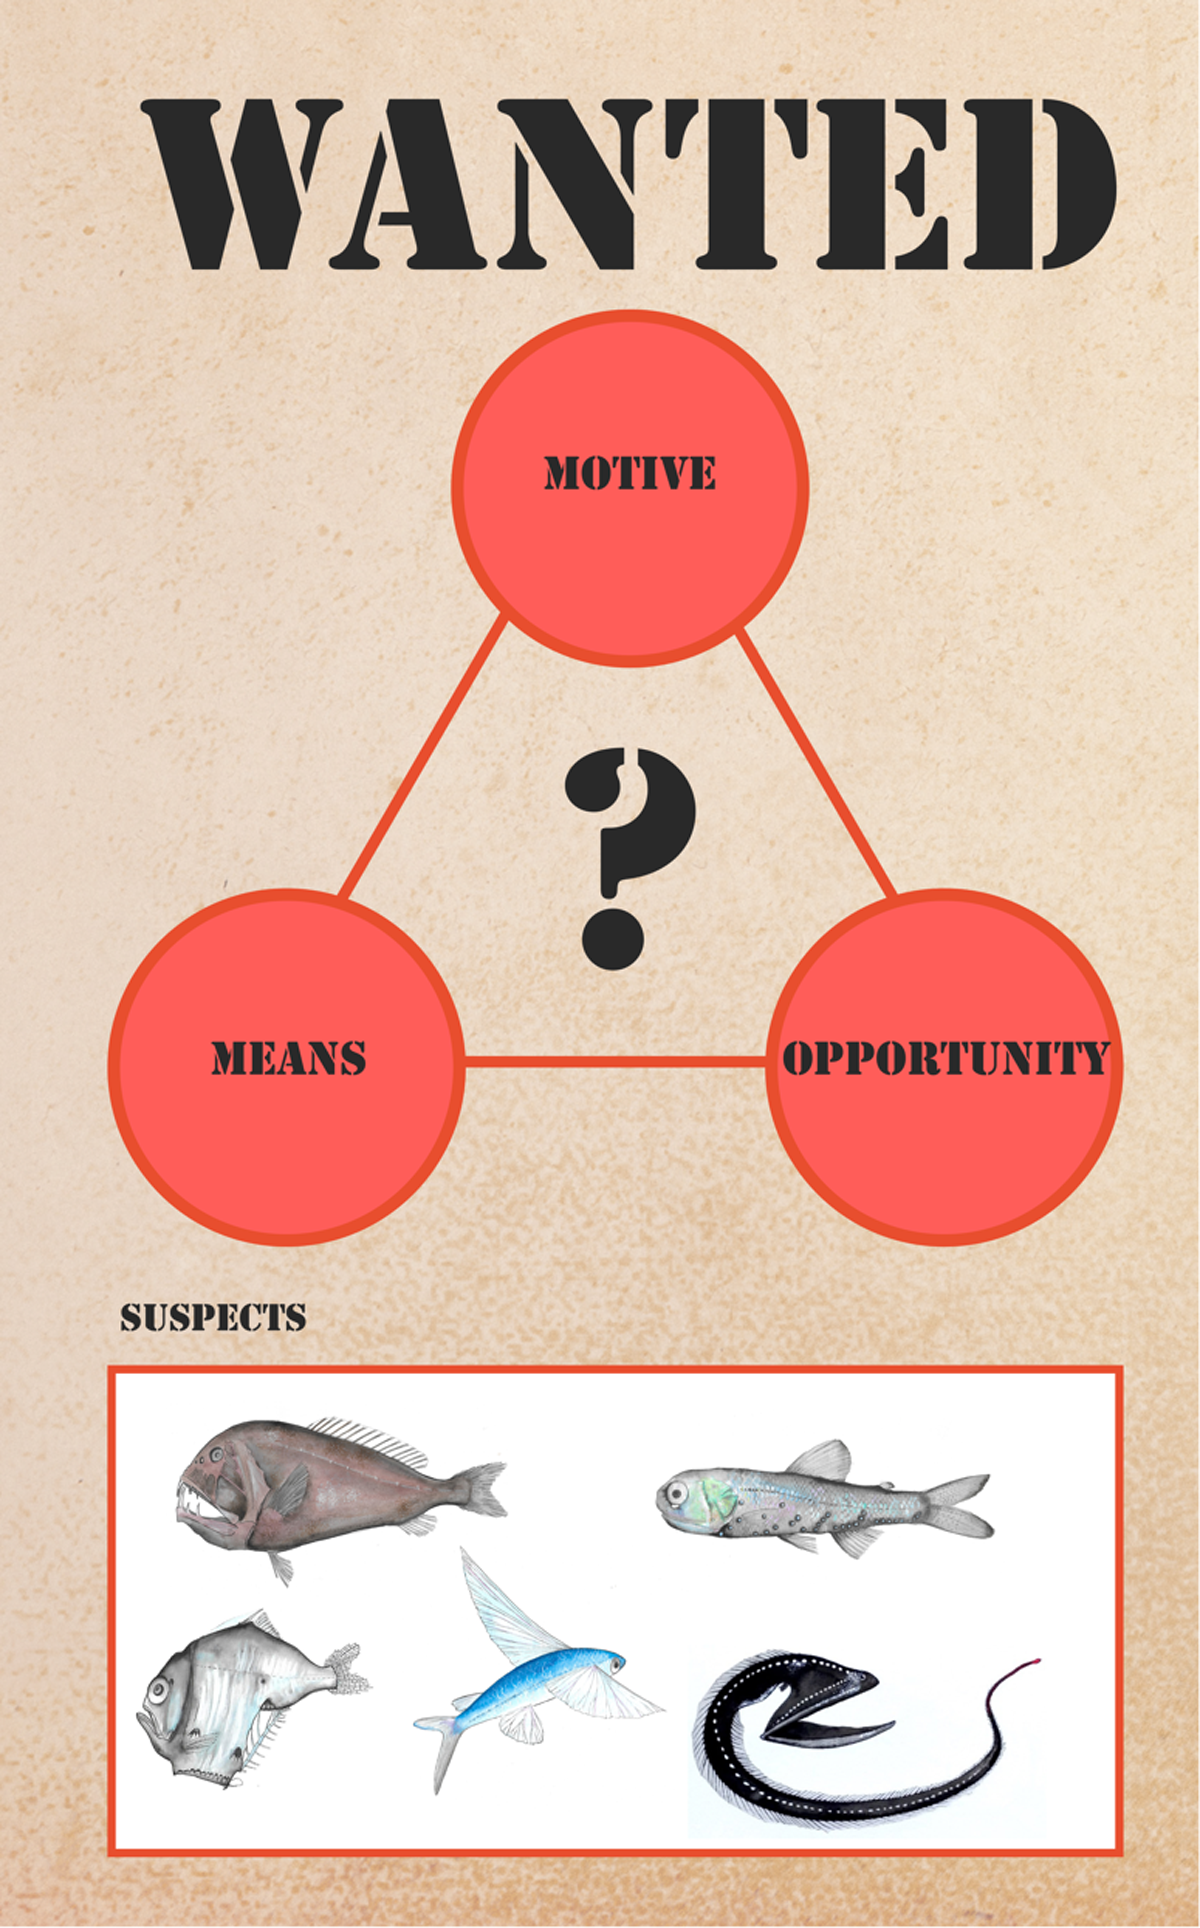
Figure 1
In this lesson plan, students will use ecological information about marine animals to solve a murder mystery, identifying motive, means, and opportunity for each animal suspect.

Figure 2
Diel (daily) vertical migration of animals from the Twilight Zone (200–1000 m) to the surface at dusk and descent to depth at dawn. Illustration by Kelly Lance, reprinted with permission.

Figure 3
A Multiple Opening/Closing Net and Environmental Sensing System (MOCNESS) is deployed off the side of the Research Vessel Roger Revelle during a NASA-funded research cruise. Each MOCNESS net samples a different depth zone of the water column; when one net closes, another automatically opens. Photo credit: NASA.
Table 1
Relevant standards (Ocean Literacy and Next Generation Science Standards) and lesson objectives.
| Next Generation Science Standards | MS-LS2–2. Construct an explanation that predicts patterns of interactions among organisms across multiple ecosystems. HS-LS2–2. Use mathematical representations to support and revise explanations based on evidence about factors affecting biodiversity and populations in ecosystems of different scales. |
| Ocean Literacy Principles | OLP-5D: Ocean biology provides many unique examples of life cycles, adaptations and important relationships among organisms that do not occur on land. OLP-5E: The ocean provides a vast living space with diverse and unique ecosystems from the surface through the water column and down to, and below, the seafloor. OLP-5H: Density, pressure, and light levels cause vertical zonation patterns in the open ocean. Zonation patterns influence organisms’ distribution and diversity. |
| Science Objectives |
|
| Math Objectives |
|
Table 2
Supplies needed for lesson plan activities.
| DESCRIPTION | NUMBER | ACTIVITY | PURPOSE |
|---|---|---|---|
| Assorted markers, including yellow and black/blue | Minimum of two colors per group of students (suggested group size: 2–4 students) | A & B | Activity A: plotting environmental data Activity B: plotting day (yellow) and night (black/blue) abundance values on depth profiles |
| Plastic/Ziplock bags | 6 bags per group of students | B | Activity B: these will represent the “trawl net” containing “captured animals” (see Figure 4b) |
| Permanent marker | 1 | B | Activity B: use this to label and identify the Ziplock bags (e.g., “trawl net sampling the surface zone, 0–200 m” – see Figure 4b) |
| Printed illustrations (see lesson plan flash cards). Alternatively, for an edible version of this activity, use Swedish fish candies | Number of animals can vary at instructor’s discretion, but ratios should be consistent with those provided Table 3. If using Swedish fish candies, a minimum of 5 unique colors/shapes is necessary to represent the 5 different animals in the activity. | B | Activity B: these will represent the “captured animals” within each trawl catch (see Figure 4b) |
Table 3
Abundance of each organism (represented by printed illustrations or candies) in each MOCNESS net (Ziplock bag). See Figure 4b for example.
| ORGANISM | DAY | NIGHT | ||||
|---|---|---|---|---|---|---|
| 0–200 m | 200–1000 m | 1000–4000 m | 0–200 m | 200–1000 m | 1000–4000 m | |
| Flying fish | 4 | 0 | 0 | 4 | 0 | 0 |
| Lanternfish | 0 | 4 | 0 | 4 | 0 | 0 |
| Hatchetfish | 0 | 4 | 0 | 0 | 4 | 0 |
| Fangtooth | 0 | 0 | 4 | 0 | 0 | 4 |
| Pelican eel | 0 | 0 | 4 | 0 | 0 | 4 |

Figure 4
a) Educators at the Mid-Atlantic Marine Education Association (MAMEA) conference in October 2022 try Activity B (“Deep-Sea Sampling”). Photo credit: Mid-Atlantic Marine Education Association Facebook page b) Activity B “nets” (plastic bags) containing “animals” (printed illustrations or candies) c) example vertical distribution plot for a Fanfish.

Figure 5
Introduction to Activity C (“Solving the Murder”). Students will use information from previous activities, the detective’s notes, and ecological information about each suspect to identify which animal committed the crime.

Figure 6
The Virginia Scientists and Educators Alliance (VA SEA) logo.