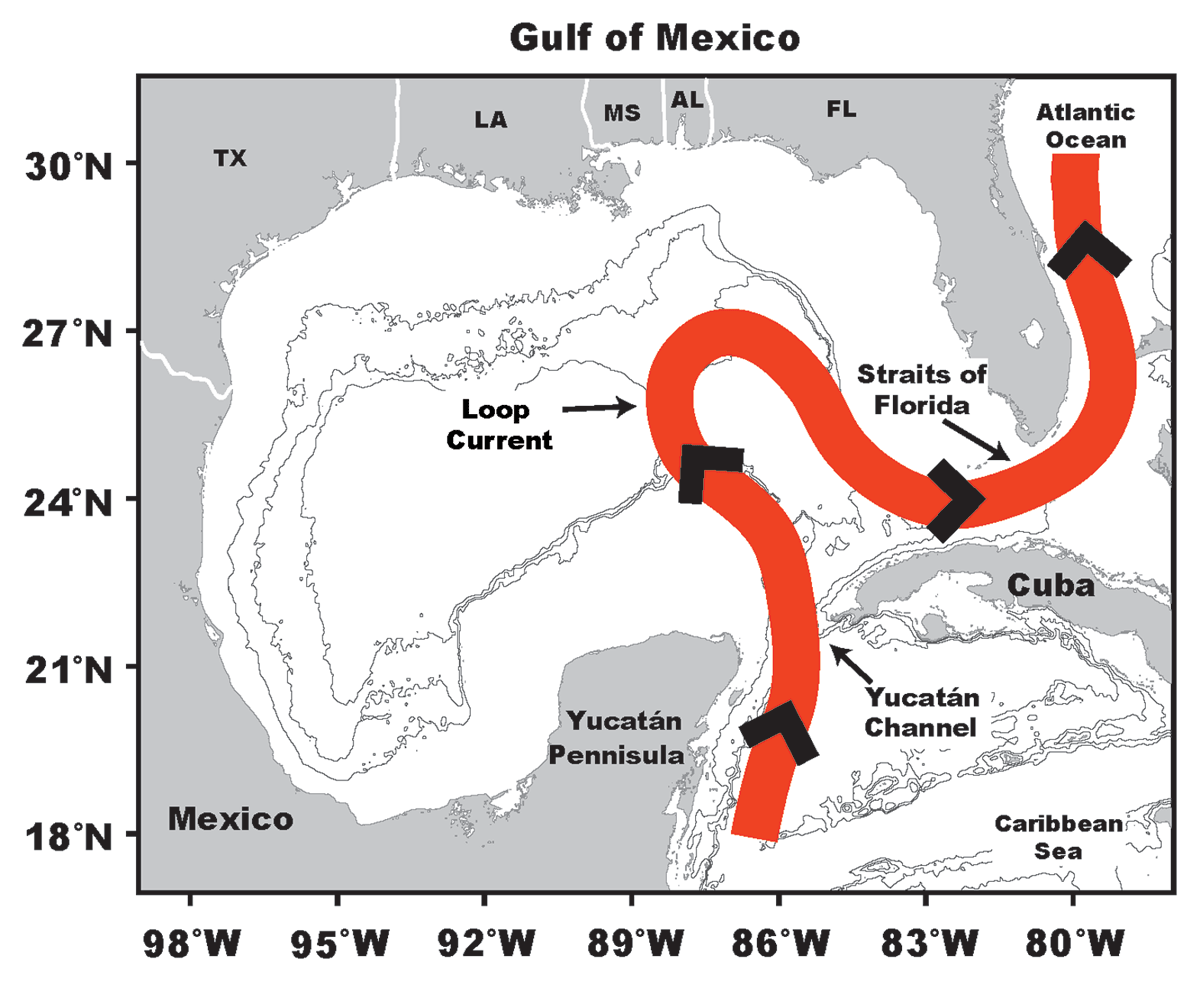
Have a personal or library account? Click to login
Real-World Temperature Data From the Gulf of Mexico: Seasonality and Effect of the Loop Current With an Accessible Hands-On Activity Cover

Real-World Temperature Data From the Gulf of Mexico: Seasonality and Effect of the Loop Current With an Accessible Hands-On Activity

Open Access
|Dec 2024

Figures & Tables

cjme-39-2-107-g1.png
Figure 1

Map of the Gulf of Mexico with bathymetry contours at 1,000, 2,000, and 3,000 meters (grey lines), and Loop Current path (red line).
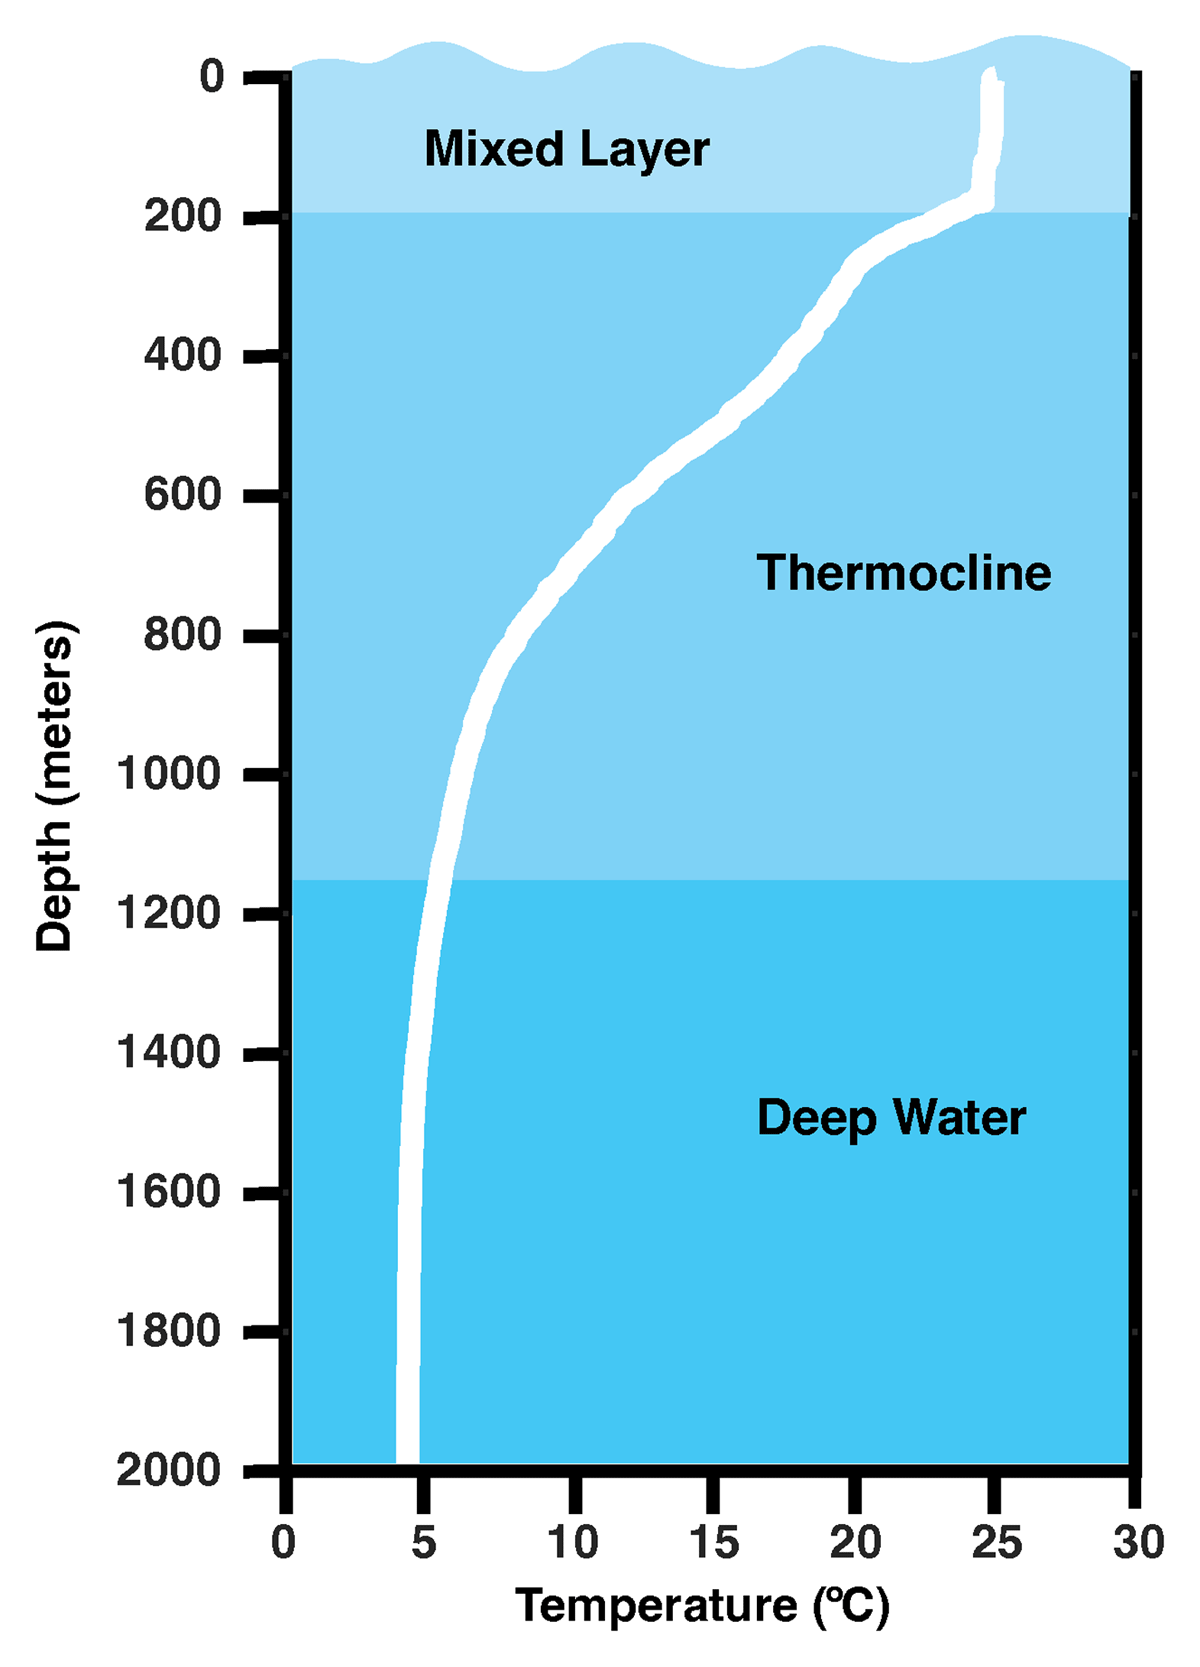
cjme-39-2-107-g2.png
Figure 2

Profile of temperature data (curved white line) collected February 21, 2023, within the Loop Current water mixed layer (top, light blue), thermocline (middle, medium blue), and deep layer (bottom, dark blue).
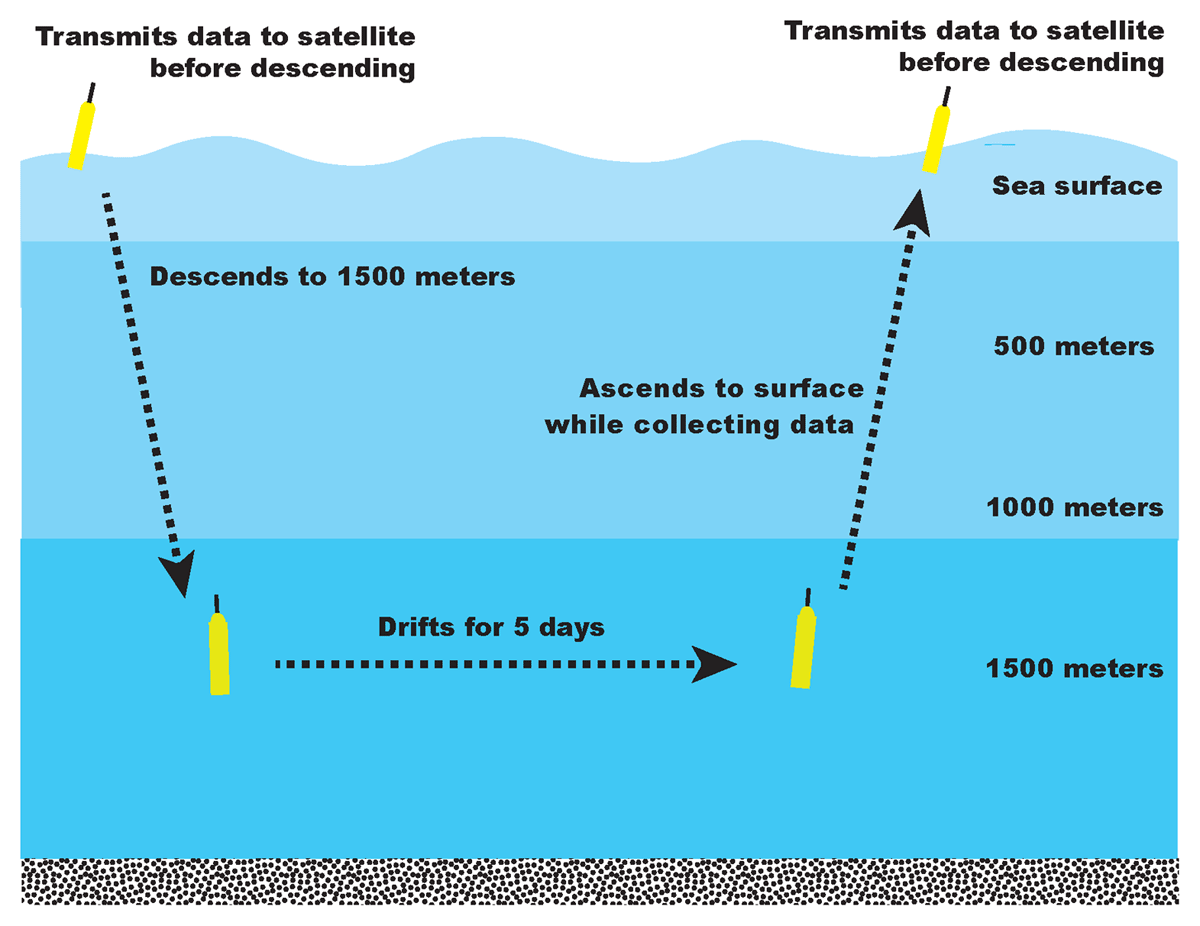
cjme-39-2-107-g3.png
Figure 3

Schematic of a 5-day profiling float mission with a typical trajectory. Light blue represents the mixed layer, medium blue represents the thermocline, and dark blue represents the deep layer.

DOI: https://doi.org/10.5334/cjme.107 | Journal eISSN: 2632-850X
Language: English
Submitted on: Dec 23, 2023
Accepted on: Sep 29, 2024
Published on: Dec 11, 2024
Published by: Ubiquity Press
In partnership with: Paradigm Publishing Services
Publication frequency: 1 issue per year

© 2024 Andrée L. Ramsey, Mary Carla Curran, Amy S. Bower, published by Ubiquity Press
This work is licensed under the Creative Commons Attribution 4.0 License.