
Gulf of Mexico
The Gulf of Mexico is an oval shaped ocean basin bounded by the southern United States and eastern Mexico and is the largest gulf (a deep inlet of the sea almost surrounded by land, with a narrow mouth) in the world (Figure 1). The Gulf of Mexico is connected to the Atlantic Ocean through the Straits of Florida, located between Florida and Cuba, and to the Caribbean Sea through the Yucatán Channel, located between Mexico and Cuba (McKinney et al. 2021). Both the Straits of Florida and the Yucatán Channel are about 160 km wide. The Straits of Florida is only about 800 m deep, while the Yucatán Channel reaches 2,000 m in depth. The shallow sill of the Straits of Florida limits the amount of water exiting the Gulf to only the upper water, which is warmer, while the deeper, colder water exits back through the deeper Yucatán Channel.
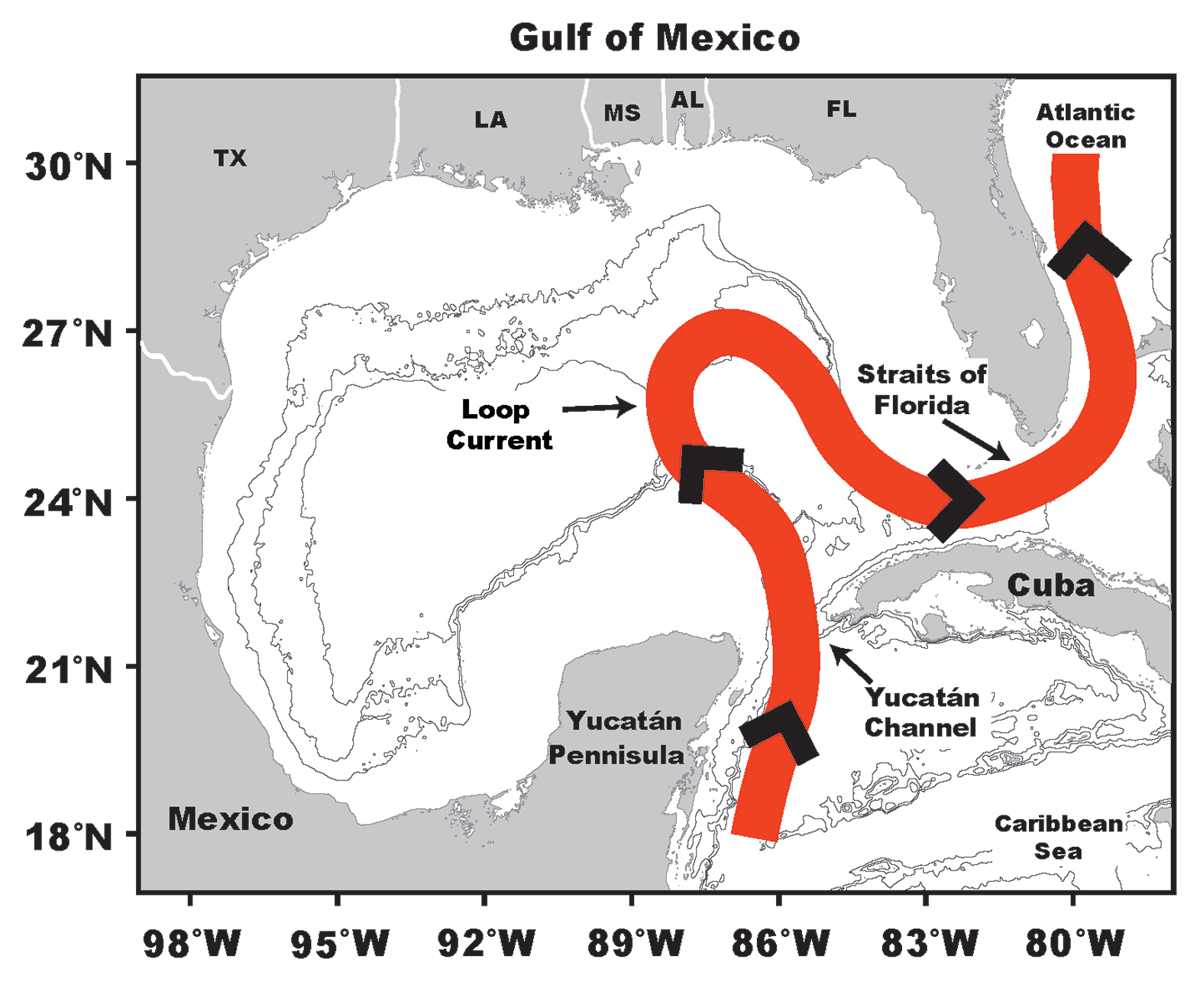
Figure 1
Map of the Gulf of Mexico with bathymetry contours at 1,000, 2,000, and 3,000 meters (grey lines), and Loop Current path (red line).
The water column in the Gulf of Mexico can be characterized as three layers based upon its physical properties such as water temperature (Hamilton et al. 2018; Figure 2). The surface layer, also referred to as the mixed layer, is typically well mixed due to interaction with wind and waves, resulting in a uniform temperature between 0–200 m depending on the season and location. The middle layer, called the thermocline, is characterized by a strong vertical temperature gradient. This layer is warmer at the top than at the bottom and extends from ~200 to ~1,000 m. Under most conditions, this layer is too deep to be affected by solar radiation, wind, or waves, and decreases in temperature from top to bottom. Below the thermocline is the cold, deep-water layer, which extends from ~1,000 m to the ocean floor. Although some gradual mixing occurs as the water interacts with the bathymetry, the temperature of this lower layer is fairly uniform. In the Gulf of Mexico, the temperature in this layer is ~6°C or colder.
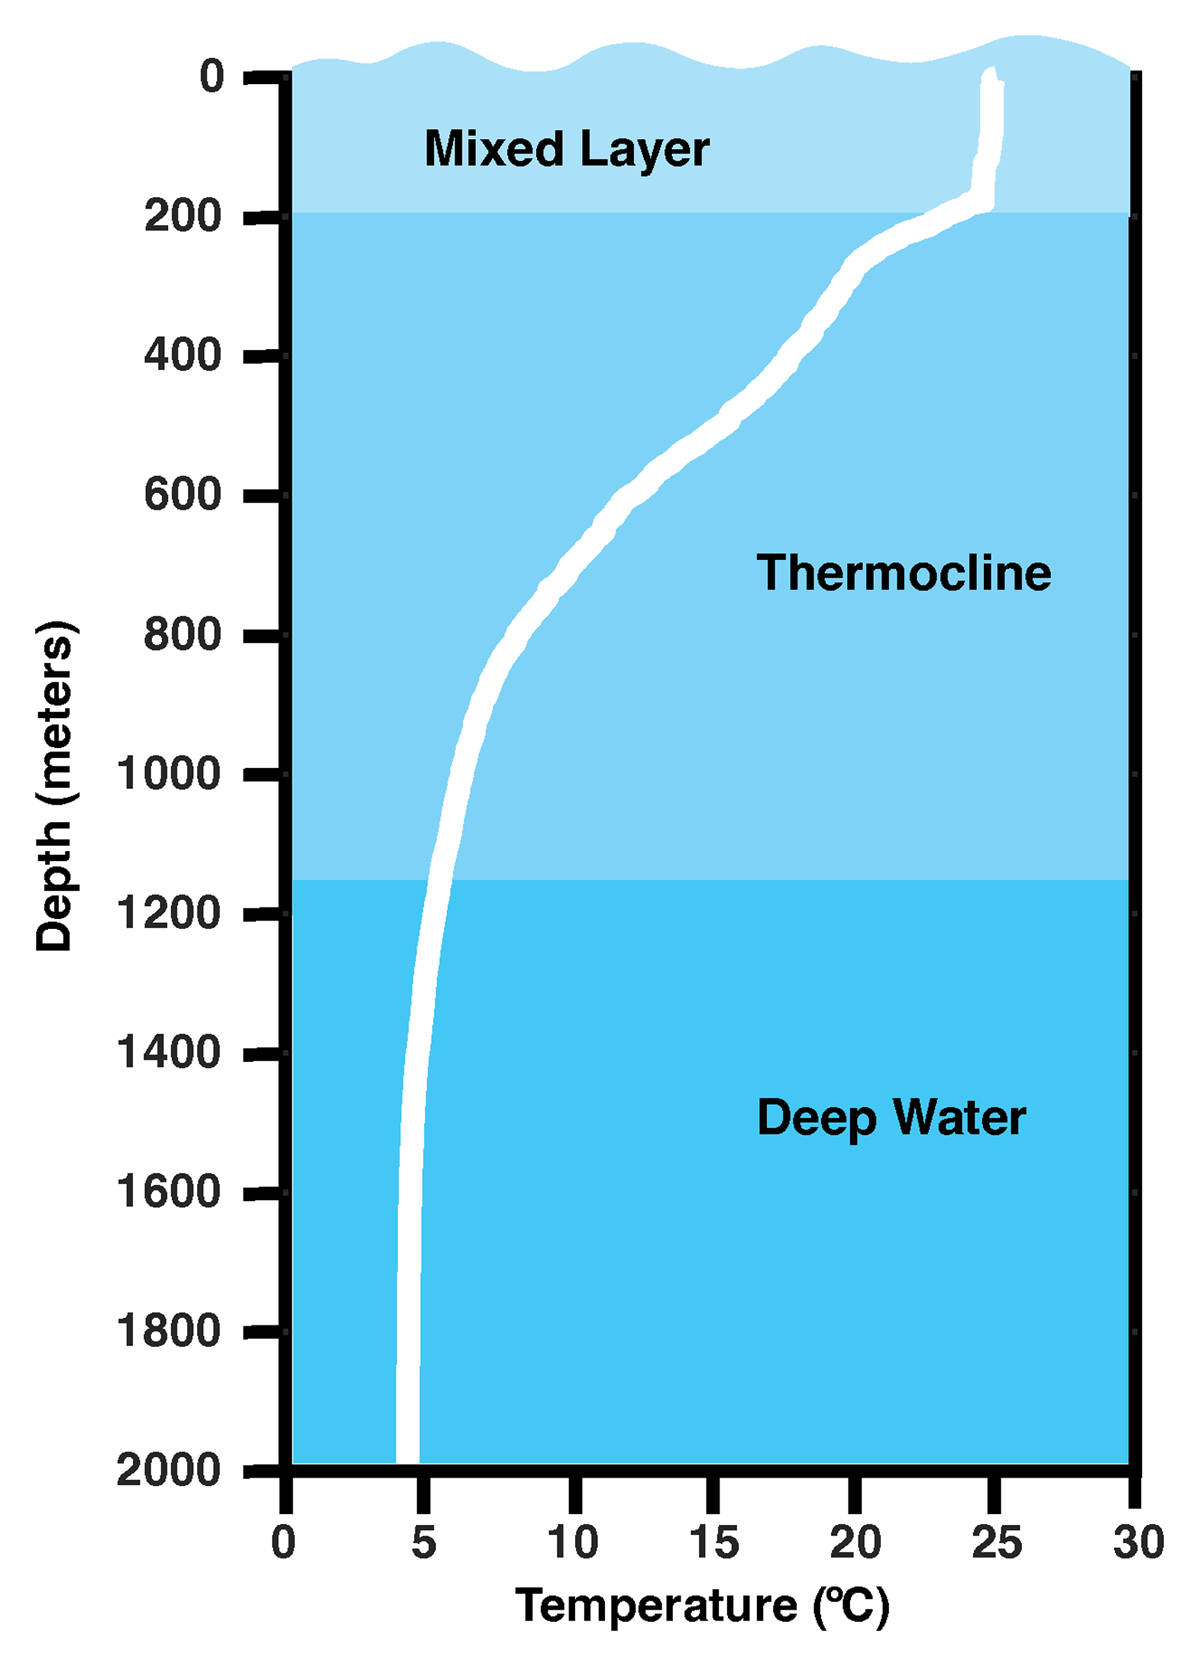
Figure 2
Profile of temperature data (curved white line) collected February 21, 2023, within the Loop Current water mixed layer (top, light blue), thermocline (middle, medium blue), and deep layer (bottom, dark blue).
Loop Current
As the water flows into the Gulf of Mexico through the Yucatán Channel, it forms a clockwise half-loop, called the Loop Current, the upper layer of which eventually exits through the Straits of Florida (Figure 1) (Donohue et al. 2016). The Loop Current transports a thick layer of tropical warm Caribbean water into the Gulf of Mexico year-round. Therefore, water in the Gulf is almost always warmer in the Loop Current than in the surrounding water, down to a depth of at least 1200–1500 m. The exception is in summer, when the surface layer of the entire Gulf is heated by the increase in solar radiation such that surface temperatures are almost the same everywhere. Deeper in the water column, temperature within the Loop Current stays warmer than the surrounding water all year round, even in summer.
The Loop Current is important because it is the dominant ocean source of heat in the upper ocean in the Gulf of Mexico. The Loop Current is one of the fastest currents in the Atlantic Ocean with a top speed of about 1.5 m s–1 near the surface, or 3 mi h–1 (average human walking speed). It decreases in speed (becomes weaker) at deeper depths. Current speed within the Loop Current is still detectable at 800–1000 m but is only about 0–0.1 m s–1, or 0.22 m h–1 (Sheinbaum et al. 2016). Some of the Loop Current is part of a global system of interconnected currents called the global meridional overturning circulation (sometimes called the Great Ocean Conveyor (Broecker 1987)) that is driven by differences in ocean temperature and salinity (and therefore density) at high polar latitudes compared to the tropics. The rest of the Loop Current is driven by large-scale wind patterns over the North Atlantic, which set up a clockwise gyre or closed circulation across the basin. The Loop Current and Gulf Stream make up the western branch of this gyre.
Significance
The Gulf of Mexico is surrounded by densely populated areas and is the site of extensive offshore oil and gas exploration and extraction. Identifying and predicting the location of the Loop Current and its warm surface water temperature is, therefore, important for human safety (National Academies of Sciences, Engineering, and Medicine 2018). Strong currents impact oil and gas operations, shipping, and fishing. Tropical storms and hurricanes feed off warm surface water and can quickly escalate into dangerous storms. These impacts affect people living along the coast and working on the water, as well as infrastructure like oil and gas drilling rigs. By accurately predicting the strength of a storm and its path, populated areas and those working at sea can be evacuated in time, and oil rigs can be safely secured, saving both human life and the environment.
Given that there are many stakeholders impacted by temperatures in the Gulf of Mexico, it is important for oceanographers to understand the dynamics of the region in order to improve ocean current and storm forecasts. Surface temperatures can be measured by sensors on satellites that orbit the Earth, but subsurface temperatures are harder to assess. Oceanographers use profiling floats to measure temperature and other water properties below the surface (Figure 3). Starting in 2019, a large fleet of these floats was deployed in the Gulf by scientists at the Woods Hole Oceanographic Institution (WHOI) as part of the Understanding Gulf Ocean Systems (UGOS) program funded by the National Academies of Science, Engineering and Medicine. The floats are programmed to spend most of their time passively drifting at 1,500 m. Every five days, they automatically change their buoyancy and rise up through the water column, recording temperature, pressure, and salinity. Once the floats reach the surface, they transmit the data to the oceanographers via satellites for analysis. After transmitting the data, the floats sink back down to 1,500 m for another five days. These data provide information used to monitor the Loop Current in the Gulf of Mexico.
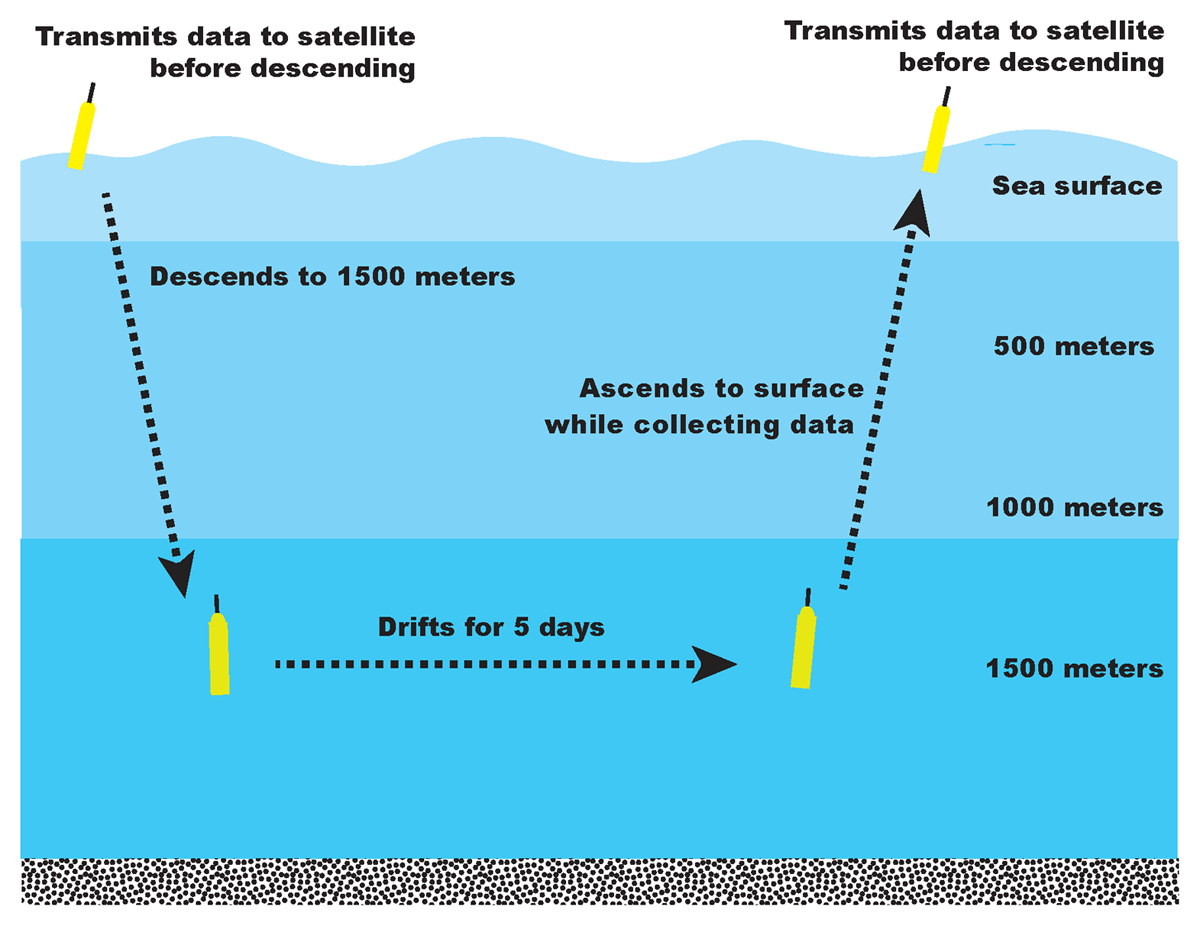
Figure 3
Schematic of a 5-day profiling float mission with a typical trajectory. Light blue represents the mixed layer, medium blue represents the thermocline, and dark blue represents the deep layer.
Ocean currents are vital in distributing heat across the planet and have a major impact on the climate. The previous activities we have constructed for students focused on ocean circulation in the North Atlantic as well as changes in the Loop Current strength with depth (Curran, Bower & Furey 2017; Koman et al. 2023). In this activity, students will be constructing a table of seasonal ocean temperature data collected by oceanographers using profiling floats in the Gulf of Mexico and will interpret the results to learn about the influence of the Loop Current during summer and winter. This activity has modifications for blind and low vision students.
Vocabulary
Bathymetry – ocean’s depth relative to sea level and/or the shape of underwater features
Current – a volume of water moving in a defined direction
Isotherm – surface with constant temperature
6°C isotherm – the boundary between the middle layer and deep bottom layer of water in the Gulf of Mexico
Loop Current – a current carrying warm water that enters the Gulf of Mexico between Mexico and Cuba, ‘loops’ through the Gulf of Mexico, and exits south of Florida. The warm water then turns northward along the U.S. east coast and eventually becomes the Gulf Stream (NOAA).
Mixed layer – the upper most layer of ocean water extending from a few meters to hundreds of meters. This layer of water has a uniform temperature due to mixing caused by surface wind and waves.
Ocean circulation – the system of currents that exist within the ocean basin
Profiling floats – passively drifting oceanographic instruments that measure ocean currents, temperature, salinity, and pressure below the sea surface
Sill – submarine ridge between basins
Thermocline – layer of water with a large gradient in temperature. It is often the layer between the surface layer and the deep layer, both of which are characterized by little temperature change (Science Learning Hub).
Trajectory – the path, or track, that an object or current takes
Standards
Middle school standards are provided below. This activity has also been used by high school students.
Next Generation Science Standards (NGSS)
MS-ESS2.C. The Roles of Water in Earth’s Surface Processes. Variations in density due to variations in temperature and salinity drive a global pattern of interconnected ocean currents.
Common Core Standards (Common Core)
8.F5: Describe qualitatively the functional relationship between two quantities by analyzing a graph (e.g., where the function is increasing or decreasing, linear or nonlinear). Sketch a graph that exhibits the qualitative features of a function that has been described verbally.
Ocean Literacy Principles (OLP)
Principle 6. The ocean and humans are inextricably interconnected.
Climate Literacy Principles (CLP)
Essential Principle 2: Climate is regulated by complex interactions among components of the Earth system.
Essential Principle 5: Our understanding of the climate system is improved through observations, theoretical studies, and modeling.
Duration
Two class periods (approximately 50 minutes each) should be scheduled with the first period structured to include the background information and table completion with some initial discussion about seasonal differences. The second period is designed to complete the bar graphic, activity questions, and group discussion. There is flexibility for there to be homework assigned or for students to start answering the questions during the first period. The thought questions can be optional or awarded as extra credit.
Supplies
Activity Packet (one per student)
Pens and/or pencils (one per student)
Colored pens or markers
Rulers (optional for reading graph lines)
Supplemental Material Suggestions for Blind and Low Vision Students
Graphs printed out from a Pictures in a Flash (PIAF) device so that the black print is raised and tactile with larger text
Graphs printed out in larger text or in braille
Data table and figures printed out in larger text (Supplemental File A) or in braille
Thick markers (like 20/20 BoldWriters)
VisioBook or other magnifying device (to magnify the text)
Rulers on tracks
Activity
Once the teacher provides the background information about the Gulf of Mexico and the role of the Loop Current, one Activity Packet can be distributed to each student. Students will be working in pairs. One student is given the winter profiles from within the Loop Current and within the surrounding water, and the other student is given the summer profiles. The students can be oriented to the profile graph (Figure 1 in packet) by noting that temperature is measured along the x-axis (with 5°C tick marks) and a grid line bisecting the figure at 15°C, which is particularly helpful for blind and low vision students. The range in temperature values is from 0°C to 30°C. Ocean depth is measured along the y-axis, which is oriented in a way that might be novel for students, with the shallowest depth (smaller numbers) higher up on the axis and the deepest depth (2,000 m) being found at the bottom left of the graph. The tick marks on the y-axis are found every 250 m, and there are three gridlines (500, 1,000, and 1,500 m) going across the page to aid in orientation.
Once basic graph orientation is understood, the teacher can then prompt the students to use the 15°C grid line to deduce whether the solid curve or dotted curve is the one depicting the data for the Loop Current water. Because the solid curve depicts warmer temperatures at every depth except the deepest ones (and the surface one for winter), the solid curve denotes the Loop Current. Students can write ‘LC water’ for the Loop Current and ‘GoM water’ for the surrounding Gulf of Mexico water next to the correct curve. They can also fill in these depth values into their table. Because the data point markers are relatively large on the figure, getting values within 100 m of the answer is acceptable. Using a ruler may be helpful to estimate depth values.
Students can then continue filling in the table for their assigned profile. Pairs that finish early can start working on the questions provided or begin coloring the bar graphic depending on teacher preference. Any color choices are fine for the graphic as long as the same color is used for the same temperature bin for both Loop Current water and surrounding Gulf of Mexico water. Questions deemed difficult to complete during class time can be removed, assigned as homework, assigned as extra credit, or discussed as a group, at the teacher’s discretion.
Modifications and Cross-Curricular Expansion
In most of the classes we tested, students completed their portion of the table (winter or summer) in less than 50 minutes and were then given the opportunity to choose what to do with the remaining time. Choices included: completing the table by filling in the other season in the table (winter or summer), starting to answer the activity packet questions, or beginning to color the bar graphic and label the corresponding key.
Discussion and Reflections
In our test sessions, it was interesting to discuss the colors students chose for their bar graphic. Some used a standard representation with ‘hotter’ colors (e.g., red/orange) depicting warmer temperatures and ‘cooler’ colors (e.g., purple/blue) depicting colder temperatures. Any choices are fine, to encourage creativity, as long as the same color is used for the same temperature bin for both Loop Current water and surrounding Gulf of Mexico water. This is an important concept in data mapping: same temperature = same color.
We obtained feedback on the activity from teachers, including Teachers of the Visually Impaired (TVI), and several student groups. Students enjoyed that the activity connected to their own lives and interests because it related to weather, climate, hurricanes, meteorology, and geography. They also appreciated that the data were real and therefore were not modified for their use. It was interesting that one student said that she did not like filling in the table before knowing if her answers were right, or at least how far off they were. Her comment led to a discussion about the importance of having confidence in answering a question without ever knowing if you are right or wrong. Sometimes in life the ‘truth’ is not provided in an answer key. In this activity, however, students can be provided with the answers. Getting the values within approximately 100 m of the answer is acceptable as the line markers are quite large in the figure.
Students were able to participate in a discussion about the effect of the Loop Current in winter versus summer. They correctly noted that the water temperature was warmer in the Loop Current, including at depth. Differences in the water temperature were less noticeable in the summer profiles; however, students were still able to determine which profile was in the Loop Current versus in the surrounding water.
Data Availability
Additional File
The additional file for this article can be found as follows:
Supplemental File
Student Activity Packet. Supplemental File A – large text data table and activity figures. Photographs of students at the Perkins School for the Blind working on the Activity Packet. Answer Key for the Student Activity Packet. DOI: https://doi.org/10.5334/cjme.107.s1
Acknowledgements
We would like to thank the students at the Perkins School for the Blind as well as their teacher Kris Bayne for her comments and suggestions on the activities described in this paper.
Funding Information
Research reported in this publication was supported by the Gulf Research Program of the National Academies of Sciences, Engineering, and Medicine under award number 200013145. The content is solely the responsibility of the authors and does not necessarily represent the official views of the Gulf Research Program or the National Academies of Sciences, Engineering, and Medicine.
Competing Interests
The authors have no competing interests to declare.
Author Contributions
All authors contributed to the conception, writing, and reviewing of this manuscript and have approved the submission.
Author Information
Andrée L. Ramsey is a Research Associate at the Woods Hole Oceanographic Institution, Woods Hole, MA. Her research is focused on gaining a better understanding of the role of the ocean related to its effects on the climate. She enjoys working with oceanographic data, trying to put the puzzle pieces together and sharing her knowledge with others.
Mary Carla Curran recently retired as a Full Professor in the Department of Marine and Environmental Sciences at Savannah State University and is now professor emerita. She is an active member of the National Marine Educators Association and has extensive experience translating scientific research into peer-reviewed K-12 activities, often with modifications for the visually impaired. She is passionate about outreach activities and hopes to encourage students to remain interested in the sciences. Her areas of research include fish biology, parasite-host interactions, and estuarine ecology.
Amy S. Bower is a Senior Scientist at the Woods Hole Oceanographic Institution, Woods Hole, MA. She has been studying deep ocean currents in the North Atlantic and Indian Oceans with deep-drifting floats and moorings for over 30 years. Amy was diagnosed with macular degeneration and retinitis pigmentosa in her 20s and has been legally blind for nearly three decades. Motivating visually impaired and blind students to consider careers in STEM is one of her passions in education and outreach.