
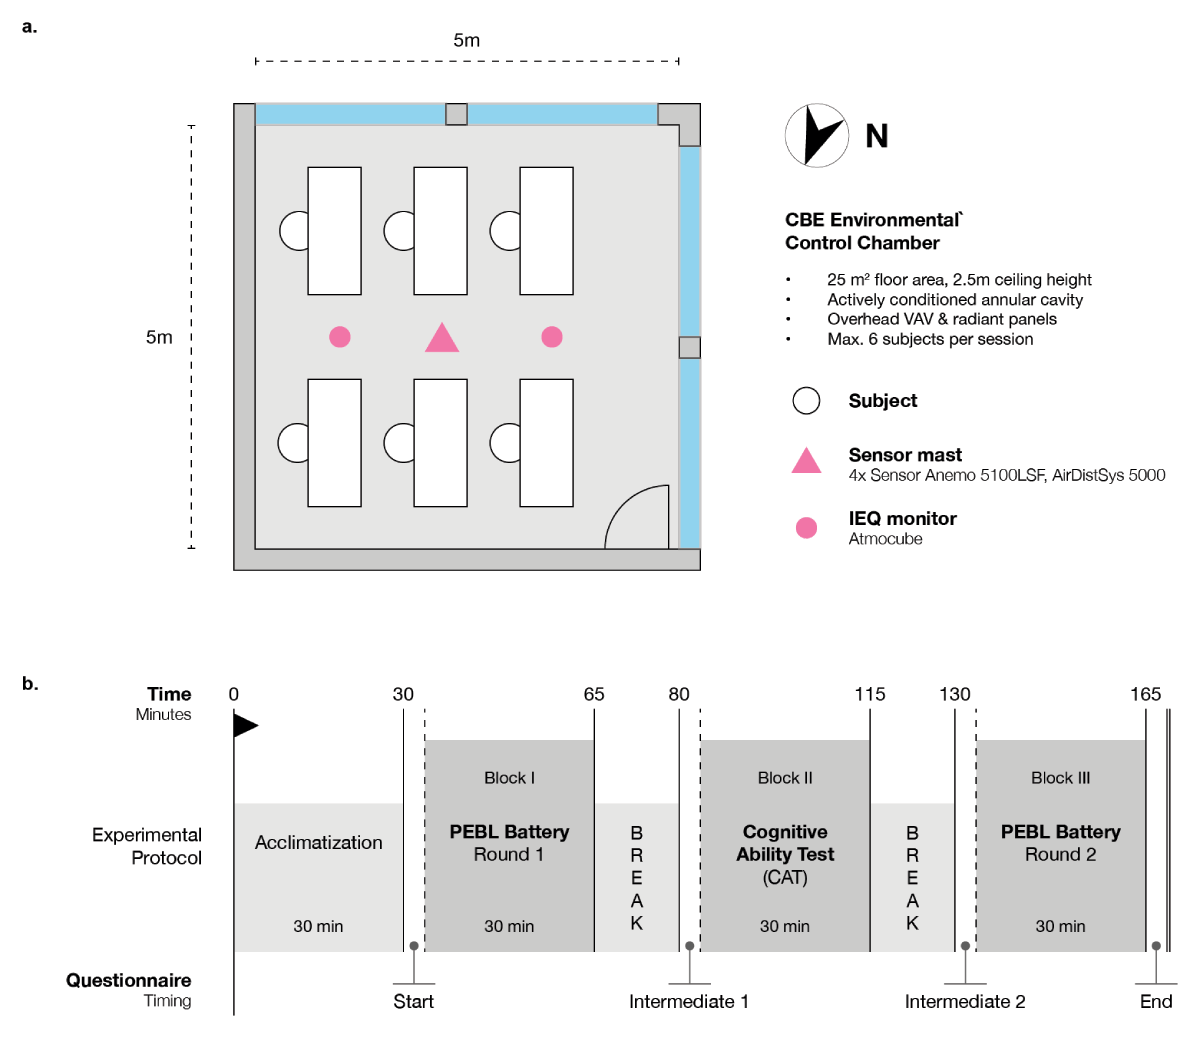
Figure 1
(a) The Center for the Built Environment (CBE) Environmental Control Chamber layout; and (b) experimental protocol.
Table 1
Summary of demographic information (mean ± SD) on 75 study participants who attended all four conditions.
| SEX | PARTICIPANTS | AGE (years) | HEIGHT (m) | WEIGHT (kg) | BODY MASS INDEX (BMI) |
|---|---|---|---|---|---|
| All | 75 | 25.9 ± 7.3 | 1.66 ± 0.11 | 68.8 ± 11.8 | 25.1 ± 4.5 |
| Female | 38 | 25.3 ± 7.9 | 1.60 ± 0.07 | 64.4 ± 11.7 | 25.2 ± 4.6 |
| Male | 35 | 26.7 ± 6.8 | 1.72 ± 0.10 | 73.3 ± 10.2 | 24.9 ± 4.4 |
| Unspecified | 2 | 22.5 ± 0.7 | 1.65 ± 0.00 | 75.0 ± 9.9 | 27.5 ± 3.6 |
Table 2
Means for key environmental parameters measured during sessions.
| SESSION | Tair (°C) | RELATIVE HUMIDITY (%) | CO2 (ppm) |
|---|---|---|---|
| 21C | 21.3 (0.2) | 54.3 (3.3) | 579 (81) |
| 23C | 23.2 (0.2) | 53.0 (1.5) | 572 (73) |
| 25C | 25.0 (0.3) | 51.0 (3.0) | 572 (63) |
| 27C | 26.9 (0.2) | 49.4 (4.3) | 570 (80) |
[i] Note: Temperature measurements are averages (SD) from the central-mast sensor and the two Atmocube units.
Table 3
Cognitive domains assessed with PEBL Psychological Test Battery and sorted in the order in which they were completed.
| TEST | COGNITIVE DOMAIN | TEST METRICS |
|---|---|---|
| Berg Card Sorting Test (BCST) | Executive Function | Perseverative errors, trials |
| Corsi Blocks | Working Memory | Span, correct trials |
| Flanker Task | Attention | Response time, accuracy |
| Match-to-Sample | Attention | Response time, accuracy, errors |
| Paired Associates | Working Memory | Correct responses, errors |
| Tower of London (ToL) | Executive Function | Moves, time |
| Trail Making (Simple + Mixed) | Processing Speed/Executive Function | Time, clicks |
| Balloon Analog Risk Task (BART) | Decision-Making | Mean/total pumps |
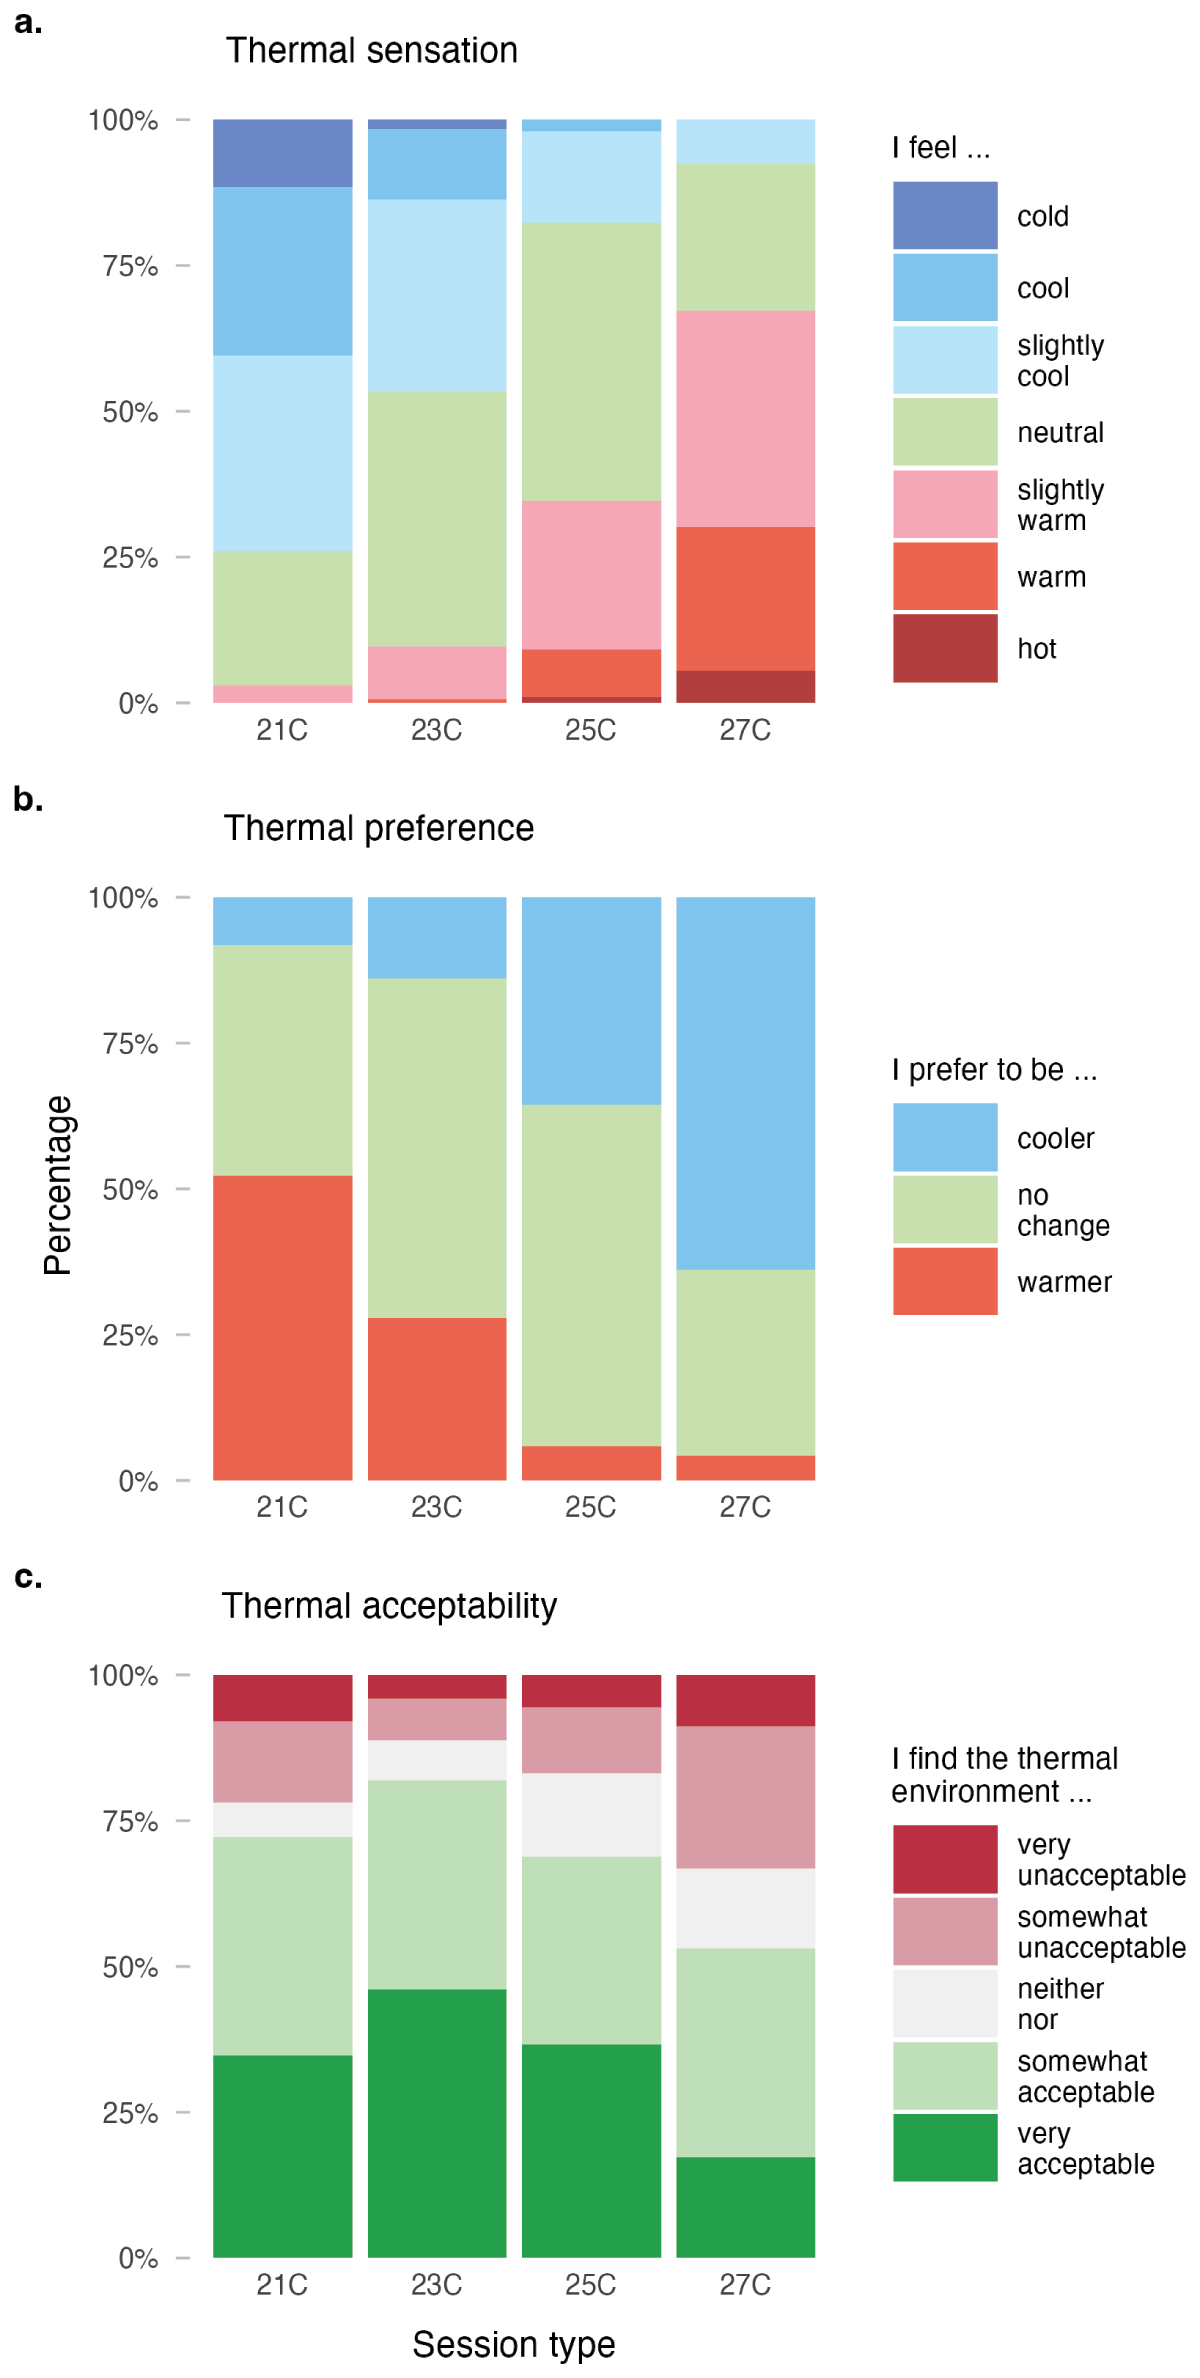
Figure 2
Distribution of survey responses to thermal perception across experimental conditions: (a) thermal sensation, (b) thermal preference, and (c) thermal acceptability.
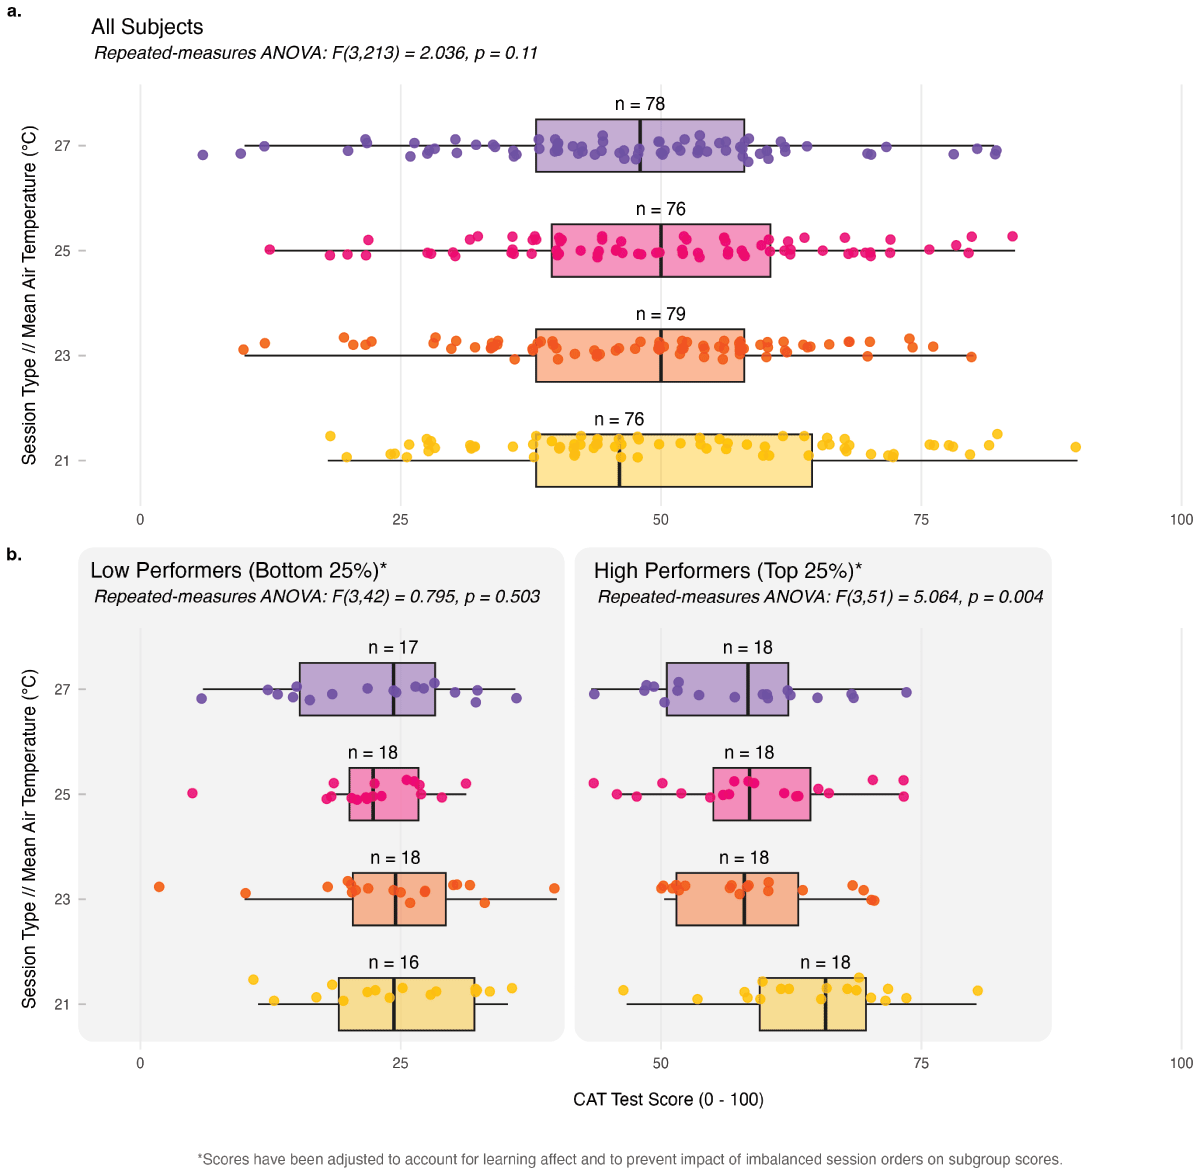
Figure 3
Cognitive Ability Test (CAT) performance across temperature conditions: (a) individual participant CAT scores (points) for the full sample plotted against average session temperatures; and (b) CAT scores for the bottom and top 25% of performers shown as a function of average measured session air temperatures and corrected by the calculated mean learning effect for visual display
Note: Reported statistics derive from a linear mixed-effects model.
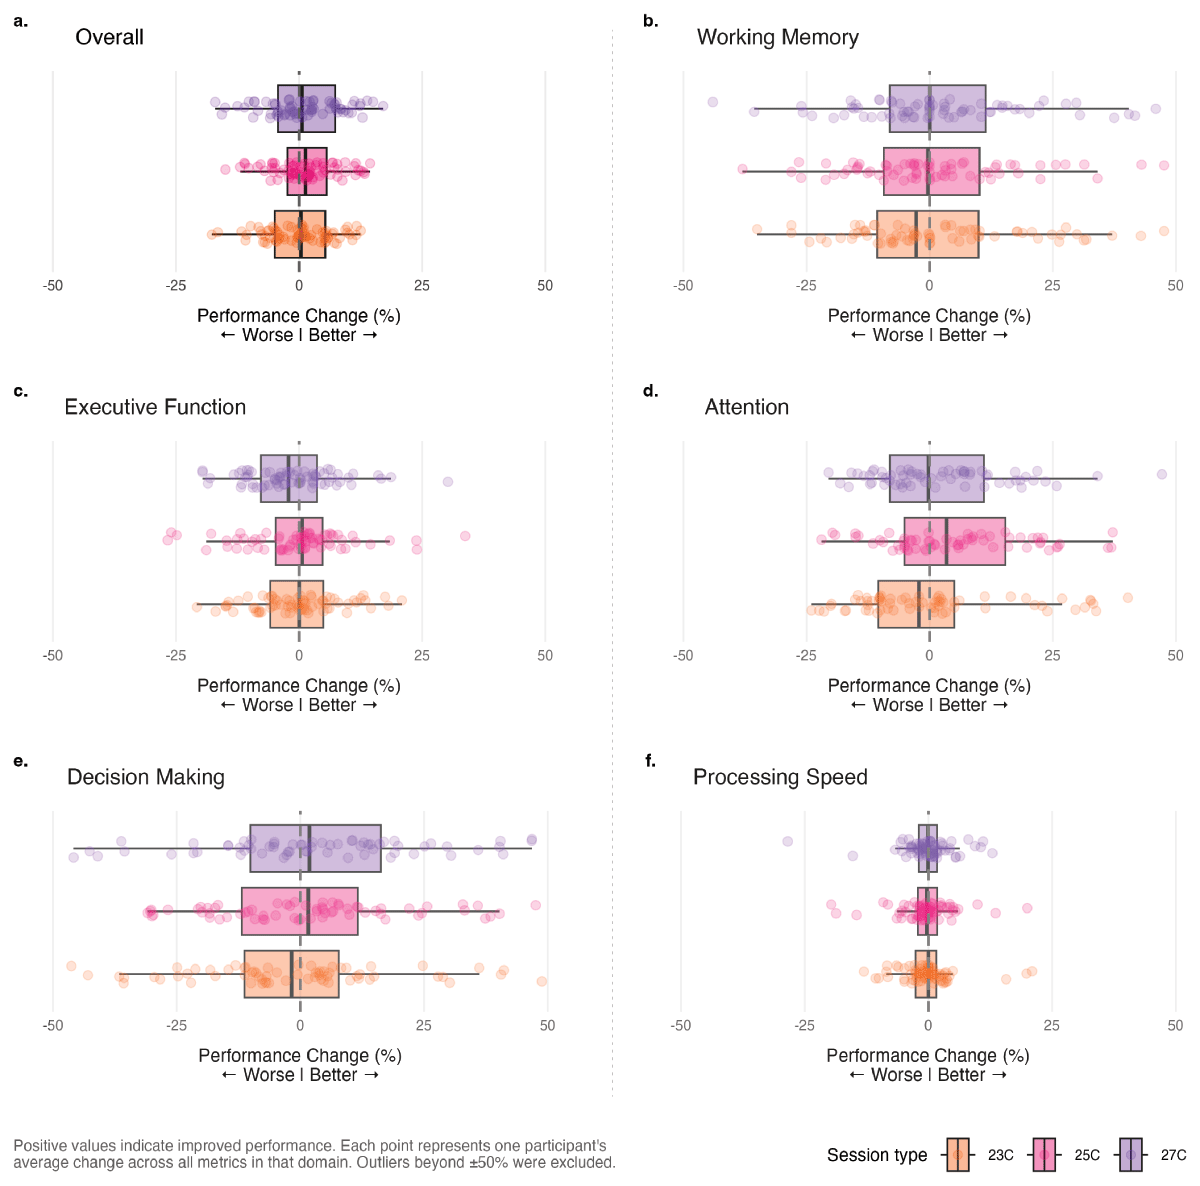
Figure 4
Performance changes across cognitive domains by temperature condition.
Note: Each panel shows the distribution of individual participant performance changes (relative to a 21°C baseline) for one cognitive domain. Box plots represent the median and interquartile range, with individual points showing participant-level averages across all metrics within that domain. Positive values indicate improved performance. Despite some variability, no systematic, statistically significant temperature effects emerged across any cognitive domain.
Table 4
Domain-level PEBL Psychological Test Battery composite results.
| DOMAIN | n | F(df1, df2) | p | ηp² | pequiv | EQUIVALENT |
|---|---|---|---|---|---|---|
| Working memory | 70 | F(3, 207) = 0.229 | 0.876 | 0.003 | 0.0491 | Yes |
| Executive function | 70 | F(2.42, 167) = 1.726 | 0.174 | 0.024 | 0.6050 | No |
| Attention | 70 | F(2.27, 157) = 1.131 | 0.330 | 0.016 | 0.4360 | No |
| Processing speed | 70 | F(1.93, 133) = 0.865 | 0.420 | 0.012 | 0.3720 | No |
[i] Note: Z-score composites were computed by averaging direction-corrected metrics within each cognitive domain. Greenhouse–Geisser corrections applied where sphericity was violated (df1 < 3). Decision-making excluded (Balloon Analog Risk Task (BART) measures behavioral tendency, not performance accuracy). pequiv is from the equivalence F-test with bound ηp² = 0.01.
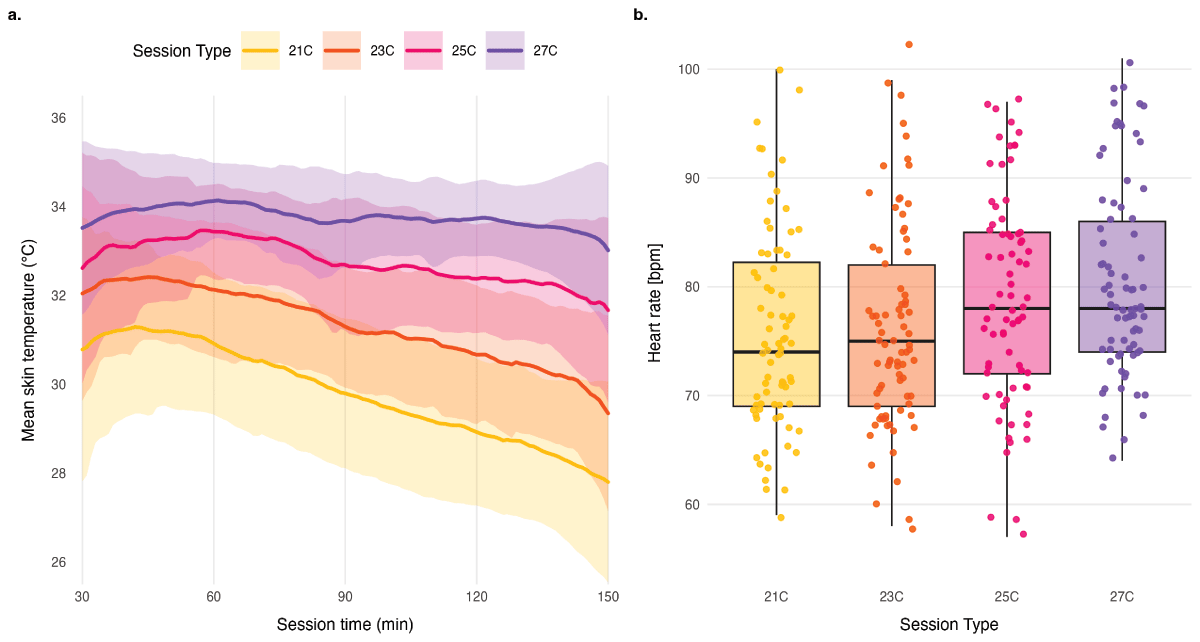
Figure 5
Physiological responses across temperature conditions: (a) mean non-dominant hand skin temperature across all participants by session type, shown over the session duration (starting after the 30-min acclimatization period); and (b) distribution of participants’ mean heart rate (beats per minute; bpm) grouped by session type.
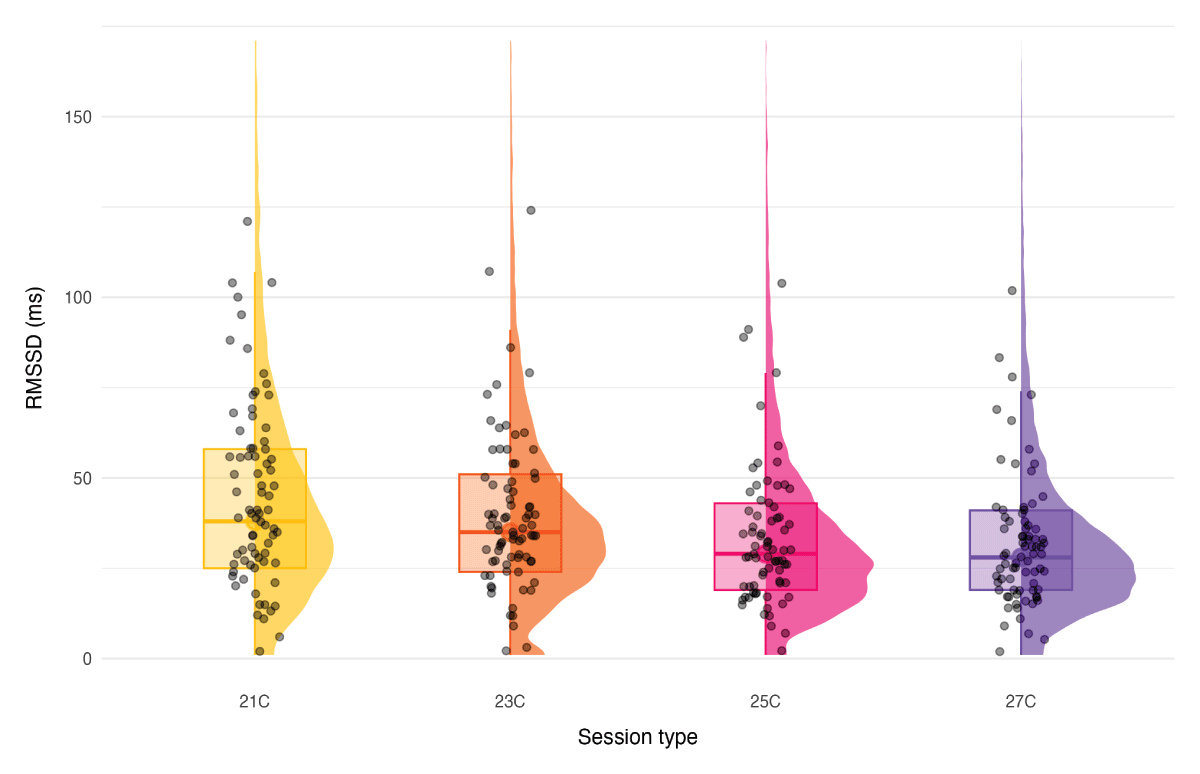
Figure 6
Root mean square of successive differences (RMSSD) across temperature conditions: distribution of session-level RMSSDs for the four temperature conditions.
Note: Each point represents an individual participant’s median RMSSD for a single session. A higher RMSSD indicates greater parasympathetic activity and lower stress levels. The progressive decrease in RMSSD with increasing temperature remained significant after controlling for heart rate, indicating autonomic responses to elevated ambient temperature.