
1. INTRODUCTION
Numerous studies have examined the influence of the thermal environment on cognitive functioning and office work performance (OWP), yet findings remain inconsistent. At temperatures well outside typical indoor ranges, performance impairment is widely documented (Zhang et al. 2019). Within the range typically found in mechanically conditioned offices, however, the evidence is mixed. Several laboratory and field studies have reported measurable effects: Tanabe et al. (2007) found inconsistent effects of moderately elevated temperature (up to 33°C) across task types; Maula et al. (2016) observed a significant decrement on a working-memory task at 29°C compared with 23°C, while other administered tasks were unaffected; and Lan et al. (2022) reported reduced cognitive performance across a 24–28°C range even with thermal comfort actively held constant. Geng et al. (2017) similarly tested a wider 16–28°C range and found performance highest under neutral to slightly cool conditions, declining toward both extremes.
In contrast, other studies have found little or no effect within typical indoor ranges. A meta-analysis of 35 studies by Porras-Salazar et al. (2021) concluded that there is no reliable temperature–performance relationship in the 20–30°C range, and that existing empirical models have low predictive accuracy and are based on limited participant samples. Lin et al. (2025) found in a recent review that effects may be more pronounced for tasks with higher cognitive demand, but that the overall evidence base remains heterogeneous.
Together, these inconsistencies suggest that the relationship between indoor temperature and OWP is task, context, and population dependent, and that methodological heterogeneity, such as sample characteristics, task types, exposure duration, and the degree of environmental control, likely contributes to the variability across studies (Zhang et al. 2019).
A recent study by Porras-Salazar et al. (2024) in Singapore sought to address several of these limitations by evaluating temperature effects on OWP within a controlled experimental setting and by employing a structured set of cognitive performance assessments. Contrary to other work suggesting measurable decrements in performance with increasing deviation from thermally comfortable conditions (Lan et al. 2022; Lin et al. 2025), the Singapore study did not find conclusive evidence that OWP was affected by temperature within the typical ranges in office buildings.
Two constraints of the Singapore study limit the broader generalization of its results: the sample size (n = 58, large compared with typical studies, but still small to be generalizable) and the specificity of the climatic and cultural context in which it was conducted. Thermal expectations, acclimatization patterns, and building operation practices differ substantially between tropical and temperate regions, and these factors may influence both thermal experience and performance outcomes (Humphreys 1978; Xiong et al. 2026). Additional evidence from temperate office environments is therefore needed to evaluate whether the absence of strong temperature effects reflects a broader pattern or is specific to the conditions and the original participant sample. Independent replication is valuable in its own right and strengthens confidence in single-study findings (Popper 2002; Schmidt 2009), particularly given the policy relevance of temperature–performance research for heating, ventilation and air-conditioning (HVAC) design and energy management (Porras-Salazar et al. 2021).
The present study replicates the Singapore experiment in the temperate climate of the San Francisco Bay Area with a substantially larger sample and a practically identical protocol, enabling direct comparison across climatic, building, and cultural contexts. Grounded in the Maximal Adaptability Model (Hancock 1989), which suggests that individuals can maintain cognitive performance within an adaptive zone despite physiological thermal stress, this study evaluates whether the tested 21–27°C range falls within that zone, whether indoor temperature within it affects short-term cognitive performance, and whether physiological responses and thermal comfort shift with temperature even when cognition does not. It also asks whether the null performance effects reported by Porras-Salazar et al. (2024) replicate in a different climatic and cultural context with a larger sample.
2. METHODS
2.1 STUDY DESIGN AND SETTING
The experiment was carried out at the Center for the Built Environment at the University of California—Berkeley, between March and July 2025. During this period, typical daytime maximum outdoor temperatures ranged from 16 to 22°C (10th–90th percentiles) (NOAA 2025).
A total of 84 participants were recruited to attend four sessions and complete two types of cognitive performance assessments under air temperatures of 21, 23, 25, and 27°C. These temperatures were selected to represent typical indoor conditions in the US. Following the approach used in the original study (Porras-Salazar et al. 2024), indoor temperature data for US office buildings were extracted from the American Society of Heating, Refrigerating; Air-Conditioning Engineers (ASHRAE) Global Thermal Comfort Database II (Földváry Ličina et al. 2018). Observations with thermal sensation votes between –1.5 and 1.5 were retained, and the 10th, 25th, 50th, 75th, and 90th percentiles were calculated. The resulting values (21.4, 22.4, 23.4, 24.8, and 27.2°C) led to the selection of the four given temperature setpoints for the experimental conditions. For the remainder of this paper, these conditions are referred to as ‘session types’ with the following labels: 21C, 23C, 25C, and 27C.
To reduce learning effects associated with the work-performance tests, each participant was randomly assigned a unique session order. The distribution of orders (a maximum of 24 different combinations) was balanced across all participants (see Table S2 in the supplemental data online), who were then asked to schedule their sessions in the required sequence.
2.2 ENVIRONMENTAL CHAMBER
All sessions were conducted in an environmental control chamber at the Center for the Built Environment. The chamber measures 5 × 5 × 2.5 m and replicates a small office environment (Bauman & Arens 1988). The chamber incorporates an actively conditioned annular cavity surrounding the test space, enabling independent regulation of window surface temperatures and spatial radiant conditions. For this experiment, it could host up to six participants at the same time, each seated at a workstation equipped with a desk, office chair, laptop, and a mouse. Figure 1 shows the room layout in more detail.
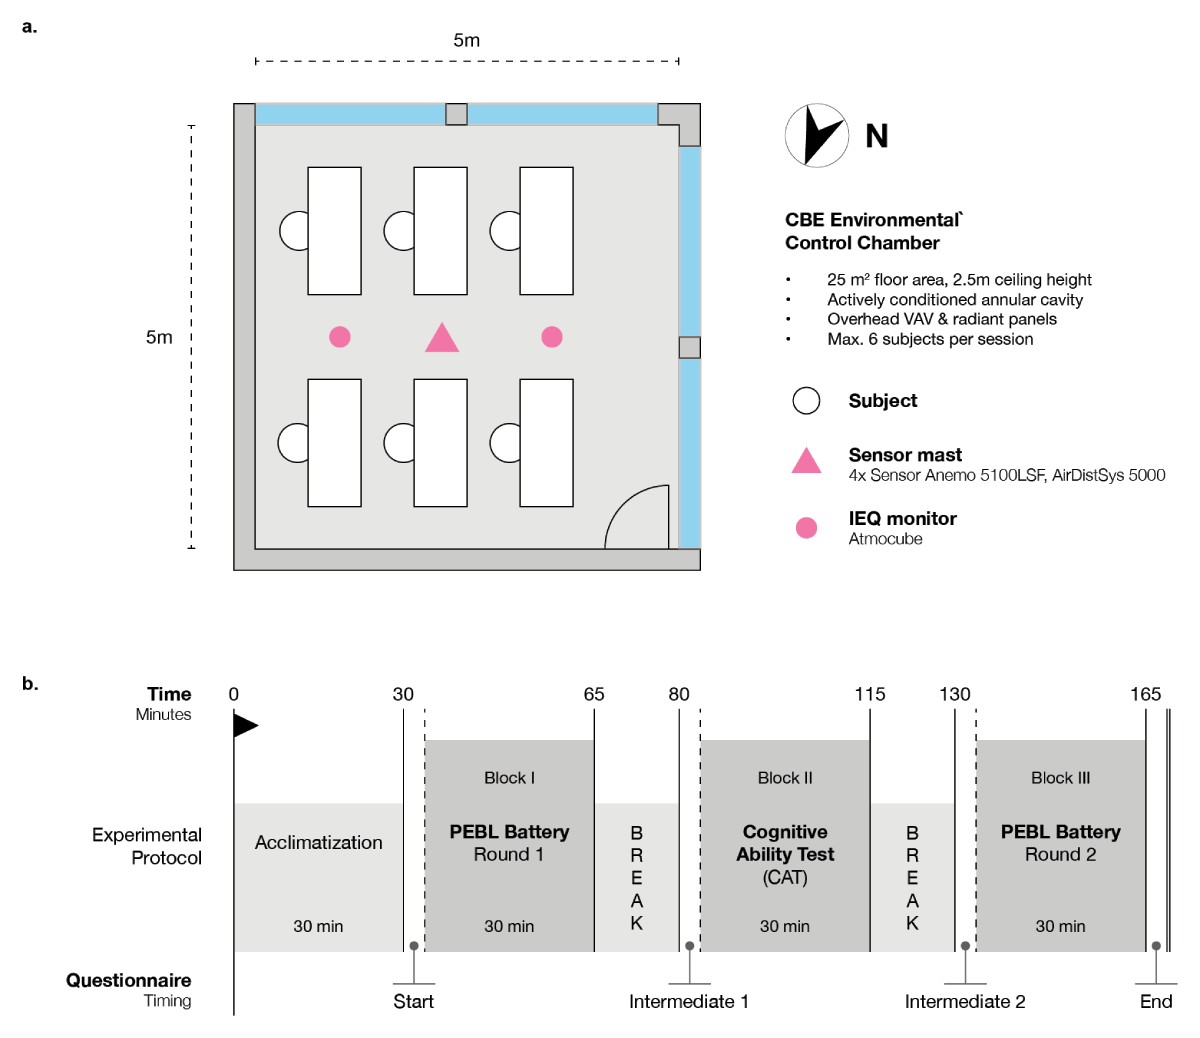
Figure 1
(a) The Center for the Built Environment (CBE) Environmental Control Chamber layout; and (b) experimental protocol.
A dedicated air-handling unit supplied conditioned air through a variable air-volume system with fixed ceiling-diffuser terminal positions, keeping ventilation rates constant while the supply air temperature was adjusted to maintain the indoor setpoints. To avoid radiant asymmetry and provide a homogeneous thermal environment, radiant ceiling panels were operated at the same setpoint temperatures as the variable air-volume system. Other environmental parameters were kept as constant as possible across conditions: relative humidity was maintained at 50–55%, air speeds were kept at < 0.1 m/s, and artificial lighting was used only when daylight levels were insufficient to maintain 500 lux. CO2 concentration was monitored continuously, including during and after participant breaks, and kept at near-ambient levels through constant supply of fresh air via mechanical ventilation.
2.3 PARTICIPANTS
In total, 84 healthy adults who attended at least one experimental session were recruited through flyers, emails, and a campus-wide online recruitment system. A total of 75 participants attended all four sessions and self-reported their sex prior to the study. Demographic characteristics are summarized in Table 1. For the statistical analysis (Section 2.6), only data from this subset of participants were used.
Table 1
Summary of demographic information (mean ± SD) on 75 study participants who attended all four conditions.
| SEX | PARTICIPANTS | AGE (years) | HEIGHT (m) | WEIGHT (kg) | BODY MASS INDEX (BMI) |
|---|---|---|---|---|---|
| All | 75 | 25.9 ± 7.3 | 1.66 ± 0.11 | 68.8 ± 11.8 | 25.1 ± 4.5 |
| Female | 38 | 25.3 ± 7.9 | 1.60 ± 0.07 | 64.4 ± 11.7 | 25.2 ± 4.6 |
| Male | 35 | 26.7 ± 6.8 | 1.72 ± 0.10 | 73.3 ± 10.2 | 24.9 ± 4.4 |
| Unspecified | 2 | 22.5 ± 0.7 | 1.65 ± 0.00 | 75.0 ± 9.9 | 27.5 ± 3.6 |
2.3.1 Sample size and statistical power
The target sample size was set at approximately 30% larger than the Singapore experiment (n = 58) to improve statistical power and the precision of effect size estimates. An a priori power analysis confirmed adequate statistical sensitivity for the within-subjects design. A intraclass correlation coefficient (ICC) of 0.75 estimated from the linear mixed-effects model reflects the high between-participant consistency in Cognitive Ability Test (CAT) scores. Applying the corresponding within-subjects non-centrality parameter (see equation 1), the design provided 84.1% power at α = 0.05 to detect an effect as small as ηp² = 0.01 (Cohen’s f = 0.101). This exceeds the conventional 80% criterion.
2.3.2 Eligibility and session requirements
All materials and tests were in English, so sufficient English proficiency was a strict requirement. Before the experimental sessions, participants attended an onboarding meeting where they were able to practice the cognitive tests and learned how the physiological equipment would be attached and used.
Participants self-reported the absence of chronic cardiovascular or respiratory conditions, major surgeries within the past year, and sleep disorders. They had all lived in the San Francisco Bay Area for at least six months. No medical examinations were conducted. Participants were instructed to avoid alcohol or drug use for 24 hours before each session, sleep adequately, and refrain from vigorous exercise or smoking for at least 1 hour before arrival. Participants were also asked to wear the same type of clothing at every session: a short-sleeved shirt or blouse, lightweight long trousers, socks, and closed shoes. This corresponds to an estimated clothing insulation level of 0.6 clo (including the chair) and typical office attire in the region. Compliance with these requirements was self-reported at arrival. Participants who did not meet the protocol conditions (e.g. incorrect clothing) were asked to return at a later date.
2.3.3 Compensation
Participants were compensated with hourly gift vouchers and received performance and completion bonuses to encourage consistent attendance and effort, with participants scoring in the top 20% across all cognitive performance tests receiving additional bonus prize payments ranging from US$30 to US$150 depending on their results. Performance-based incentives were used intentionally as an analogue for the motivational factors (intrinsic interest, professional expectations, career consequences) that shape effort in real office settings, consistent with established practice in experimental psychology research on motivated performance (Bonner & Sprinkle 2002).
2.4 MEASUREMENTS
2.4.1 Environmental conditions
The physical environment was monitored continuously at 1-minute intervals using a sensor mast located at the room center (air temperature and air speed at four heights: 0.1, 0.6, 1.1, and 1.7 m) and two Atmocube IEQ monitoring units placed at representative desk locations (air temperature, relative humidity, CO2, particulate matter, light intensity, and background noise). Records of the chamber’s temperature thermostat were also exported. Full instrument models and accuracy specifications are provided in the supplemental data online (‘Instrumentation’).
Air temperature was controlled to remain within ±0.5°C of the setpoint in all conditions while maintaining the other parameters within narrow ranges (Table 2). Temperature was measured at 1.1 m height. The mean CO2 stayed at < 580 ppm, indicating that the room was abundantly ventilated.
Table 2
Means for key environmental parameters measured during sessions.
| SESSION | Tair (°C) | RELATIVE HUMIDITY (%) | CO2 (ppm) |
|---|---|---|---|
| 21C | 21.3 (0.2) | 54.3 (3.3) | 579 (81) |
| 23C | 23.2 (0.2) | 53.0 (1.5) | 572 (73) |
| 25C | 25.0 (0.3) | 51.0 (3.0) | 572 (63) |
| 27C | 26.9 (0.2) | 49.4 (4.3) | 570 (80) |
[i] Note: Temperature measurements are averages (SD) from the central-mast sensor and the two Atmocube units.
2.4.2 Subjective assessments
On their first visit, participants completed an onboarding questionnaire that included demographics, self-reported health patterns, the Highly Sensitive Person scale (Aron & Aron 1997), the Satisfaction with Life Scale (Diener et al. 1985), and the Ten-Item Personality Inventory (Gosling et al. 2003).
During each experimental session, participants completed short questionnaires at four time points spaced across the protocol (see Experimental Procedure). The questionnaire content followed the same structure described by Porras-Salazar et al. (2024) and is available in the public repository associated with that publication. All questionnaires were administered online via Qualtrics.
2.4.3 Physiological measurements
Dorsal skin temperature and heart activity were monitored continuously. For skin temperature, iButton sensors (DS1923, USA, 20–85°C, accuracy: ±0.1°C, resolution: 0.0625°C) were attached to the back of the non-dominant hand using medical tape and data were logged at 1-minute intervals. In addition, heart rate and heart rate variability were measured using the Polar H10 (Polar Electro Oy, Finland) chest strap paired with the Elite heart rate variability app. Participants wore the strap in direct contact with the skin. Raw RR interval data were extracted and used to calculate heart rate, heart rate variability, and root mean square of successive differences (RMSSD). Heart rate and RMSSD served as indices of autonomic and parasympathetic activity, respectively (Shaffer & Ginsberg 2017).
2.4.4 Work-performance assessments
Cognitive performance was assessed using two types of tests. The first was a neuropsychological assessment using eight tests from the PEBL Psychological Test Battery, a validated open-source platform with established psychometric properties (Mueller & Piper 2014), measuring performance across five cognitive domains: Working Memory; Executive Function; Attention; Processing Speed; and Decision Making. Participants completed this test battery twice during each session (see Experimental Procedure for timing). Table 3 provides an overview of the cognitive domains, applied tests from the PEBL battery, and primary outcome metrics used in this study. Each individual paradigm employed is independently validated across neuropsychological literature (Diamond & Fiske 2013; Lezak 2012; Sherman et al. 2022).
Table 3
Cognitive domains assessed with PEBL Psychological Test Battery and sorted in the order in which they were completed.
| TEST | COGNITIVE DOMAIN | TEST METRICS |
|---|---|---|
| Berg Card Sorting Test (BCST) | Executive Function | Perseverative errors, trials |
| Corsi Blocks | Working Memory | Span, correct trials |
| Flanker Task | Attention | Response time, accuracy |
| Match-to-Sample | Attention | Response time, accuracy, errors |
| Paired Associates | Working Memory | Correct responses, errors |
| Tower of London (ToL) | Executive Function | Moves, time |
| Trail Making (Simple + Mixed) | Processing Speed/Executive Function | Time, clicks |
| Balloon Analog Risk Task (BART) | Decision-Making | Mean/total pumps |
Descriptions of each PEBL subtest are provided in the supplemental data online (‘PEBL Test Descriptions’), with full methodological descriptions also available in Porras-Salazar et al. (2024). Participants could exit individual tests before completion. Any run with fewer than 80% of expected responses was excluded from analysis, as described in Section 2.6.
For the second type of assessment, participants completed a Cognitive Ability Test (CAT) similar to the Wonderlic assessment (Hunter 1989), which included 50 multiple-choice questions to be answered within 12 minutes. The questions covered numerical reasoning (about 40%), logic and deductive reasoning (about 20%), verbal reasoning (about 26%), and general knowledge (about 14%). Participants could use pen and paper but not calculators and could work on the question without following a specific order. Participants completed the CAT once per session.
2.5 EXPERIMENTAL PROCEDURE
A repeated-measures design was used. Each participant was exposed to all four temperature conditions and served as their own control. Two sessions per day were conducted, starting at either 09.00 or 14.00 hours, from Monday to Friday. Participants could attend sessions at different times of day; the time of day was therefore a potential source of within-person variability. However, because the session order, and with it the association between any given temperature condition and time of day, was fully counterbalanced across participants, no temperature condition was systematically overrepresented in the morning or afternoon slots at the group level, making systematic confounding by time of day unlikely. An overview of the session order distribution is provided in Table S2 in the supplemental data online.
Participants were asked to schedule sessions according to their assigned exposure order, but were otherwise given flexibility to attend sessions whenever their schedule allowed. The only firm constraint was that no two sessions could be completed on the same calendar day. Most participants completed all four sessions within 2 weeks, although some needed slightly longer because of short study breaks due to holidays and examination periods. Each session lasted 165 minutes. Participants arrived 15 minutes early to attach the heart-rate strap and skin temperature sensors.
Each participant followed their own schedule and began a 30-minute acclimatization period once seated in the chamber. During this time, participants sat quietly at their workstations and no structured tasks were assigned; they were free to read or use their phone, but no work or cognitive tasks were given. Since Porras-Salazar et al. (2024) observed a lack of acclimatization, for this study the acclimatization period was extended by 15 minutes relative to the original protocol. After the acclimatization period, participants completed three testing blocks separated by 15-minute breaks. Participants could drink water or leave the room for up to 5 minutes during breaks; those who exited were required to wait 15 minutes before starting the next block.
Participants completed questionnaires at four points across the protocol: at arrival (‘Start’), after the first test block (‘Intermediate 1’), after the second test block (‘Intermediate 2’), and at the end of the session (‘End’). They completed the PEBL Test Battery twice, at the beginning and end of the session (Blocks I and III), and the CAT once during the middle block (Block II). The test order remained the same for all participants across all sessions. The experimental protocol was approved by the Committee for the Protection of Human Subjects of the University of California, Berkeley (CPHS 2024-11-18013).
2.6 DATA PROCESSING AND ANALYSIS
All raw environmental, physiological, and cognitive performance data were imported and organized using Python and the pandas (McKinney 2018) library. Separate data streams were merged using the session ID, participant ID, and datetime information.
For statistical analysis, only participants who completed all four sessions were included (n = 75), since the repeated-measures analysis of variance (ANOVA) requires a fully balanced design. The statistical analysis was performed in R using the tidyverse (Wickham et al. 2019) and rstatix (Kassambara 2023) packages. All visualizations were generated using ggplot2 (Wickham 2016). For all repeated-measures ANOVAs, sphericity was assessed using Mauchly’s test and Greenhouse–Geisser corrections were applied when sphericity was violated (p < 0.05). Partial eta-squared (ηp²) is reported as the measure of effect size, using the thresholds originally proposed by Cohen (1988): ηp² < 0.01 as negligible, 0.01–0.06 as small, 0.06–0.14 as medium, and > 0.14 as large.
To complement null hypothesis significance testing and properly characterize null results, equivalence tests were conducted for primary cognitive outcomes using the omnibus F-test approach, an ANOVA-based generalization of the two one-sided tests (TOST) procedure (Campbell & Lakens 2021). The equivalence bound was set at ηp² = 0.01, consistent with Cohen’s (1988) negligible-effect threshold and the smallest effect size that the Singapore study was designed to detect (Porras-Salazar et al. 2024). Thermal perception responses (sensation, preference, and acceptability) are ordinal and were therefore analysed using Friedman tests with Bonferroni-corrected post-hoc pairwise comparisons. As a sensitivity check, the primary CAT analysis was also repeated using a linear mixed-effects model with a random intercept per participant (lmerTest package; Kuznetsova et al. 2017; Satterthwaite degrees of freedom).
To account for missing or incomplete data arising from technical issues or participants inadvertently exiting tests early, the following inclusion criteria were applied. For the CAT test, only fully completed samples were included. For the PEBL battery, which required participants to complete two rounds (Blocks I and III) with multiple runs per test, data from a session were included if at least one complete round was finished. A test was considered complete if the participant finished at least 50% of the standard number of runs (e.g. a minimum of two out of three required runs), and a run was counted as complete if it contained at least 80% of the expected responses. Overall, missing and incomplete data were minimal, with only 0.3% of runs affected. On three occasions, participants were mistakenly administered the CAT form from an earlier session rather than the form intended for that session, meaning they had already seen the questions; these sessions’ CAT scores were therefore excluded from analysis.
3. RESULTS
3.1 ENVIRONMENTAL CONDITIONS
Table 2 summarizes the environmental conditions for each session type. Because the chamber’s actively conditioned annular cavity and ceiling-mounted radiant panels operated at the same setpoint as the air, window and surface temperatures closely tracked air temperature, allowing air temperature, mean radiant temperature, and operative temperature to be used interchangeably for interpretation (Dawe et al. 2020). Relative humidity, CO2, and other monitored variables also remained within their prescribed ranges across all four session types.
3.2 THERMAL PERCEPTION
Each of the four questionnaires outlined in the protocol graphic (Figure 1) contained a set of questions targeting thermal perception. These included questions on (1) thermal sensation, (2) thermal preference, and (3) thermal acceptability, and used the ordinal scales recommended in ASHRAE 55 (ASHRAE 2023). This generated up to 300 responses per question and condition (75 participants × 4 questionnaire time points per session).
Thermal responses across the four temperature conditions showed a consistent progression in sensation, preference, and acceptability (Figure 2). At 21°C, participants predominantly reported slightly cool and cool sensations, with a clear preference for warmer conditions (52%), though acceptability remained largely positive. At 23°C, sensations shifted toward neutral and most participants preferred no change (58%), indicating that this condition was close to thermal neutrality, with acceptability reaching its highest levels (very acceptable: 46%). At 25°C, sensations spread across neutral, slightly warm, and slightly cool, with preference still dominated by no change but an emerging tendency toward cooler; acceptability remained high. By 27°C, sensations shifted clearly toward the warm side, most participants preferred the environment cooler (64%), and acceptability decreased, with notable increases in unacceptable ratings. Overall, the three constructs followed a coherent pattern: participants felt predominantly too cool at 21°C, near neutral around 23–25°C, and mostly too warm at 27°C, with preference and acceptability shifting accordingly. This convergence across sensation, preference, and acceptability indicates a consistent range of thermal comfort centered between approximately 23 and 25°C.
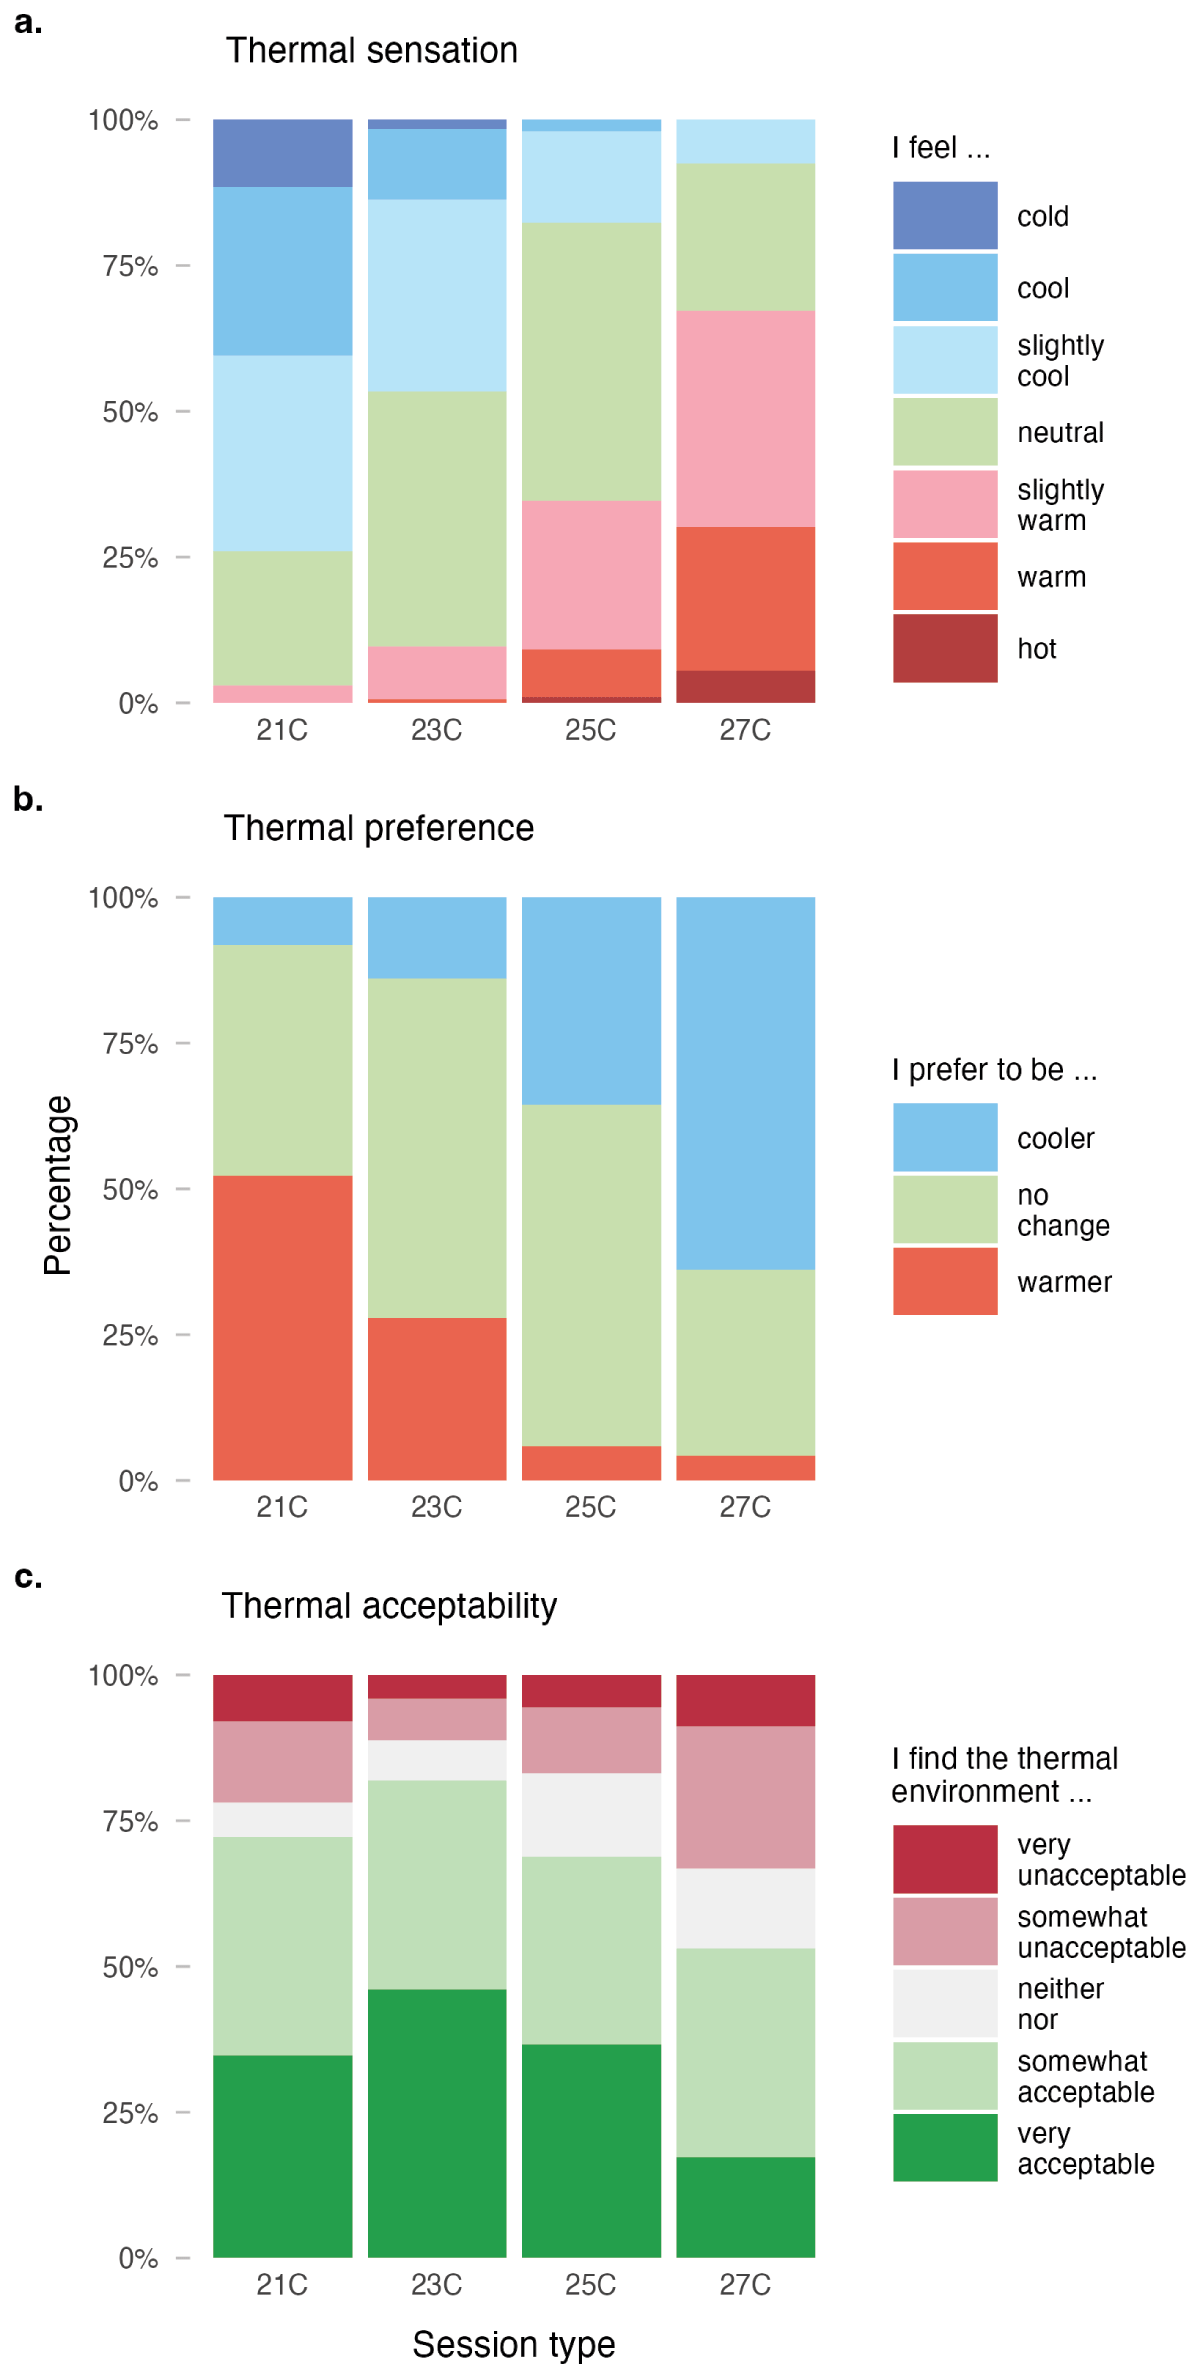
Figure 2
Distribution of survey responses to thermal perception across experimental conditions: (a) thermal sensation, (b) thermal preference, and (c) thermal acceptability.
Friedman tests confirmed statistically significant effects of temperature on all three perception measures. Thermal sensation showed the strongest concordance (χ²(3) = 167.18, p < 0.001, Kendall’s W = 0.774), with all six pairwise comparisons between conditions differing significantly after Bonferroni correction (all padj < 0.001). Thermal preference showed similarly strong agreement (χ²(3) = 131.88, p < 0.001, W = 0.611), again with all pairs distinguishable. Thermal acceptability also differed significantly across conditions (χ²(3) = 34.48, p < 0.001, W = 0.16), though with weaker overall concordance. Post-hoc comparisons indicated that 27°C was rated significantly less acceptable than 23 and 25°C, and 23°C was rated more acceptable than 21°C, while differences between 21 and 25°C and between 23 and 25°C were not significant, meaning they offered roughly equivalent, high levels of acceptability.
3.3 OFFICE WORK PERFORMANCE (OWP)
3.3.1 Cognitive Ability Test (CAT)
Overall cognitive performance was assessed using the CAT. As shown in Figure 3(a), average CAT scores for the full sample were broadly similar across the four temperature conditions, ranging from 46.8 to 50.1 points. Participants performed best, on average, in the 21C condition (mean = 50.1, SD = 17.3) and lowest in 27C (mean = 46.8, SD = 15.9). The remaining conditions fell between these values, with no clear monotonic trend. A repeated-measures ANOVA supported this visual impression, indicating no statistically significant effect of temperature on CAT performance within the examined temperature range (F(3, 213) = 2.036, p = 0.11, ηp² = 0.028). Because a non-significant result alone cannot establish the absence of an effect, an equivalence test was also conducted. It indicated that the observed effect could not be characterized as practically negligible at the previously specified bound (ηp² = 0.01; pequiv = 0.671), suggesting that a small true effect of temperature on work performance cannot be entirely ruled out.
CAT scores rose consistently across the four repeated administrations, independent of session temperature (see the supplemental data online, ‘CAT Learning Effect’), motivating the use of a linear mixed-effects model with trial number as a covariate, rather than a simple mean correction, in the performer-subgroup analysis below.
High- and low-performing participants
To explore whether higher and lower performing individuals responded differently to temperature, the analysis was repeated separately for the top and bottom 25% of participants by average CAT score (Figure 3). Because subgroup membership was not known before the experiment, session order was less balanced within these groups than in the full cohort (see Table S2 in the supplemental data online). A linear mixed-effects model was fitted for each subgroup with session type and trial number (1–4) as fixed effects and a random intercept per participant, estimating the temperature effect after accounting for individual-level learning. Scores displayed in Figure 3(b) retain the mean-corrected adjustment described in the supplemental data online (‘Learning Effect’) for visual interpretability; all reported statistics derive from the linear mixed model (LMM).
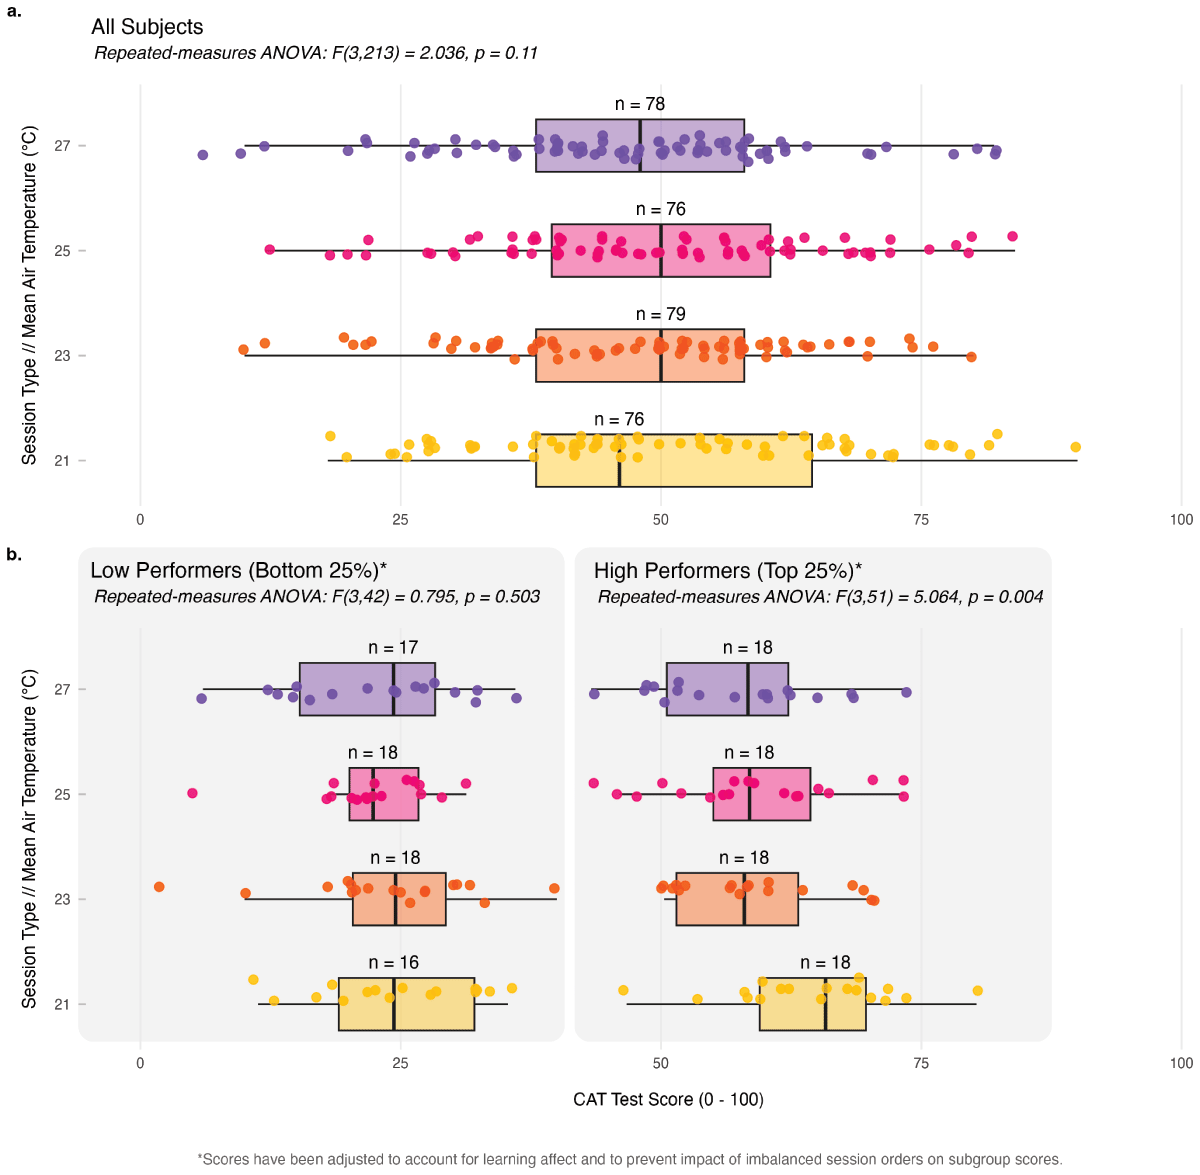
Figure 3
Cognitive Ability Test (CAT) performance across temperature conditions: (a) individual participant CAT scores (points) for the full sample plotted against average session temperatures; and (b) CAT scores for the bottom and top 25% of performers shown as a function of average measured session air temperatures and corrected by the calculated mean learning effect for visual display
Note: Reported statistics derive from a linear mixed-effects model.
Low performers (Figure 3b, left) exhibited a narrow range of mean scores, from 29.1 to 31.5 points. The LMM for this subgroup revealed no statistically significant effect of temperature on CAT scores after controlling for trial number (F(3, 50) = 0.849, p = 0.474, ηp² = 0.048). Equivalence testing likewise did not confirm a negligible effect at the pre-specified bound (pequiv = 0.451).
High performers (Figure 3b, right) showed a wider spread in mean scores, from 65.0 to 72.8 points. In contrast to the full sample, the LMM identified a statistically significant effect of temperature on CAT scores in this subgroup after controlling for trial number (F(3, 54) = 5.689, p = 0.00185, ηp² = 0.24), representing a large effect by Cohen (1988) criteria (ηp² > 0.14). Equivalence testing confirmed that the observed effect substantially exceeded the pre-specified negligible bound (pequiv = 0.995). Exploratory post-hoc pairwise comparisons on mean-corrected scores (Bonferroni correction) indicated that the largest difference was between the 21C and 27C conditions (padj = 0.184). This finding suggests that higher performing individuals may be more sensitive to temperature variations, even though the broader sample showed no statistically significant performance changes.
As a sensitivity check, a linear mixed-effects model with a random intercept per participant applied to the full sample yielded consistent results (F(3, 222) = 1.732, p = 0.161), confirming robustness to the analytical approach.
3.3.2 PEBL Test Battery
PEBL Test Battery performance across the five cognitive domains (Table 3) is summarized in Figure 4, which shows changes by temperature condition relative to the 21°C baseline. Overall, cognitive performance remained stable across temperature conditions, with mean changes ranging from a minimum of –0.1% at 23°C to a maximum of 1.2% at 25°C, both relative to the baseline. These small fluctuations were inconsistent across domains and showed no systematic temperature-related pattern.
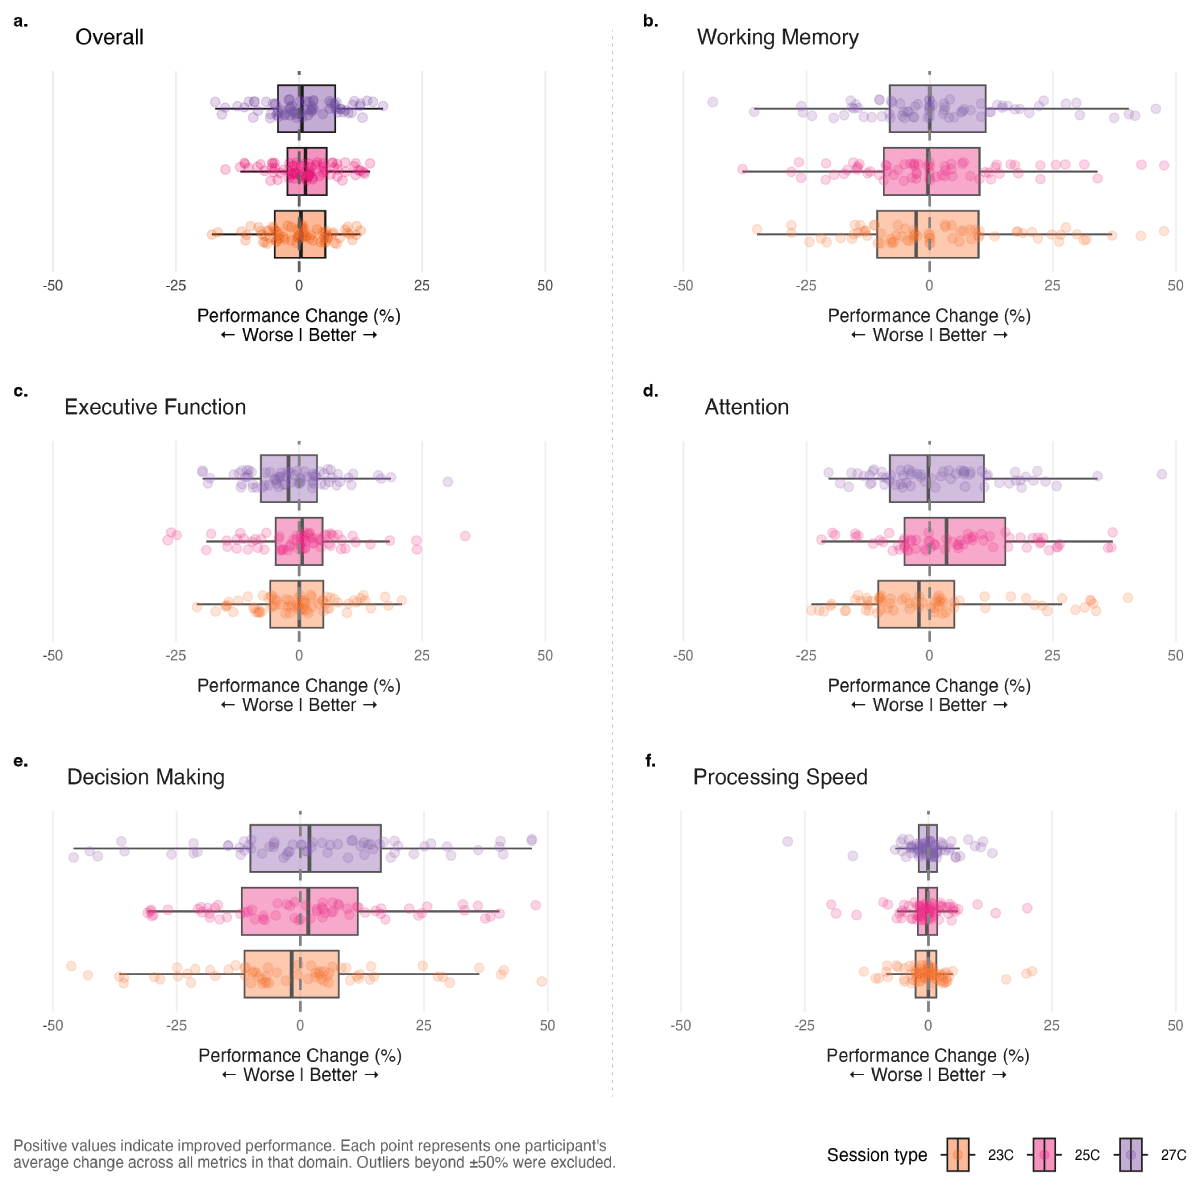
Figure 4
Performance changes across cognitive domains by temperature condition.
Note: Each panel shows the distribution of individual participant performance changes (relative to a 21°C baseline) for one cognitive domain. Box plots represent the median and interquartile range, with individual points showing participant-level averages across all metrics within that domain. Positive values indicate improved performance. Despite some variability, no systematic, statistically significant temperature effects emerged across any cognitive domain.
Attention showed the largest variability across conditions, with changes reaching 5.1% at 25°C alongside substantial inter-individual variability, followed by Decision Making (up to 3.1% at 27°C). Working Memory and Executive Function changes were comparably modest, and Processing Speed was the most consistent domain.
Detailed test-by-test results and statistical analyses are provided in Table S1 in the supplemental data online. After excluding parameters that showed ceiling effects or negligible variation across conditions (changes < 1%), none of the retained PEBL metrics showed a statistically significant effect of session temperature (all p > 0.11 (70)), with percent changes relative to the 21°C condition generally small (±1–5%).
To provide a more interpretable summary across the large number of individual metrics, domain-level composite scores were computed by z-scoring each metric across all participants and sessions, reversing the sign for lower-is-better measures (response times, variability, and move-count metrics), and averaging within domain (Decision Making excluded, as Balloon Analog Risk Task (BART) measures risk-taking tendency rather than performance accuracy). Domain-level repeated-measures ANOVAs confirmed no statistically significant temperature effect for any of the four retained domains (n = 70; Greenhouse–Geisser corrected where sphericity was violated—Executive Function, Attention, and Processing Speed) (Table 4). Equivalence testing confirmed a negligible temperature effect only for Working Memory (pequiv = 0.0491); for the remaining three domains, equivalence at the ηp² = 0.01 threshold could not be confirmed, so small effects of temperature on work performance in these domains cannot be fully ruled out.
Table 4
Domain-level PEBL Psychological Test Battery composite results.
| DOMAIN | n | F(df1, df2) | p | ηp² | pequiv | EQUIVALENT |
|---|---|---|---|---|---|---|
| Working memory | 70 | F(3, 207) = 0.229 | 0.876 | 0.003 | 0.0491 | Yes |
| Executive function | 70 | F(2.42, 167) = 1.726 | 0.174 | 0.024 | 0.6050 | No |
| Attention | 70 | F(2.27, 157) = 1.131 | 0.330 | 0.016 | 0.4360 | No |
| Processing speed | 70 | F(1.93, 133) = 0.865 | 0.420 | 0.012 | 0.3720 | No |
[i] Note: Z-score composites were computed by averaging direction-corrected metrics within each cognitive domain. Greenhouse–Geisser corrections applied where sphericity was violated (df1 < 3). Decision-making excluded (Balloon Analog Risk Task (BART) measures behavioral tendency, not performance accuracy). pequiv is from the equivalence F-test with bound ηp² = 0.01.
Analysis of high- and low-performing participants (top and bottom 25% by CAT score) similarly revealed no statistically significant temperature effects in the PEBL battery for either subgroup, with no evidence of differential sensitivity; these results are not discussed further.
3.4 PHYSIOLOGICAL MEASUREMENTS
3.4.1 Hand skin temperature and heart rate
Figure 5 summarizes the physiological responses across the four temperature conditions. Hand skin temperature increased systematically with session temperature, ranging from 29.8°C in the 21°C condition to 33.8°C in the 27°C condition, with intermediate values of 31.3°C at 23°C and 32.8°C at 25°C. In addition to these differences in average levels, the trajectories show a noticeable downward drift in the cooler conditions: during both the 21 and 23°C sessions, hand skin temperature gradually declined after the acclimatization period, reaching values in the high 20s by the end of the exposure. This pattern suggests progressive peripheral cooling under the lower temperature conditions, consistent with thermoregulatory vasoconstriction. An alternative explanation is a declining metabolic rate due to prolonged sedentary work. However, since no systematic decline was observed in the warmer conditions, where vasodilation would likely dominate any metabolic effect, thermoregulatory vasoconstriction remains the more plausible interpretation.
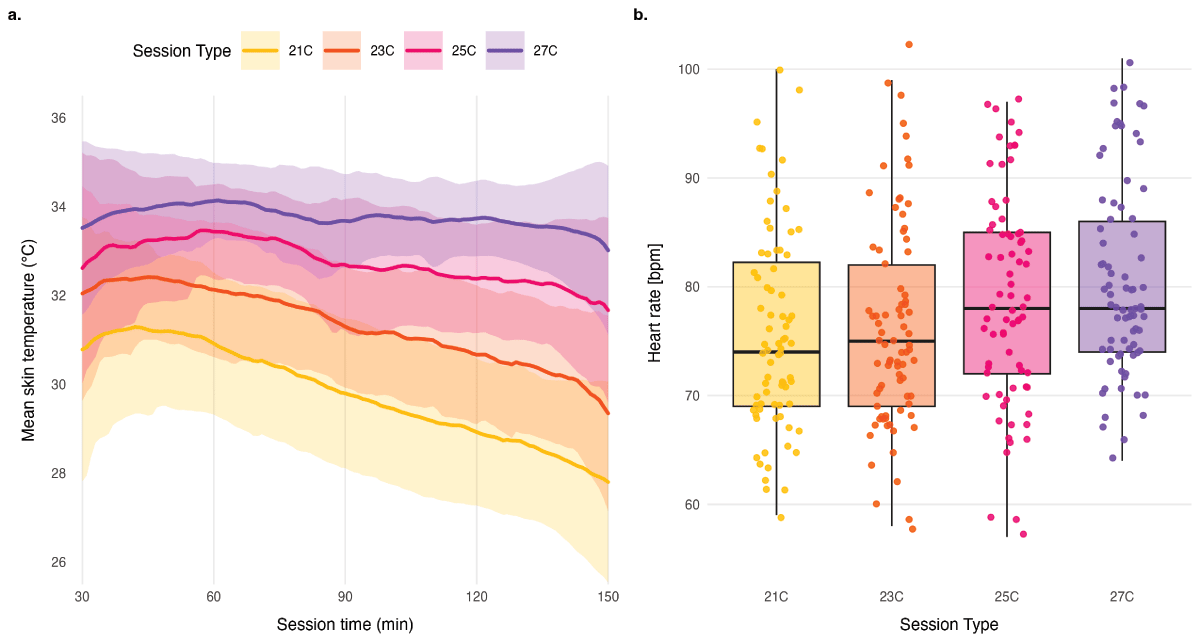
Figure 5
Physiological responses across temperature conditions: (a) mean non-dominant hand skin temperature across all participants by session type, shown over the session duration (starting after the 30-min acclimatization period); and (b) distribution of participants’ mean heart rate (beats per minute; bpm) grouped by session type.
Mean heart rate remained relatively stable across the lower temperatures (76 and 76 beats per minute (bpm) in 21C and 23C, respectively) and increased modestly at the higher temperatures (79 bpm in 25C, 81 bpm in 27C), with comparable variation across conditions (SD range = 11–10 bpm).
3.4.2 Root mean square of successive differences (RMSSD)
Figure 6 presents RMSSDs across the four temperature conditions. RMSSD captures short-term, beat-to-beat changes in cardiac activity by quantifying variability between successive RR intervals. RMSSD is widely used as a marker of vagally mediated heart rate variability, with higher values generally associated with stronger parasympathetic tone; however, it is not a pure readout of parasympathetic activity and may also be influenced by respiratory variation, cognitive task demands, and the level at which recordings are summarized.
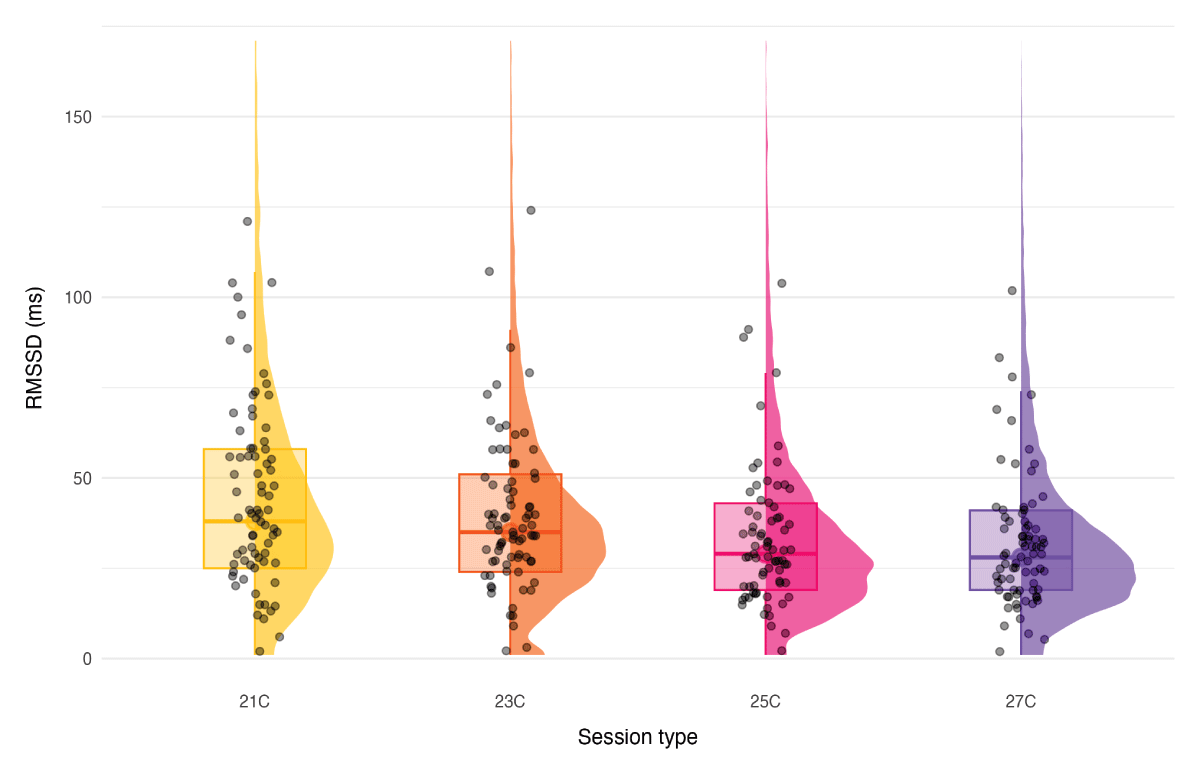
Figure 6
Root mean square of successive differences (RMSSD) across temperature conditions: distribution of session-level RMSSDs for the four temperature conditions.
Note: Each point represents an individual participant’s median RMSSD for a single session. A higher RMSSD indicates greater parasympathetic activity and lower stress levels. The progressive decrease in RMSSD with increasing temperature remained significant after controlling for heart rate, indicating autonomic responses to elevated ambient temperature.
Mean RMSSD decreased with increasing temperature, ranging from 45 ms in the 21°C condition to 34 ms at 27°C (intermediate values: 41 ms at 23°C, 35 ms at 25°C; SD range: 30–27–25–24 ms). Statistical analysis confirmed a significant effect of temperature on RMSSD (F(3, 222.3) = 21.16, p < 0.001).
To examine whether this temperature effect was independent of heart rate changes, a sensitivity analysis was conducted following the recommendations of Geus et al. (2019). After controlling for heart rate as a covariate, the temperature effect on RMSSD remained significant after adjustment (F(3, 226.3) = 7.08, p < 0.001), suggesting that the association between temperature and RMSSD is not attributable to heart rate changes alone.
Together, the RMSSD, heart rate, and skin temperature findings indicate a consistent, temperature-dependent shift in autonomic and thermoregulatory state across the four conditions, with the RMSSD effect persisting after heart rate adjustment.
4. DISCUSSION
The present study replicated the experimental protocol of Porras-Salazar et al. (2024) in a temperate climate and with a larger participant sample to assess whether indoor temperature within a typical office range influences OWP. Overall, the findings align closely with the Singapore study: no statistically significant effect of temperature on cognitive performance was found across the 21–27°C range, despite measurable physiological differences across conditions. Porras-Salazar et al. reported the same pattern in their tested range of 23–29°C. These results add to the growing body of controlled experimental evidence suggesting that, within commonly encountered office temperatures and across different climatic regions, the effect of thermal conditions on OWP is limited.
Across the full sample, no statistically significant difference in Cognitive Ability Test (CAT) performance was found for the four temperature conditions, though the equivalence test did not confirm this difference to be negligible, so a small true effect cannot be ruled out. This is in line with the non-significant result reported by the Singapore study for the almost identical test battery and supports previous laboratory work reporting weak or task-specific effects within comparable temperature ranges (Maula et al. 2016). Performance on the neuropsychological tests (PEBL) showed no statistically significant effect of temperature in any of the four cognitive domains examined, with no systematic patterns across executive control, working memory, attention, or processing speed. Equivalence testing confirmed this difference was negligible only for working memory, so small effects in the remaining three domains cannot be fully ruled out. These results are consistent with earlier studies in which short, structured laboratory tasks showed limited sensitivity to moderate thermal changes (Maula et al. 2016; Porras-Salazar et al. 2024).
Several studies cited in Section 1 reported measurable effects that this replication did not, and the specific conditions under which those effects emerged might help explain the divergence. Tanabe et al. (2007) exposed participants to temperatures up to 33°C across a series of climate-chamber experiments and found effects that were themselves contradictory across task types. Notably, where cerebral blood flow increased significantly at the highest temperature, task performance did not differ significantly from cooler conditions, indicating that physiological cost can rise without a corresponding behavioral decrement, a pattern consistent with the physiology–performance dissociation reported below. Maula et al. (2016) compared 23 with 29°C, 2°C above the upper bound tested here, and found a significant decrement on only one of six administered tasks (an n-back working memory task), with self-assessed performance unaffected by temperature. Geng et al. (2017) tested a considerably wider 16–28°C range (n = 21). Their own fitted quadratic model, evaluated specifically within 21–27°C, predicts relative productivity varying by only around 3 percentage points across that band, indicating that the significant overall relationship they reported was driven primarily by conditions outside the range examined here.
The most direct challenge comes from Lan et al. (2022), whose 24–28°C range overlaps almost entirely with the present study. Several methodological differences, however, complicate a direct comparison. To hold perceived thermal comfort constant across their three conditions, clothing insulation was reduced from 0.7 to 0.5 clo and a ceiling fan was switched on only at the highest temperature (raising air velocity from < 0.1 to 1.0 m/s). Relative humidity also varied between conditions (59–66%). The authors themselves note (Lan et al. 2022: 7, fig. 2 caption) that the reported performance trend ‘should not be interpreted as being due only to differences in air temperature,’ and the non-monotonic pattern observed for several tasks, with larger decrements at the intermediate than at the highest temperature, is consistent with the compensatory increase in air movement partially offsetting the effect of the warmest condition. Participants in that study were paid a fixed hourly rate with no performance-based incentive, and the sample (n = 36) was less than half the size of the present study. By contrast, the present design held clothing, air velocity, and relative humidity fixed across all four conditions, used performance-based incentives to encourage sustained effort, and enrolled a larger sample with confirmed statistical power (n = 75; 84.1% power at α = 0.05 to detect an effect as small as ηp² = 0.01). These design choices isolate the effect of air temperature more directly from co-varying compensatory adjustments, at the cost of not addressing the related but distinct question of whether performance can be preserved when comfort itself is actively maintained as temperature rises.
A notable exception emerged among the highest-performing CAT participants (top quartile), for whom a statistically significant and large effect of temperature on performance was identified (ηp² = 0.24, exceeding the > 0.14 large-effect threshold). Scores were highest at cooler conditions and declined at warmer conditions, with the largest difference between the coolest and warmest sessions. Importantly, this finding was produced by an LMM that models each participant’s learning trajectory individually, so the result is not an artefact of how learning was handled. No statistically significant temperature effect was detected for low performers or in the PEBL tests, even among high-performing participants.
This finding aligns with the broader pattern identified by Lin et al. (2025) in their meta-analysis of the typical office temperature range: pooled across included studies, a significant performance decrement > 25°C emerged for cognitively demanding (‘skilled’) tasks (standardized mean difference (SMD) = –0.15, p = 0.02) but not for routine tasks (SMD = –0.01, not significant), and only for exposures exceeding 1 hour, a threshold the present 165-minute sessions exceed. The CAT, which imposes uniform time pressure across a heterogeneous set of questions, plausibly falls into the more demanding category, whereas the PEBL subtests are more bounded and self-paced. High-performing participants, operating closer to their cognitive ceiling under time-constrained conditions, may also have less spare capacity to buffer environmental perturbations than participants performing in the middle or lower range, distinguishing the role of task demand from that of performer level as potential moderators of the temperature–performance relationship. This subgroup, however, comprised only around 18 participants, was identified post hoc rather than pre-specified, and effect sizes estimated from subsamples of this size carry considerable uncertainty. The finding is therefore best read as consistent with, rather than confirmatory of, the task-demand and exposure-duration moderators identified in the wider literature, and as motivation for a pre-registered replication rather than a settled result.
The disconnect between physiological activation and cognitive performance that did not significantly vary with temperature warrants consideration; similar physiological trends have been reported in other controlled studies (Lan et al. 2022). The dorsal hand skin temperature data reflect active thermoregulatory responses across conditions, with vasodilation at warmer temperatures driving progressively higher peripheral temperatures. Within the 21–27°C range studied here, these thermoregulatory demands appear to have been manageable without a statistically significant effect on cognitive output. This interpretation aligns with the Maximal Adaptability Model’s prediction of a central adaptive zone in which compensatory mechanisms are sufficient to maintain performance, in contrast to conditions beyond this zone where physiological demands overwhelm available resources. The absence of significant performance effects across the 21–27°C range is consistent with these conditions falling within the adaptive zone proposed by the model. Whether 27°C constitutes the upper boundary of this zone cannot be determined from the present data alone, as temperatures > 27°C were not tested.
Taken together, the results contribute to the growing body of evidence suggesting that wider office temperature ranges do not strongly influence OWP within typical setpoint bands. This conclusion aligns with Porras-Salazar et al. (2021), who found that none of the widely cited models linking continuous temperature to performance validated well against independent data (R² ≥ 0.05), casting doubt on the existence of a simple, generalizable dose–response function relating the two. A more recent meta-analysis using a categorical, moderator-based approach rather than a continuous curve reached a more qualified conclusion. Lin et al. (2025) found a small but significant pooled decrement in performance > 25°C, concentrated in cognitively demanding tasks and only after exposures longer than 1 hour. These two syntheses are not necessarily in conflict: the absence of a reliable continuous dose–response function does not preclude a real, but small and context-dependent, effect under specific conditions. The pattern observed here—no statistically significant effect across the full sample alongside a large but tentative effect confined to a demanding task among high performers—sits comfortably within this more qualified picture rather than confirming or refuting either synthesis outright. The present replication also reinforces concerns that much of the variation reported in earlier studies may stem from uncontrolled confounders, including compensatory adjustments to clothing and air movement, rather than air temperature itself (Zhang et al. 2019). By controlling these design factors and enrolling a larger, well-powered sample than most comparable studies, this study provides a more tightly isolated and higher confidence estimate of the air-temperature effect under realistic office conditions in a temperate climate.
4.1 LIMITATIONS AND OUTLOOK
Several limitations warrant consideration. Participants were mostly young, healthy adults, and the tasks were relatively short and discrete compared with the sustained, multifaceted work encountered in real offices. Although exposure duration (165 min) is longer than in many laboratory studies, it approximates a focused morning or afternoon work block rather than a full workday. The motivational context of the study, in which participants received performance-based incentives, may also differ from natural office settings where motivation varies between individuals and over time. Whether occupants in real offices would maintain the same stable performance under thermally non-neutral conditions remains an open question. The absence of a resting electrocardiogram (ECG) screening means that potential cardiac arrhythmias were not identified prior to participation, which could have influenced heart rate variability-derived metrics for a small number of participants. Gradual adaptation to wider temperature ranges over longer durations was not examined. The performer subgroup analyses (top and bottom 25% by average CAT score) were not pre-specified and each comprised approximately 18 participants, limiting statistical power; as noted above, the high-performer effect should be treated as exploratory rather than confirmatory. In addition, some neuropsychological tests exhibited ceiling effects, limiting their ability to detect performance changes. Although the tested temperature range reflects typical setpoints in US office buildings, effects at higher temperatures, particularly > 27°C, remain outside the scope of this experiment. Higher temperatures compensated by increased air movement were not tested.
Despite these limitations, the findings strengthen the evidence that OWP is robust within the thermal conditions typically found in mechanically cooled office environments. They also support ongoing efforts to broaden acceptable temperature bands as a strategy for reducing HVAC energy use without compromising performance (Kent et al. 2023; Miller et al. 2021), particularly in temperate climates where cooling setpoints are often set more conservatively than thermal comfort alone would require (Mendell & Mirer 2009). Practical implementation of broader setpoint bands should nonetheless consider occupant comfort preferences and satisfaction alongside cognitive performance, as thermal discomfort can affect motivation, absenteeism, and self-reported productivity even when objective performance metrics remain stable (Fisk & Rosenfeld 1997; Maula et al. 2016). Future research should extend these results through longer exposure periods, more complex or continuous task paradigms, and coordinated, multi-site studies using shared protocols, as recommended by Porras-Salazar et al. (2021).
5. CONCLUSIONS
The present study replicated a recent controlled experiment conducted in Singapore to examine whether indoor temperature affects short-term office work performance under typical office conditions. No statistically significant effect of temperature on performance was found on either the Cognitive Ability Test or a battery of neuropsychological tasks across the 21–27°C range, during a single 165-minute session of structured, incentivized task work, closely mirroring the original study with greater statistical power. Among the highest-performing quartile of Cognitive Ability Test (CAT) participants, a statistically significant, large-magnitude temperature-related effect (ηp² = 0.24) was observed. This result was derived from a subsample of approximately 18 participants, and was not replicated in the neuropsychological tests, so it should be treated as exploratory rather than confirmatory.
Physiological responses varied predictably with temperature without corresponding cognitive performance differences, consistent with the Maximal Adaptability Model, and strengthen the external validity of the Singapore findings through replication in a different climatic and cultural context. Together, the present experiment and previous studies lend support to modestly widening heating, ventilation and air-conditioning setpoint ranges within the 21–27°C band, with the caveat that occupant comfort and satisfaction, individual differences in temperature sensitivity, and the demands of longer duration or more varied real-world work remain open questions that a short-term, controlled study of this kind cannot resolve.
ACKNOWLEDGMENTS
Sanken and the Center for the Built Environment at the University of California—Berkeley supported this research. The authors are grateful to Dr. Ippei Izuhara and Dr. Kian Wee Chen from Sanken for their feedback, and to Dr. Jose Ali Porras-Salazar for preparing the Cognitive Ability Test (CAT) questionnaires. They also thank the dedicated undergraduate students Hejin Hong, Lana Fiona Lilienstein, Kevin Kim, and Gayle Boyd for their voluntary support throughout the experimental phase.
AI DECLARATION
During the preparation of this work, the authors utilized the chatbot Claude to enhance the language and readability of the content. Subsequently, they reviewed and edited the material as required, while maintaining full accountability for the publication’s content.
AUTHOR CONTRIBUTIONS
T.K.: conceptualization, data curation, formal analysis, methodology, investigation, project administration, software, writing—original draft, writing—review and editing, visualization. S.S.: conceptualization, funding acquisition, methodology, project administration, supervision, writing—review and editing, visualization.
DATA ACCESSIBILITY
The datasets generated and analyzed during the study are available in a Dryad Digital Repository (https://doi.org/10.5061/dryad.pnvx0k731). The analysis code is available in a public GitHub repository, together with a README file describing the dataset and how to use it (https://github.com/CenterForTheBuiltEnvironment/towp-berkeley).
ETHICAL APPROVAL
All participants provided written informed consent prior to enrolment. This work was approved by the institutional review board at the University of California—Berkeley (CPHS #2024-11-18013).
SUPPLEMENTAL DATA
Supplemental data for this article can be accessed at: https://doi.org/10.5334/bc.876.s1