
Table 1
Summary of the findings on retrofit drivers and barriers.
| REFERENCE | PLACE | PERIOD | METHODS | SUMMARY |
|---|---|---|---|---|
| Achtnicht & Madlener (2014) | Germany | 2009 | Survey with a choice experiment | Retrofits are more likely when affordable, profitable, and favorable over existing conditions |
| Alberini et al. (2013) | Switzerland | 2010 | Survey with a choice experiment | Homeowners are responsive to upfront costs, rate of return, and expected thermal comfort improvement |
| Banfi et al. (2008) | Switzerland | 2008 | Choice experiment | Consumers are under-informed of the advantages of efficiency measures and not equipped to understand their economic implications |
| Haines & Mitchell (2014) | England, UK | 2014 | Persona development and expert elicitation | Owner-occupiers are best understood not as one homogeneous group |
| Hrovatin & Zorić (2018) | Slovenia | 2010 | Survey with a questionnaire | Retrofit decisions are linked to general improvements and quality-of-life considerations. The higher age and loan repayment timeline may inhibit action |
| Gamtessa (2013) | Canada | 1998–2005 | Analysis of home audit reports | Financial incentives play an important role; higher savings and rebates lead to a higher likelihood of action |
| Jakob (2007) | Switzerland | 1986–2000 | Survey with a questionnaire | Envelope renovation is triggered by general end-of-life renovation action |
| Judson & Maller (2014) | Victoria, Australia | 2008–09, 2011 | In-person interview and property inspection | Current and anticipated everyday activities determine homeowner action |
| Nair et al. (2010) | Sweden | 2006–08 | Survey with a questionnaire | Higher perceived cost of energy leads to a higher likelihood of action |
| Frappé-Sénéclauze et al. (2017) | British Columbia, Canada | 2017 | Summary of an expert forum | Utility programs in the absence of policy will not scale as desired. Economics and market inertia limit action |
| Tjørring & Gausset (2019) | Sonderborg and Middlefart, Denmark | 2012–15 | Participant observation with interviews | Home renovations should be viewed as investments in social relations |
| Trotta (2018) | England, UK | 2011–14 | In-person interview and property inspection | Dwelling characteristics are more important that sociodemographic characteristics |
| Wilson et al. (2011) | UK | 2011 | Survey with a questionnaire | Efficiency actions are more commonly done together with general improvements |
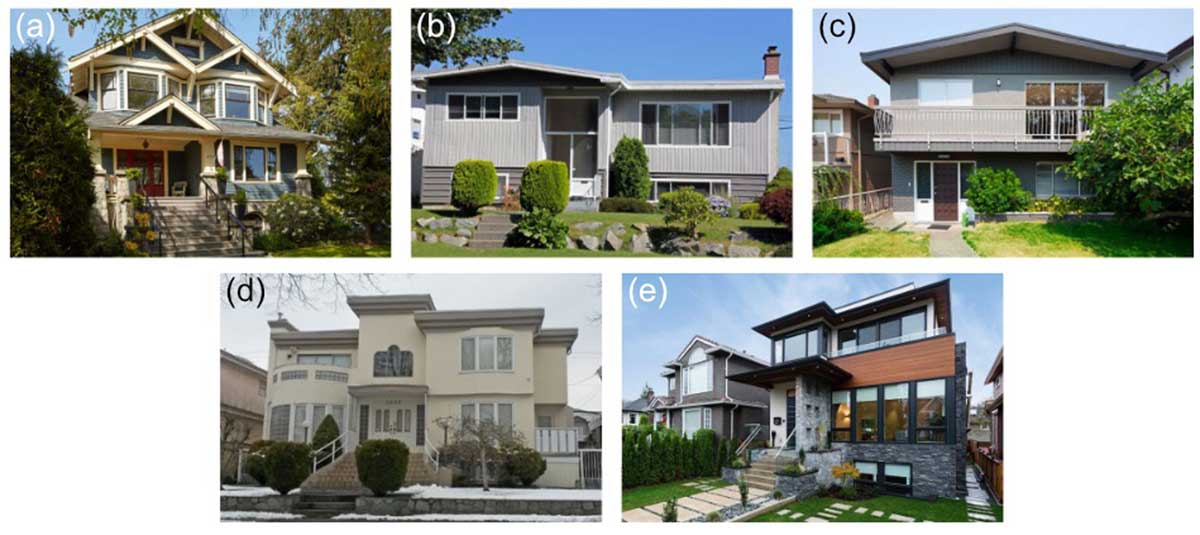
Figure 1
Sample images included in the survey for the typologies. (a) Craftsman (CR) 1910-30, (b) Mid-century Builder (MC) 1935–64, (c) Vancouver Special (VS) 1965-84, (d) Millennium Builder (MB) 1985-2009, (e) West Cost Modern (WC) 2010-Present.
Sources: (a–d) The Vancouver Heritage Foundation (2018); and (e) Connor Properties Listing (2019).
Table 2
Parameters for the house archetypes used when creating the single-detached home representative typologies. These were derived from building code review, the Vancouver Heritage Foundation database and local knowledge.
| PARAMETER | TEXT VALUES | ENCODED VALUES |
|---|---|---|
| Construction era | [1910–30, 1935–64, 1965–84, 1985–2009, 2010–present] | [5, 4, 3, 2, 1] |
| House size (ft2) | [2100, 2600, 2800, 3000, 5400] | [1, 2, 3, 4, 5] |
| Lot size (ft2) | [3135, 4000, 8400] | [1, 2, 3] |
| Energy Step Code | [Step1, Step2, Step3, Step4, Step5] | [1, 2, 3, 4, 5] |
| Secondary suite | [No, Yes] | [0, 1] |
| Wall construction | [2 × 4 batt R13, 2 × 6 exterior R21] | [1, 2] |
| Wall age (years) | [0–5, 6–10, 11–15, 16–24, ≥ 25] | [1, 2, 3, 4, 5] |
| Roof construction | [blown R15, flat ext R36] | [1, 2] |
| Roof age (years) | [0–5, 6–10, 11–15, 16–24, ≥ 25] | [1, 2, 3, 4, 5] |
| Window type | [Single U = 0.48, Double U = 0.48, Double low-E U = 0.25] | [1, 2, 3] |
| Window age (years) | [0–5, 6–10, 11–15, 16–24, ≥ 25] | [1, 2, 3, 4, 5] |
| Space heating efficiency | [0.75, 0.85, 2.70] | [1, 2, 3] |
| Space heating age (years) | [0–5, 6–10, 11–15, 16–24, ≥ 25] | [1, 2, 3, 4, 5] |
| Space heating fuel | [Natural gas, Electric, Natural gas and electric] | [1, 2, 3] |
| Domestic hot water efficiency | [0.75, 0.85, 0.95] | [1, 2, 3] |
| Domestic hot water age (years) | [0–5, 6–10, 11–15, 16–24, ≥ 25] | [1, 2, 3, 4, 5] |
| Domestic hot water fuel | [Natural gas, Electric, Natural gas and electric] | [1, 2, 3] |
| Space cooling efficiency | [None, 2.7] | [0, 1] |
| Space cooling age (years) | [None, 1] | [0, 1] |
| Space cooling fuel | [None, Electric] | [0, 1] |
| Airtightness | [Very leaky, Leaky, Middle, Tight] | [1, 2, 3, 4] |
| Maintenance level | [Never, Poor, Average, Well maintained, Very well] | [1, 2, 3, 4, 5] |
| Presence of asbestos | [No, Yes] | [0, 1] |
[i] Note: The directionality of the encoded values is relevant for the correlation portion of the study.
Table 3
Characteristic options and values used when writing the personas for the narratives.
| PARAMETER | TEXT VALUES | ENCODED VALUES |
|---|---|---|
| Homeowner age | [25–34, 35–44, 45–54, 55–64, 65–74, ≥ 75] | [1, 2, 3, 4, 5, 6] |
| Family type | [Couple, Couple + kids, Couple + kids + other, Single, Single + kids] | [1, 2, 3, 4, 5] |
| Years lived in home | [0–7, 8–14, 15–21, 22–28, ≥ 29] | [1, 2, 3, 4, 5] |
| Spending habits | [Frugal, Thrifty, Generous] | [1, 2, 3] |
| Mortgage percent of income | [0–8, 9–16, 17–24, 25–32, ≥ 33] | [1, 2, 3, 4, 5] |
| Environmental views | [None, Some, Intense] | [1, 2, 3] |
| Income level | [Below average, Average, Above Average, Retired] | [1, 2, 3, 4] |
| Credit rating | [Good, Fair, Excellent] | [1, 2, 3] |
| Plans for renovation | [No, Yes] | [0, 1] |
[i] Note: The directionality of the encoded values is relevant for the correlation portion of the study.
Table 4
Demographics of owner-occupier households against the single-dwelling home typologies.
| AGE SEGMENT (YEARS) | YOUNG (25–44 YEARS) | MIDDLE-AGED (45–64 YEARS) | OLDER (≥ 65 YEARS) | OTHER | |||||||||
|---|---|---|---|---|---|---|---|---|---|---|---|---|---|
| SGL. | CPL. | PRTS. | SGL. | CPL. | PRTS. | LONE PRT. | SGL. | CPL. | PRTS. | ||||
| 1910–35 | 0.0% | 1.2% | 0.0% | 1.2% | 2.3%* | 4.6%* | 1.2% | 3.5%* | 3.5%* | 1.2% | 1.2% | ||
| 1935–64 | 0.0% | 0.0%* | 1.6%* | 1.6% | 3.3%* | 6.5% | 1.6%* | 3.3% | 4.9% | 1.6% | 1.6% | ||
| 1965–85 | 0.0% | 0.0% | 0.8% | 0.8% | 1.6%* | 3.9% | 0.8% | 0.8% | 2.4%* | 0.8% | 1.6%* | ||
| 1986–2009 | 0.0% | 0.0% | 2.0%* | 2.0% | 4.1% | 10.2%* | 2.0% | 2.0% | 4.1%* | 2.0% | 4.1%* | ||
| 2010–present | 0.5% | 0.0% | 1.5%* | 0.5% | 0.5% | 2.4% | 0.5% | 0.0% | 0.5% | 0.0% | 2.0%* | ||
[i] Note: Percentages denote the proportion of that age group living in that age segment within the overall census population (n = 103,711).
* Narratives constructed for the pair.
Sgl. = Single; Cpl. = couple; Prt(s). = parent(s).
Table 5
Classification of 56 representative constructions addressed and returned out of 30 issued surveys; classification according to building typology and the authors’ ex-ante optimism regarding retrofit likelihood.
| CRAFTSMAN (CR) | MID-CENTURY BUILDER (MC) | VANCOUVER SPECIAL (VS) | MILLENNIUM BUILDER (MB) | WEST COAST MODERN (WC) | |
|---|---|---|---|---|---|
| Most optimistic | 4 | 1 | 1 | 1 | 2 |
| Optimistic | 0 | 1 | 4 | 1 | 2 |
| Somewhat optimistic | 1 | 4 | 2 | 2 | 2 |
| Somewhat pessimistic | 2 | 2 | 2 | 3 | 2 |
| Pessimistic | 1 | 2 | 3 | 2 | 1 |
| Most pessimistic | 2 | 1 | 2 | 2 | 1 |
| Total evaluated | 10 | 11 | 14 | 11 | 10 |
Table 6
Framework targets for the BC Energy Step Code for new residential buildings in Climate Zone 4 (< 3000 heating degree-days), which currently includes Vancouver. Step Code 5 will be minimum compliance in 2032.
| STEP CODE | ACH AT 50 PASCALS | MEUI (kWh/m2/yr) | % REF | TEDI (kWh/m2/yr) |
|---|---|---|---|---|
| 5 | ≤1.0 | 25 | n.a. | 15 |
| 4 | ≤1.5 | 40 | 40% | 20 |
| 3 | ≤2.5 | 50 | 20% | 30 |
| 2 | ≤3.0 | 60 | 10% | 35 |
| 1 | n.a. | n.a. | 0% | n.a. |
[i] Note: ACH = air changes per hour; MEUI = mechanical energy-use intensity; TEDI = thermal energy demand intensity; % REF = percent less than a reference model home.

Figure 2
The Qualtrics survey as it appeared to respondents.
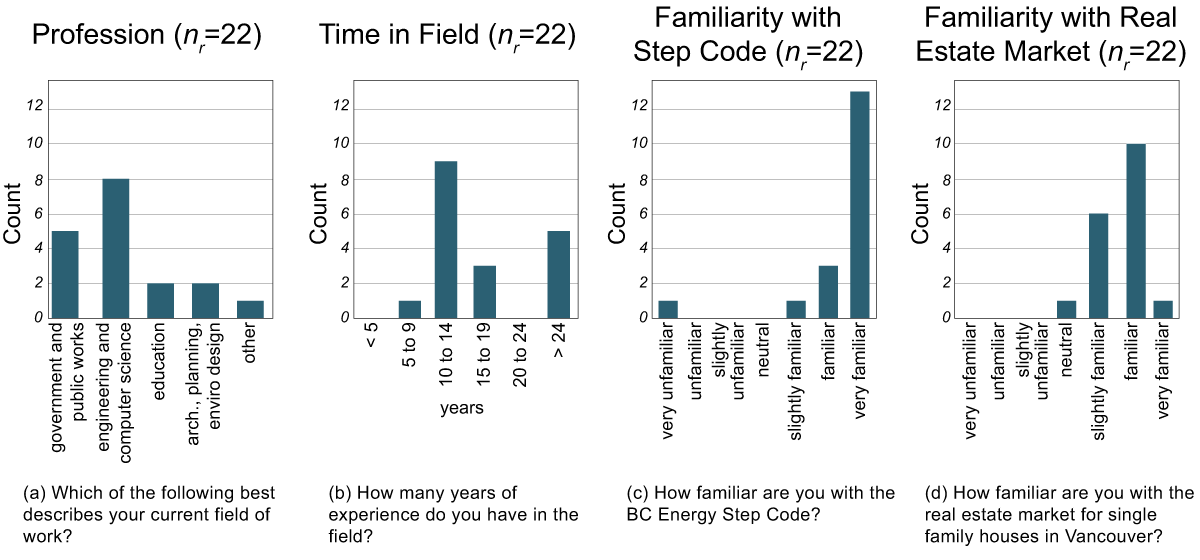
Figure 3
Self-reported descriptive information about the experts.
Note: For respondent who selected ‘very unfamiliar,’ their responses were kept due to their second-to-highest level of familiarity with the real estate market and ‘15–19’ years of experience in a ‘government’ role and reported either a ‘medium’ or a ‘high’ level of confidence in their responses.
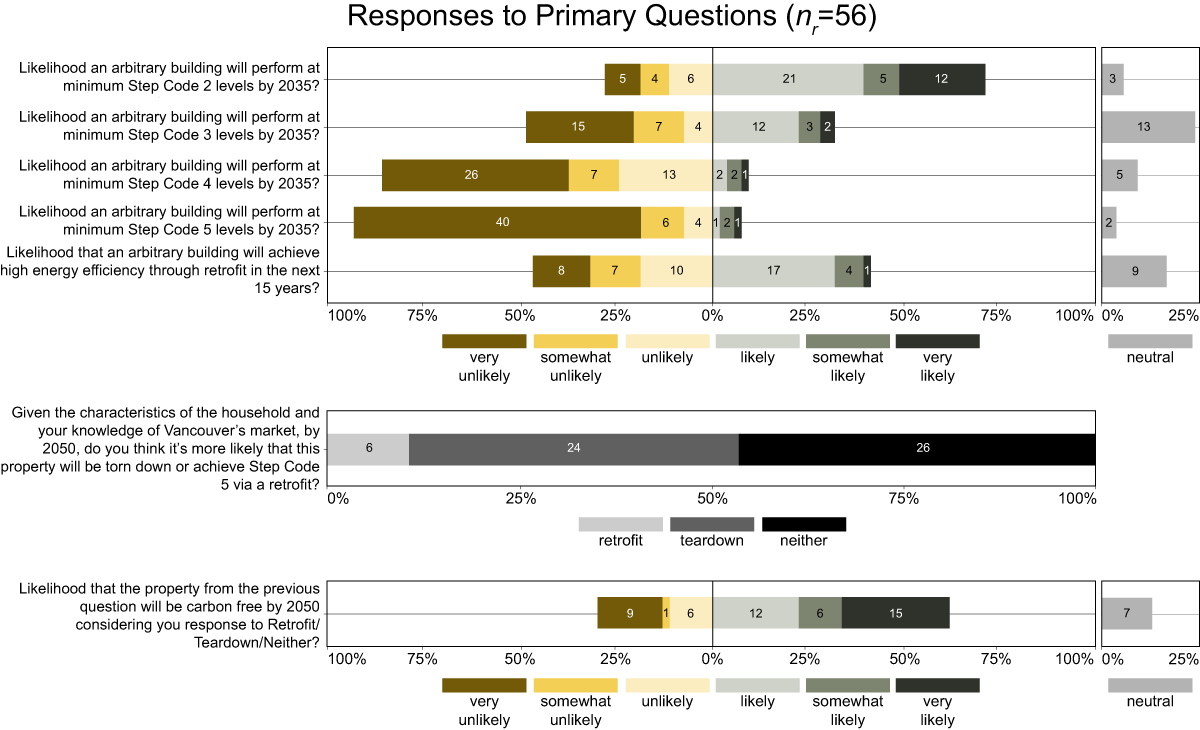
Figure 4
Aggregate responses to the survey (all representative constructions combined).
Note: Numbers within the bars represent the number of responses for that question that fell under that value. The sizes of the bars represent the percentage of responses to that question.
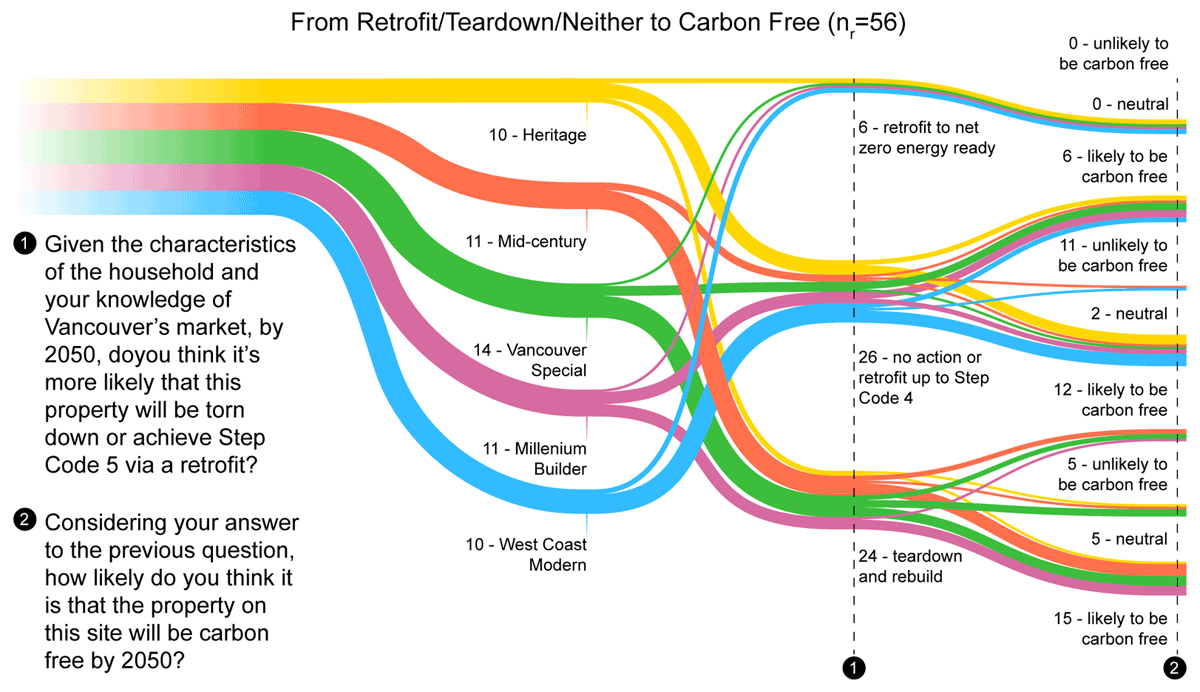
Figure 5
Flow of responses from the question concerning demolition and new build, retrofit, or neither, and the next question regarding how the expert viewed the properties’ likelihood of being carbon free by 2050 with respect to the answer to the previous question.
Note: Likert responses reflecting a higher likelihood than neutral were changed into a ‘Yes’ binary response; and Likert responses reflecting lower likelihood than neutral were changed into a ‘No’ binary response. The neutral responses were not changed.
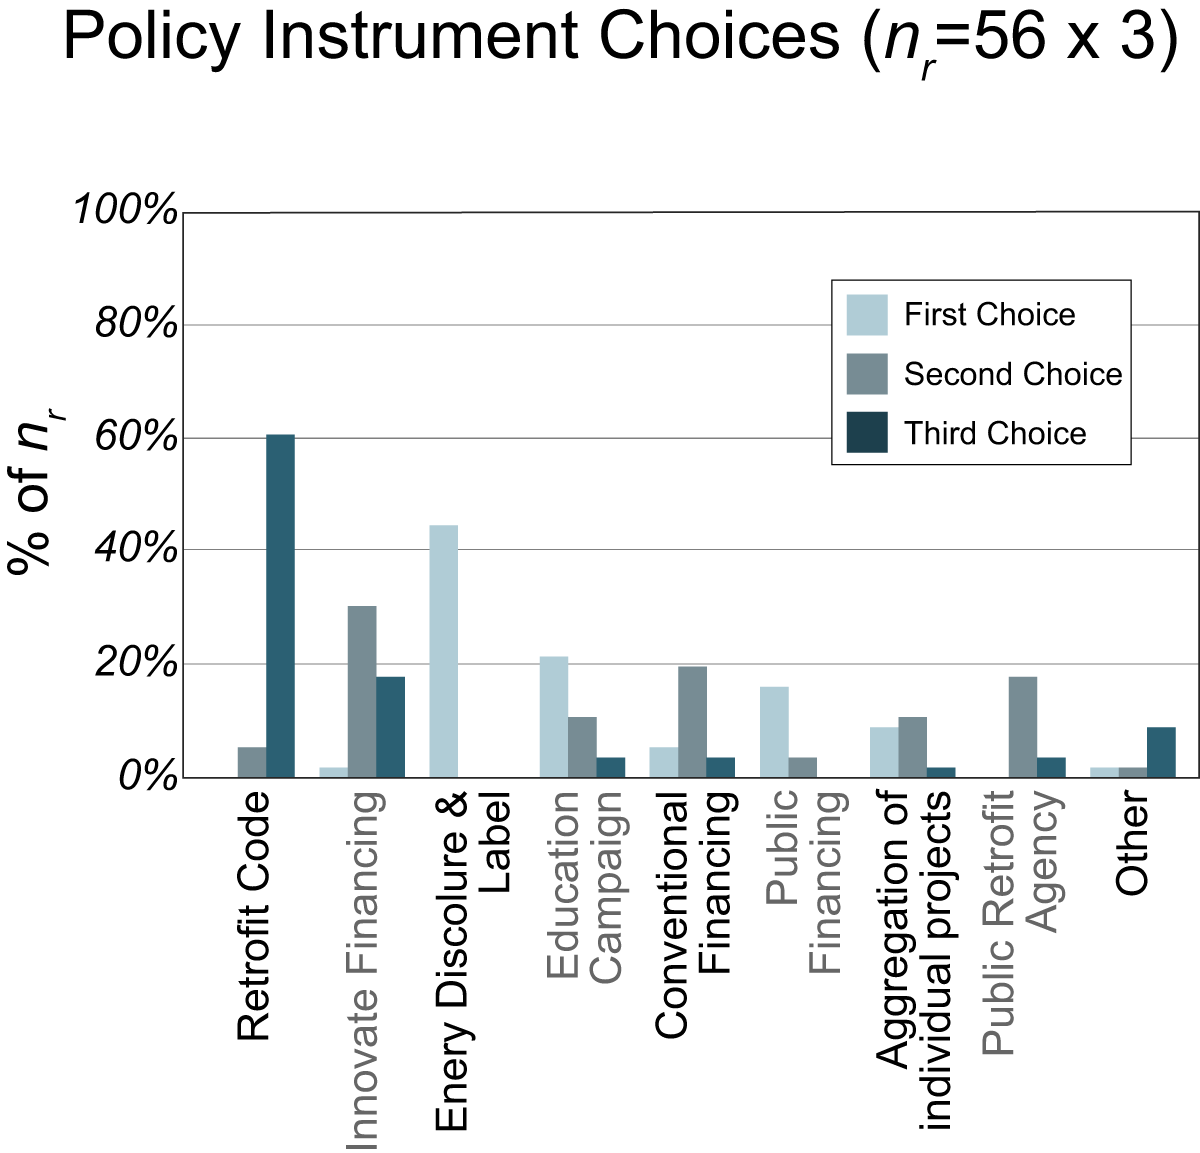
Figure 6
Respondents were asked to select three policy instruments that would influence the dwelling’s retrofit.
Note: The count is presented in order of selection.
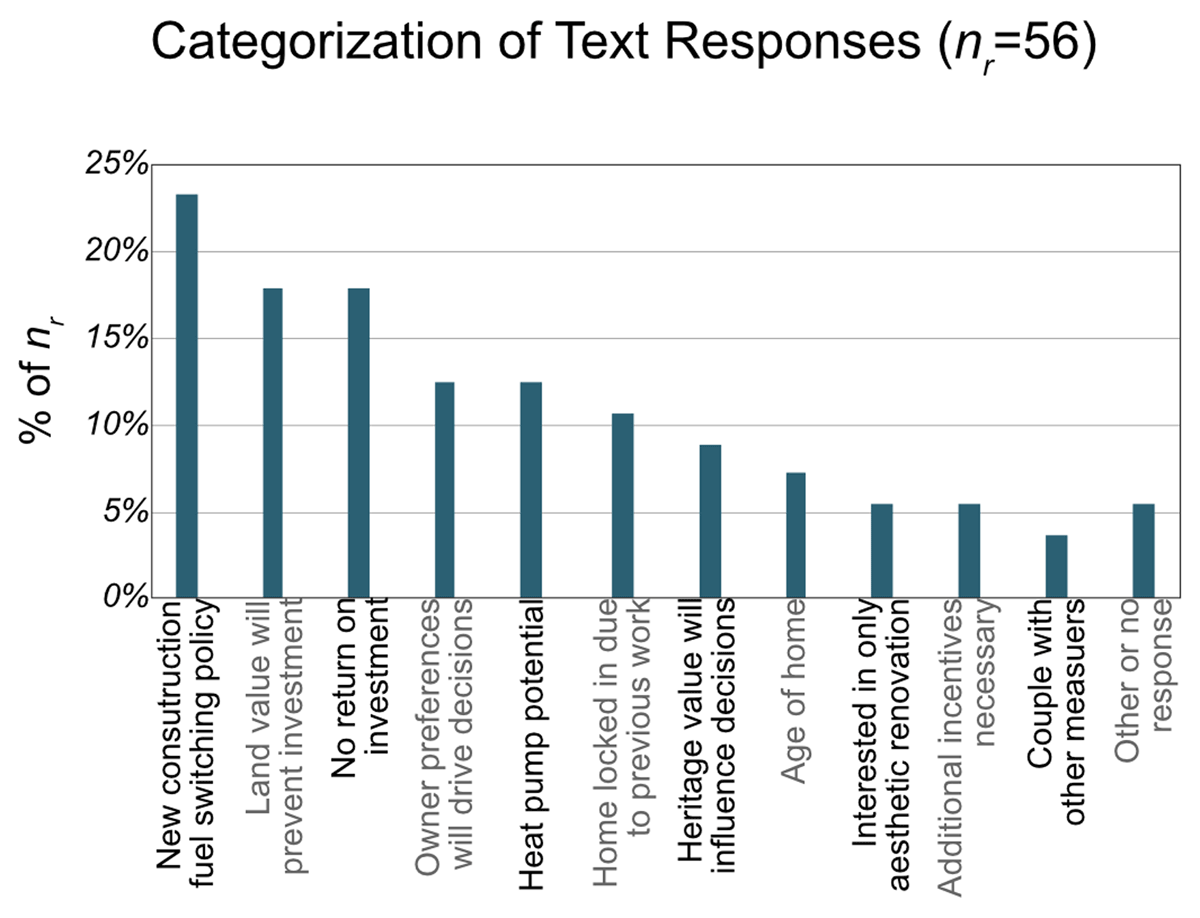
Figure 7
The topic raised by respondents indicating the most influential parameters in their decision-making process.
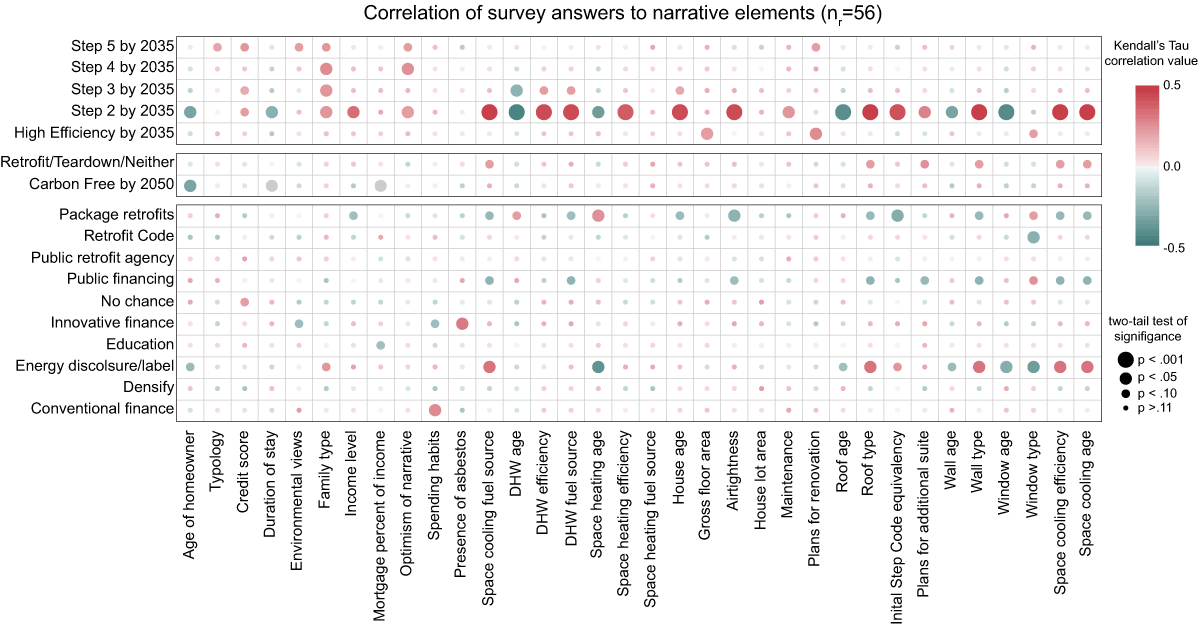
Figure 8
Correlation and statistical tests for primary questions, with policy responses broken out into each potential instrument.
Note: Correlations away from zero represent a stronger relationship between the pair of variables. For example, the values for ‘Environmental views’ were encoded [1, 2, 3] for [none, some, intense]. Values for Step Code 2 were encoded from 1 to 7 along the Likert scale, where 7 is ‘very likely.’ The positive correlations nearing 0.5 represent a positive relationship between the two variables, thus that higher values for ‘Environmental views’ leads to experts selecting a higher likelihood of the ‘Step’ being achieved through retrofit by 2035.

Figure 9
Correlation and statistical tests for efficiency improvement questions without the typology representing 2010–present (West Cost Modern—WC).