
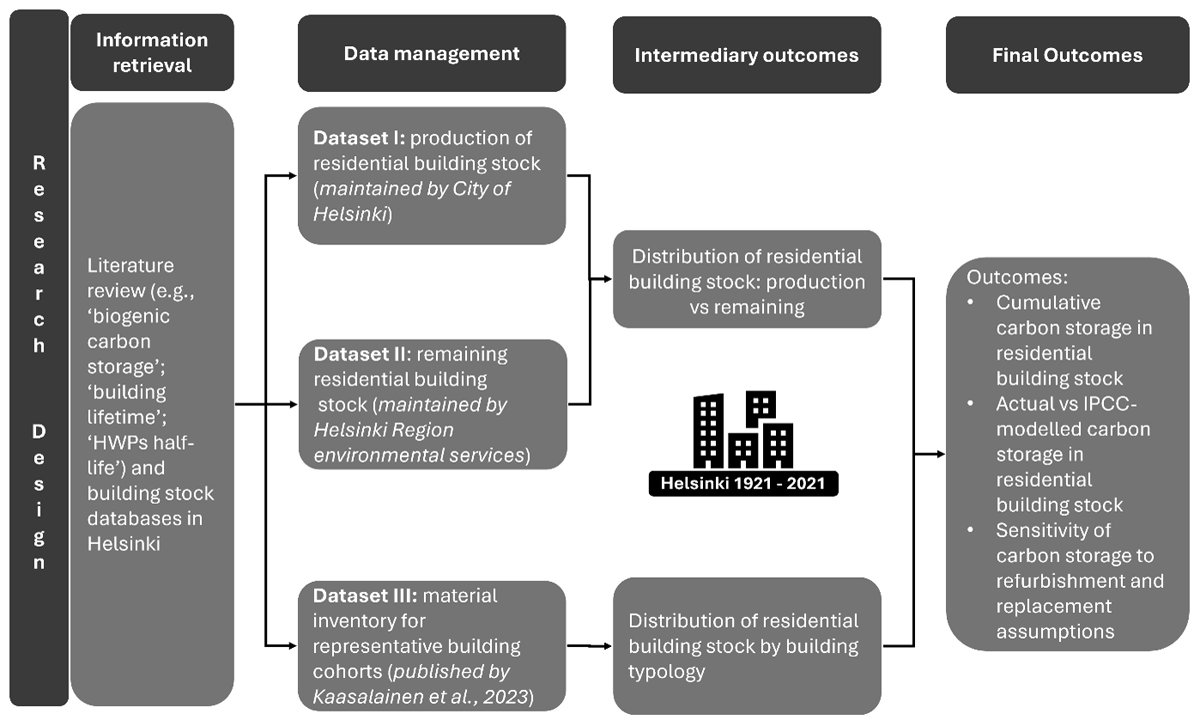
Figure 1
Research design.
Table 1
Distribution of floor area (%) according to the source of material intensity data.
| Floor area of observations (%) | 71% |
| Floor area of observations (%) extrapolated by the closest decade value | 27% |
| Floor area of observations (%) extrapolated using another building typology | 2% |
[i] Source: Floor area of observations (%) from Kaasalainen et al. (2023).
Table 2
Replacement cycles for relevant wood material categories.
| MATERIAL CATEGORY | DEFINITION IN MATERIAL INVENTORY | AVERAGE CYCLE | MINIMUM CYCLE | MAXIMUM CYCLE |
|---|---|---|---|---|
| Wood in building structure | Wood (solid), i.e. solid timber, including planks, beams and battens, and glued laminated timber (glulam) incorporated in the foundations, walls, floor structure, roofs and other building-structure elements | Building life | Building life | Building life |
| Woodchip insulation, i.e. woodchips, sawdust or a mixture of them used as loose insulation | Building life | 40 years | Building life | |
| Wood fibre insulation (solid), i.e. solid woodfibre sheets used as insulation | Building life | Building life | Building life | |
| Wood products, i.e. wood-based products such as plywood, chipboard and oriented strand board (OSB), excluding medium-density fibreboard (MDF) and glulam | Building life | 40 years | Building life | |
| Wood in complementary products (e.g. windows, doors) | Wood (solid), i.e. solid timber, including planks, beams and battens, and glulam contained in windows and doors | 50 years | 30 years | 70 years |
| Wood products, i.e. wood-based products such as plywood, chipboard and OSB, excluding MDF and glulam | 50 years | 30 years | 70 years |
[i] Note: The material inventory definition is based on Kaasalainen et al. (2023).
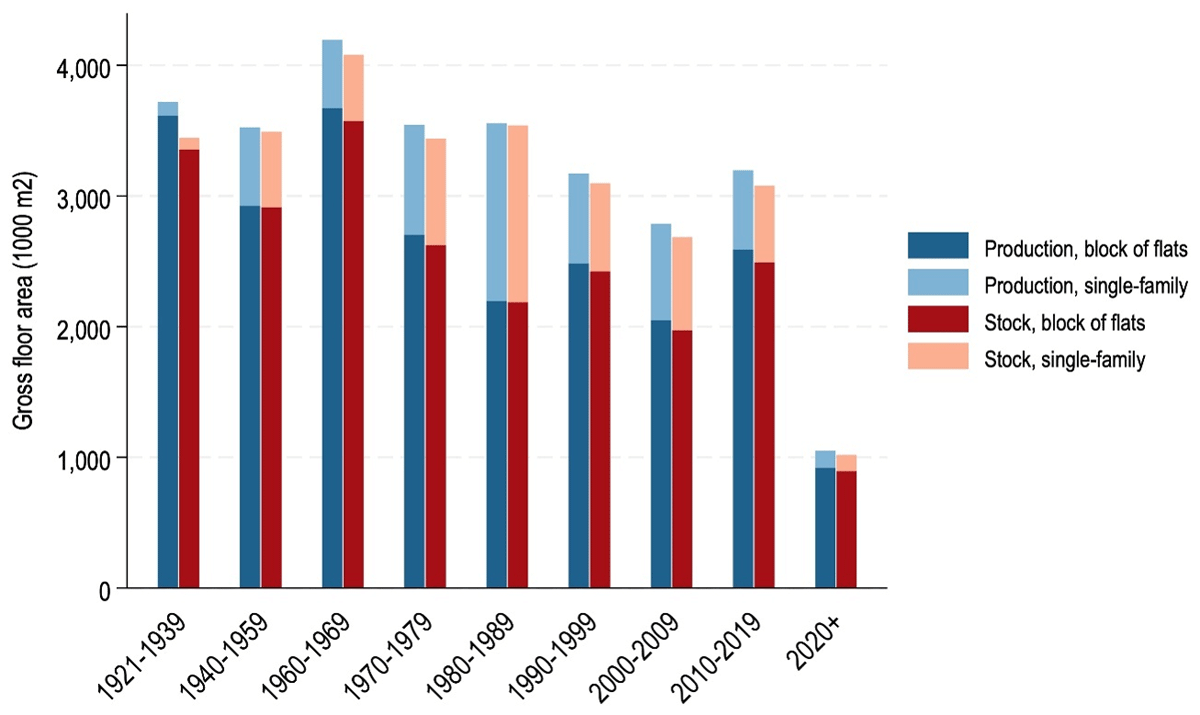
Figure 2
Comparison of residential building stock production gross floor area (GFA; m2) and remaining stock GFA (m2) in Helsinki by construction era and building typology.
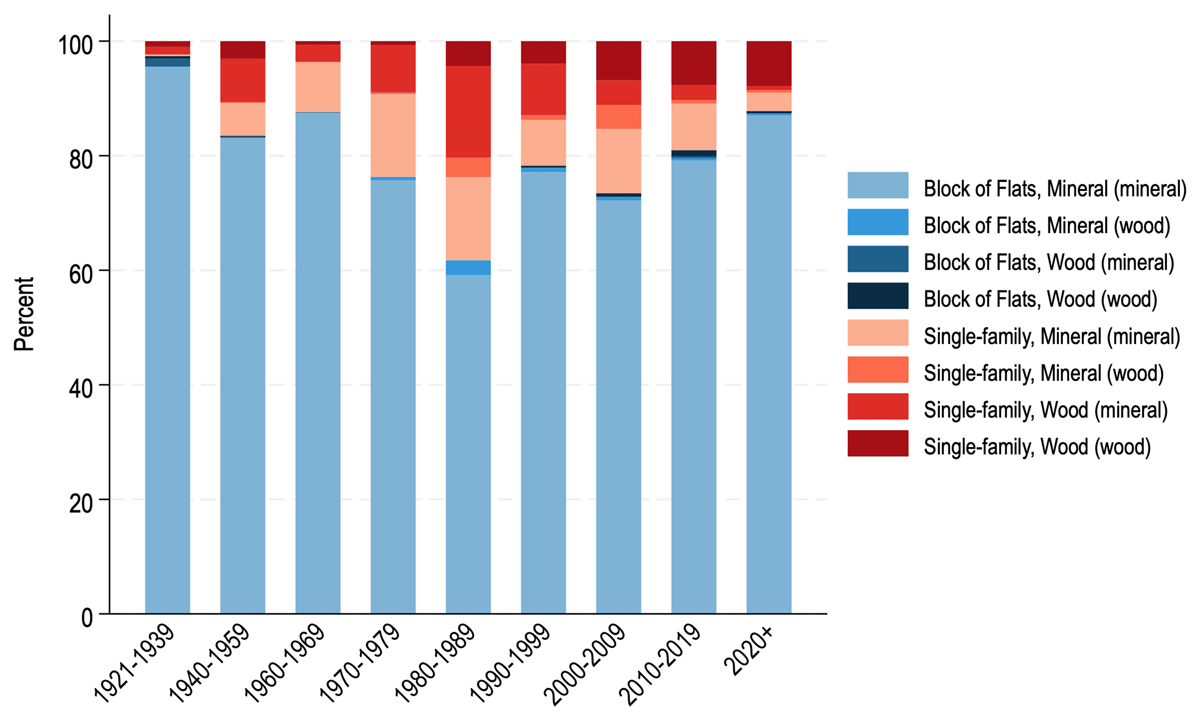
Figure 3
Normalised distribution of residential gross floor area (GFA; m2) by building typology and primary load-bearing and facade material across construction periods in Helsinki.
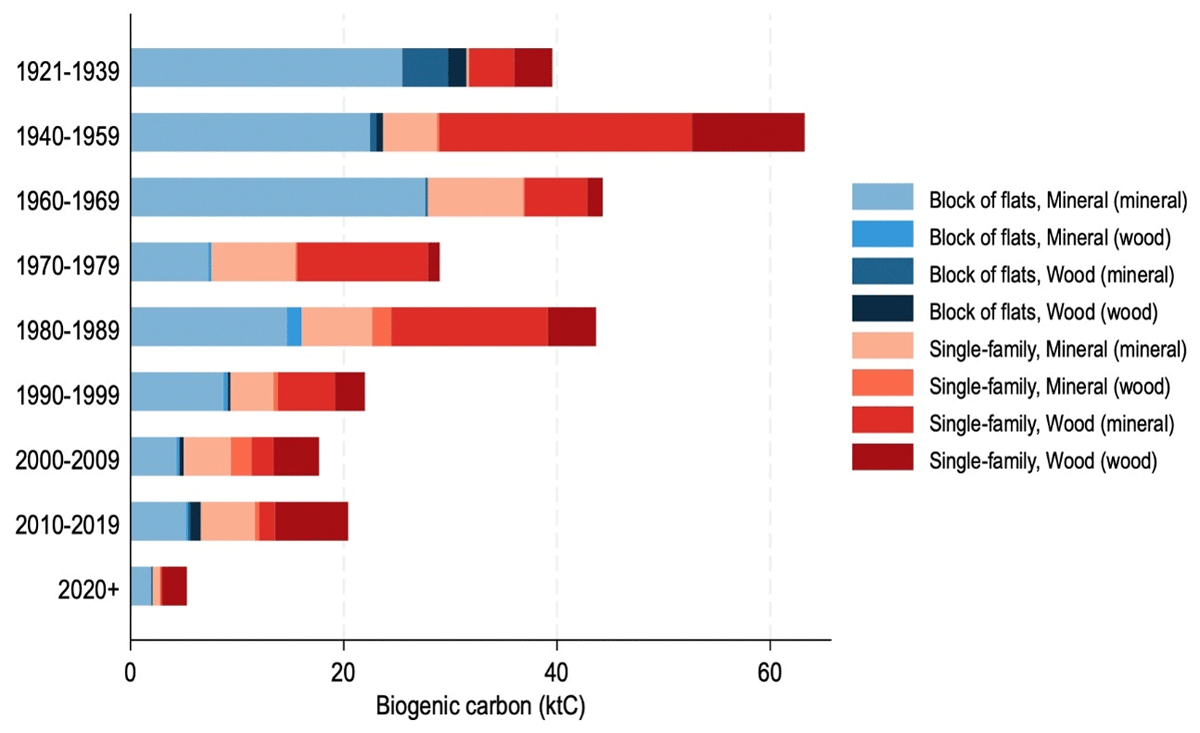
Figure 4
Distribution of the existing biogenic carbon in residential buildings in Helsinki by construction era, material category and building typology.
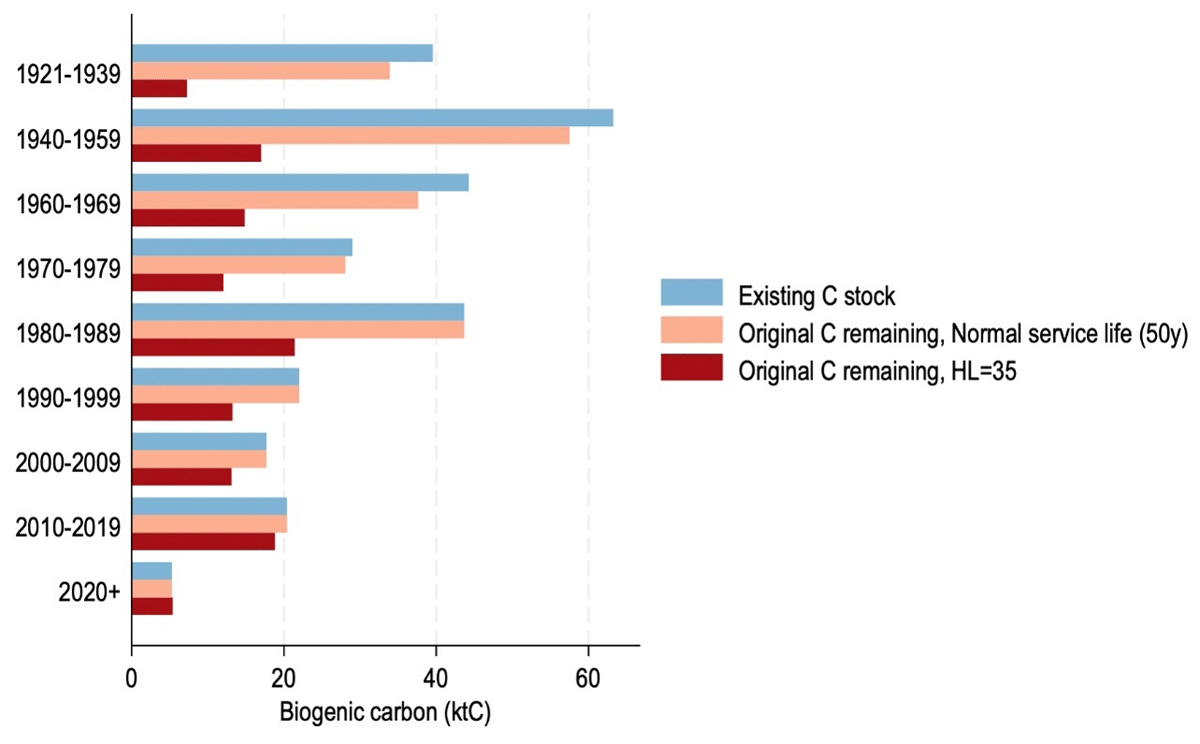
Figure 5
Estimated biogenic carbon storage in the existing residential stock in Helsinki compared with the biogenic carbon storage estimates derived using replacement cycles and the Intergovernmental Panel on Climate Change’s (IPCC) default 35-year half-life.
Table 3
Sensitivity analysis of replacement-cycle assumptions and their effect on the original biogenic carbon remaining in use.
| SCENARIO | REPLACEMENT CYCLE (YEARS) | ORIGINAL CARBON REMAINING (KT C) | SHARE OF ORIGINAL HWP REMAINING IN USE (%) | SHARE OF REPLACED HWP (%) | THEORETICAL HALF-LIFE EQUIVALENT (YEARS) |
|---|---|---|---|---|---|
| Short service life | 30–40 | 190 | 67% | 33% | 51 |
| Average service life | 50 | 266 | 93% | 7% | 503 |
| Long service life | 70 | 278 | 97% | 3% | 1,899 |
[i] Note: Theoretical half-life equivalent is derived with a first-order decay function. HWP = harvested wood products.