
1. INTRODUCTION
Following the introduction of the planetary boundary framework and the notion of boundary overshoot (Rockström et al. 2009), interest in regenerative design approaches for the built environment has increased. This interest has been reinforced by evidence showing that the global construction carbon footprint has increased considerably in recent decades and is projected to continue growing under business-as-usual trajectories. Emissions from the construction sector alone are projected to exceed the annual carbon budgets compatible with the 1.5° and 2°C climate targets within the next two decades (Li et al. 2025). At the urban scale, the environmental objectives intersect with broader questions of economic development and social equity, which have long shaped debates around sustainable urban development (Campbell 1996). Within this context, greater use of bio-based materials as alternatives to conventional construction materials has been proposed as a means of reducing life-cycle emissions and non-renewable resource use.
The way building stocks develop over time is also influenced by wider urban processes. Cities experience different trajectories of growth, stability and decline (Haase et al. 2021; Newsham & Rowe 2023), affecting housing demand and the continued use of existing buildings. Housing markets can further influence these processes as housing increasingly functions as a financial asset alongside its residential role, linking decisions about investment, redevelopment and retention to broader processes of housing financialisation (Aalbers 2017). These dynamics are particularly relevant when considering strategies that depend on buildings and materials remaining in use over extended periods.
One key approach for redirecting the trajectory of construction is the development of timber-based cities and the idea of temporary carbon storage in the built environment (Churkina et al. 2020). To assess the feasibility of this approach at scale, researchers have estimated the new forest plantations required to house future urban population growth (Mishra et al. 2022; Pomponi et al. 2020). Their results indicate cumulative land-use emission savings of 5% up to 50% by 2100, compared with the baseline scenario, driven by higher regrowth and carbon storage in the built environment (Mishra et al. 2022). Lan et al. (2025) argue that an anticipated higher demand for wood products could lead to net increases in forest and product carbon stocks through expanded and more intensively managed forests. Alternatively, some studies suggest that additional demand for engineered wood products could be met by redirecting existing wood flows from short-lived or lower value uses toward longer lived construction applications, thereby increasing carbon storage without necessarily expanding overall harvest levels (Gustavsson et al. 2017).
However, researchers in the land-use sector field have raised concerns that expanding the harvest for wood products and bioeconomy strategies can reduce forest carbon stocks and weaken carbon sinks as well as increase land-use competition (Seppälä et al. 2019). Searchinger et al. (2023) argue that increasing wood demand for construction can lead to higher net emissions over relevant climate time horizons due to the opportunity costs associated with forest harvests. These opportunity costs reflect the foregone carbon sequestration that would occur if forests were left unharvested or allowed to continue growing. As a result, the immediate loss of forest carbon following harvest is not fully compensated by carbon storage in wood products or by material substitution benefits, leading to elevated atmospheric carbon levels for several decades (Searchinger et al. 2023).
1.1 BACKGROUND
Material substitution benefits have been the primary focus of the material compensation literature in the built environment. Material substitution or displacement factors describe the extent to which the use of wood products can avoid emissions by replacing more emission-intensive materials or energy carriers. Based on a review of 21 studies, Sathre & O’Connor (2010) report substitution factors mostly ranging from 1 to 3 t C/t C, where a positive value indicates emission reductions from wood use. For construction products, Leskinen et al. (2018) report ranges of 0.9–5.5 t C/t C for structural applications and of 0.2–4.7 t C/ t C for non-structural applications, while Hurmekoski et al. (2021) report a market level range of 0.27–1.16 t C/t C for baseline scenarios covering all wood flows. However, it should be noted that substitution effects are sensitive to system boundaries, reference materials and local conditions, limiting their transferability across contexts (Geng et al. 2017).
Several studies have questioned the overreliance of climate mitigation research and policy on material substitution factors and their magnitude. Peng et al. (2023) show that while substituting wood for emission-intensive construction materials can reduce production-stage emissions, these benefits do not offset the carbon costs of forest harvest when compared with a no-harvest alternative. Leturcq (2020) similarly argues that both energy and material substitution effects of wood are often overestimated, particularly when constant substitution factors are applied without accounting for time delays or system boundaries. Even in forest-rich counties with primarily sustainable forestry practices, such as Finland, concerns have been raised. Hurmekoski et al. (2020) estimate that the average production-stage substitution factor for all industrial wood use in Finland is around 0.3 t C/t C, significantly lower than the global average of 1.2 t C/t C often cited by industry.
While research on material substitution factors is relatively well developed and has focused on identifying the conditions under which wood materials may reduce emissions compared with conventional materials, substitution alone does not determine the climate benefits of buildings. Fundamentally, the net carbon balance of wood construction is influenced by the emission reductions achieved through material substitution and the biogenic carbon storage in harvested wood products (HWPs) over time, together with the associated carbon flows in forests (Gustavsson et al. 2017). This applies not only to timber buildings but also to all buildings that incorporate wood materials. Building-level assessments similarly show that climate outcomes depend strongly on how biogenic carbon storage, forest regrowth and material replacement evolve over time (Schwarzschachner & Hernandez 2024; Sironen et al. 2025).
The contribution of wood products to long-term carbon storage depends directly on how long these products remain in use. In national greenhouse gas (GHG) inventories, this duration is represented through half-life assumptions. Under the Intergovernmental Panel on Climate Change’s (IPCC) 2019 Refinement Tier 1 method, wood products are grouped into three default commodities: solid wood, panel products and paper products, and a half-life is assigned to each, i.e. 35, 25 and two years, respectively (Rüter et al. 2019). Typically, the 35-year half-life for solid wood is commonly applied to wood products used in buildings (Spear & Hart 2025). However, the IPCC framework recognises that half-lives are sensitive to national conditions and building characteristics and allows for country-specific estimates under Tier 2 approaches. For example, Hurmekoski et al. (2020) test a substantially shorter half-life alongside the standard 35 years in a sensitivity scenario of a Finnish building stock, whereas Matsumoto et al. (2022) suggest a half-life of 66–101 years for Japanese buildings when estimating carbon stock changes.
The longevity of structural timber products in the building stock is closely related to the continued use of the building in which they are installed. Evidence on building-stock survival can therefore provide an empirical indication of how long such products may remain in use. Previous studies also show that residential building longevity varies substantially across uses and national contexts. Residential buildings often remain in use longer than non-residential buildings (Berglund-Brown et al. 2025). Estimated residential building lifespans range from approximately 45.6 years in urban China (Cai et al. 2025) and 61 years in the United States (Aktas & Bilec 2012) to 126 years in Norway (Bohne et al. 2006; Sartori et al. 2008). Such variation suggests that uniform assumptions about the time buildings and their constituent wood products remain in use may introduce uncertainty into estimates of carbon stored in the built environment.
Assumptions about the duration of building use are also important in life-cycle assessment (LCA). The whole-life global warming potential (GWP) requirements emerged under the recast Energy Performance of Buildings Directive (EPBD) in the European Union (EU) and the whole-life carbon assessment was formalised through The Royal Institution of Chartered Surveyors’ (RICS) Professional Standard in the UK (European Union 2024a; RICS 2023). Whole-life carbon assessments therefore require a defined reference study period over which environmental impacts, replacements and operational effects are evaluated. The assumed period is consequential because it determines the number of repair and replacement cycles, the cumulative energy use, and the total environmental impact of the modelled building (Grant et al. 2014; Ji et al. 2021).
Generally, a 30–50-year lifespan has been adopted for residential buildings in both academic and industry LCAs (Davis et al. 2025). The assumption is often used for convenience and comparability across studies (Dos & Dimova 2018). The EU standard (EN 15978) typically assumes a building lifespan of 50 years (CEN 2011). The assumption is linked to construction standards such as Eurocode EN 1990, which specifies a 50-year design working life for residential structures as a whole rather than differentiating between components (CEN 2002). These periods are primarily modelling and design assumptions rather than empirical observations of how long buildings remain in use. Empirical evidence on building-stock survival can therefore provide useful context for evaluating the suitability of such assumptions.
1.2 RESEARCH GAP AND RESEARCH QUESTIONS
The aim of the research is to examine the survival of residential buildings in the capital region of Finland and, based on observed stock survival, derive half-life and cumulative biogenic carbon storage created by construction activities over the past century. The study also compares these estimates to carbon storage calculated using the IPCC’s default 35-year half-life of long-lasting HWPs.
The following research questions were developed:
What proportion of Helsinki’s residential building stock constructed over time remains in use today?
What is the cumulative biogenic carbon storage in Helsinki’s existing residential building stock from 1921 to 2021? How does it compare with estimates based on the IPCC’s default 35-year half-life for national GHG inventories?
In light of evolving national regulations and EU climate policy, reducing the carbon emissions of buildings and increasing long-term biogenic carbon storage in products have become priorities in efforts to meet climate goals (European Union 2024a, 2024b). Meanwhile, residential buildings account for a large share of total building floor area in many countries, comprising around 75% of occupied space in Europe (Economidou et al. 2011), indicating the central role of the residential sector in overall construction emissions and energy use. Helsinki provides a suitable case because the bioeconomy forms an important part of the economic and climate strategy, while its long-term urban development and availability of building-stock data enable changes in the residential stock to be examined over an extended period. The results can inform the balanced use of forest resources and support the role of long-lived wood materials in storing carbon.
2. METHODS
2.1 RESEARCH DESIGN
The research design follows a structured sequence of information retrieval, data management and analysis, leading to the estimation and comparison of biogenic carbon storage in Helsinki’s residential building stock (Figure 1). These results are combined with material composition data to estimate cumulative biogenic carbon storage. The resulting storage is compared with estimates based on the IPCC’s default half-life approach and with alternative refurbishment and replacement scenarios. The main datasets, processing steps and analytical procedures shown in Figure 1 are described in detail in the following subsections.
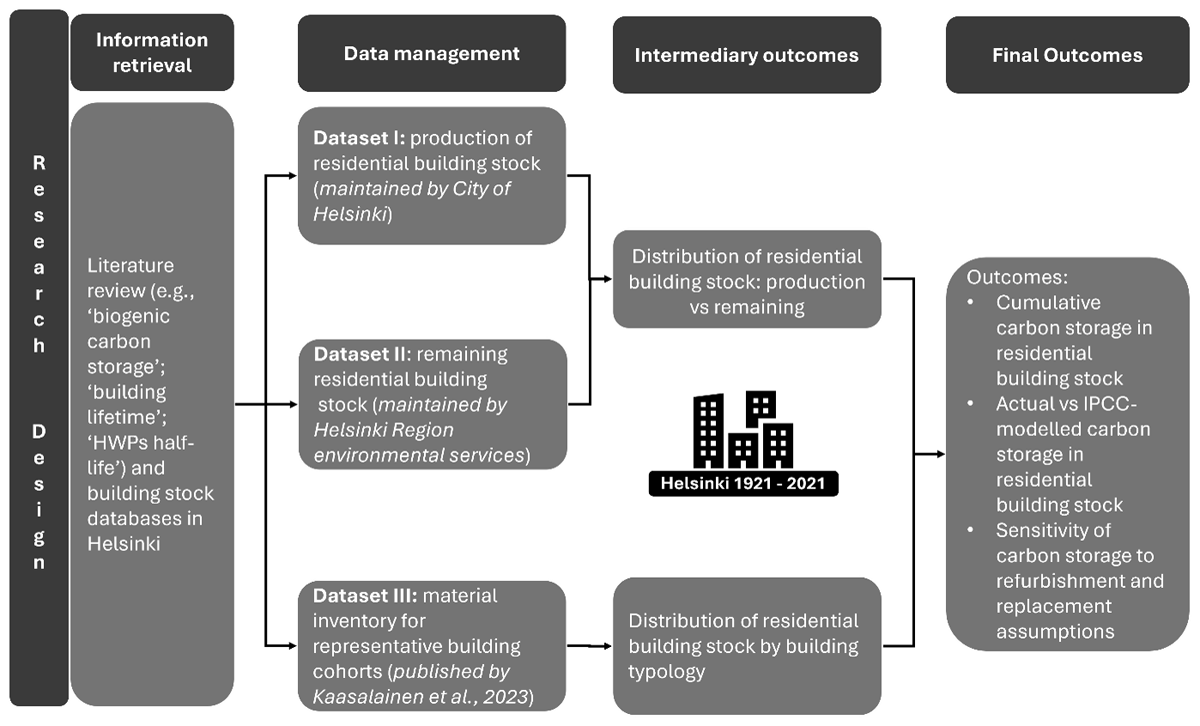
Figure 1
Research design.
2.2 DATA DESCRIPTION AND MANAGEMENT
Three separate datasets are used to compile the results of this study: (1) data on the production of residential building stock obtained from the City of Helsinki; (2) data on the remaining building stock provided by the City of Helsinki; and (3) a material inventory dataset representing building cohorts, based on Kaasalainen et al. (2023). The datasets are harmonised (i.e. variables, classifications and temporal/spatial coverage aligned to make the datasets comparable) and used to examine the distribution of produced and remaining stock by construction period and building typology.
2.2.1 Study area
The City of Helsinki is selected as the study area because it presents a compelling setting for the analysis. The city has undergone substantial urbanisation after the Second World War and it has utilised various planning and subsequent development patterns over the decades (e.g. Leppänen et al. 2024). Since the rapid urbanisation period of the mid-20th century, Helsinki’s built environment has undergone substantial morphological change: redevelopment debates in the 1970s included prominent cases where the existing building stock was considered for demolition (City of Helsinki 2020); the 1990s saw major new housing areas being built (e.g. in the eastern suburbs) (Staffans & Pulkkinen 2024), and since the 2000s urban policy has increasingly emphasised infill development and regeneration to accommodate growth within the existing urban structure (City of Helsinki 2016). At the same time, Finnish scholars and public institutions have warned of an accelerating demolition trend, raising concerns about the loss of the existing building stock in favour of new development (Nousiainen 2024).
2.2.2 Building stock data, 2021
First, the building stock data consist of a comprehensive micro-level register of the residential building stock in the City of Helsinki; it is maintained by the Helsinki region environmental services. The stock is observed as of the end of 2021, meaning all buildings standing at that time are included. The dataset includes building-level information on the number of dwellings, gross (GFA) and net floor area (NFA), building type, primary load-bearing and facade materials, as well as construction year. The construction year variable reflects the building’s original year of commissioning and does not account for subsequent major refurbishments or extensions. Consequently, floor area and dwelling counts may be attributed to the original construction year even if they were added later, potentially leading to overrepresentation in certain years. This is impossible to detect from the data and is therefore a limitation of the data.
Data management steps include basic cleaning of missing or obsolete values, imputing certain missing values and spatial classification. All observations that do not fall under Statistics Finland’s residential building category (classification system 1994) are omitted. Furthermore, as the study focuses on biogenic carbon storage, the material categories (concrete, wood, masonry, other) are classified into mineral-based (i.e. brick, stone and concrete) and wood groups for both the load-bearing structure and facade materials. For brevity, the term ‘mineral’ is used hereafter to refer to the mineral-based group. A net-to-gross floor area ratio (NFA/GFA) was then calculated for each observation to identify potentially erroneous m2 NFA values. This step is particularly relevant for buildings constructed prior to 1981, as administrative documentation indicates that these data were collected through surveys and may contain gaps or inaccuracies. Observations with implausible ratios (≤ 0.6 or ≥ 0.95) were treated as erroneous and set to missing. Missing m2 NFA values were subsequently imputed using the mean NFA/GFA ratio by building type and construction year.
To ensure consistency with historical residential construction data, the building stock dataset was restricted to buildings located within Helsinki’s administrative boundaries at the time of construction. During the study period, Helsinki expanded through annexations in 1946 (the Great Annexation), 1966 (Vuosaari) and 2009 (Östersundom) (City of Helsinki 2026). Buildings constructed in these areas prior to their annexation were therefore excluded because they were not part of Helsinki’s official construction statistics at the time. This approach maintains temporal consistency in municipal jurisdiction and prevents the retrospective inclusion of housing built outside the city’s boundaries.
2.2.3 Historical construction data, 1921–2021
The historical residential construction dataset covers residential construction within the administrative boundaries of Helsinki between 1921 and 2021 and is maintained by the City of Helsinki. The data include annual dwelling production, m² NFA and m² GFA. Dwelling production is available for the entire study period, while m² NFA and m² GFA are available for the periods 1955–2021 and 1968–2021, respectively.
As the analysis relies on m² GFA as the harmonised metric across datasets, missing GFA values were imputed using conversion factors derived from the existing building stock data. These factors include the NFA/GFA ratio and mean dwelling size, both calculated by building type and construction year. The NFA/GFA ratio was used to estimate m² GFA for years with available m² NFA data (1955–67). The observed ratios (0.76–0.80) are consistent with prior research (e.g. Machado et al. 2025; Passer et al. 2012). For earlier years (1921–54), m² GFA was estimated using mean dwelling size by building type and construction year from the building stock data.
2.2.4 Material intensity data by building cohort
Building material stock estimates were derived from Kaasalainen et al. (2023), who developed detailed material intensity inventories for representative residential buildings in the same geographical context. Their data cover blocks of flats and single-family dwelling buildings across construction decades from 1950 to 2010, and distinguish buildings by primary load-bearing and facade materials. As the material intensities are provided by building type, construction decade and material category, they are directly compatible with the building stock data used in this study and allow for the estimation of embedded biogenic carbon storage in Helsinki’s residential building stock.
For construction periods not directly covered by Kaasalainen et al. (2023), material intensities were extrapolated using the closest available decade for each building typology. This approach is supported by evidence that structural systems and primary material use in Finnish residential buildings have remained relatively similar within adjacent construction periods, particularly in the pre-war decades (Heikkilä 2005; Nasiri et al. 2023). In a limited number of cases, material intensities were assumed from closely related building typologies. For example, blocks of flats constructed in timber before the 1950s were assumed to have similar material intensity to detached timber dwellings from the same period, as residential timber buildings at the time were typically low-rise and shared structural systems (Nasiri et al. 2023).
Table 1 summarises the distribution of GFA according to the source of material intensity data.
Table 1
Distribution of floor area (%) according to the source of material intensity data.
| Floor area of observations (%) | 71% |
| Floor area of observations (%) extrapolated by the closest decade value | 27% |
| Floor area of observations (%) extrapolated using another building typology | 2% |
[i] Source: Floor area of observations (%) from Kaasalainen et al. (2023).
2.2.5 Replacement cycles of wood materials
Although a building may remain in use for an extended period, some wood components are replaced before the building reaches the end of its service life. Accounting for component residence times is therefore important when estimating biogenic carbon storage in long-lived building stocks (Spear & Hart 2025). To account for this turnover, the analysis was developed using replacement cycles, defined here as the period after which the wood assigned to a given material-use category is assumed to leave the existing building stock and be replaced by an equivalent wood product. This treatment is consistent with building LCA practice, where maintenance and replacement activities are modelled based on the service lives assigned to individual building components (Francart et al. 2021). For each replacement event in the present study, all wood within the respective use category was assumed to be replaced simultaneously.
The wood-material categories follow the material-intensity inventory of Kaasalainen et al. (2023). The original inventory included load-bearing and complementary building components, but not internal surfaces, fitted furniture and such secondary wooden elements. Replacement cycles were derived from the Finnish design standard for average technical service lives and maintenance intervals for building structures and components (Rakennustieto 2025). The resulting material categories and typical replacement cycles are presented in Table 2.
Table 2
Replacement cycles for relevant wood material categories.
| MATERIAL CATEGORY | DEFINITION IN MATERIAL INVENTORY | AVERAGE CYCLE | MINIMUM CYCLE | MAXIMUM CYCLE |
|---|---|---|---|---|
| Wood in building structure | Wood (solid), i.e. solid timber, including planks, beams and battens, and glued laminated timber (glulam) incorporated in the foundations, walls, floor structure, roofs and other building-structure elements | Building life | Building life | Building life |
| Woodchip insulation, i.e. woodchips, sawdust or a mixture of them used as loose insulation | Building life | 40 years | Building life | |
| Wood fibre insulation (solid), i.e. solid woodfibre sheets used as insulation | Building life | Building life | Building life | |
| Wood products, i.e. wood-based products such as plywood, chipboard and oriented strand board (OSB), excluding medium-density fibreboard (MDF) and glulam | Building life | 40 years | Building life | |
| Wood in complementary products (e.g. windows, doors) | Wood (solid), i.e. solid timber, including planks, beams and battens, and glulam contained in windows and doors | 50 years | 30 years | 70 years |
| Wood products, i.e. wood-based products such as plywood, chipboard and OSB, excluding MDF and glulam | 50 years | 30 years | 70 years |
[i] Note: The material inventory definition is based on Kaasalainen et al. (2023).
The main analysis applies the average replacement cycles shown in Table 2. The sensitivity analysis (see Section 3.3) subsequently evaluates biogenic carbon storage using the minimum and maximum cycle assumptions to assess the influence of replacement timing on the results.
2.2.6 Residential building stock comparison by construction era
Construction activity was grouped into construction eras to ensure consistency between historical production and remaining stock data. The pre-1960 period was aggregated into two eras (1921–39 and 1940–59) due to similarities in construction systems and because production GFA prior to 1955 was derived from dwelling counts and average GFA per dwelling based on stock data and is therefore subject to greater uncertainty. From 1960 onwards, construction was analysed by decade, reflecting improved data availability and evolving construction practices.
Figure 2 shows cumulative production GFA (m2) compared with remaining stock GFA (m2) by construction era and building typology. The results indicate that approximately 97% of the residential floor area constructed during the analysed period remains in the current stock. The lowest survival rate is observed in the first era, at 92.5% for 1921–39. This is to be expected considering their pre-war construction period and higher likelihood of demolition or redevelopment due to their age. The subsequent eras maintain a survival rate between 97% and 99% until the 2000s and 2010s, which show a slight decline to 96% (for more details, see the supplemental data online).
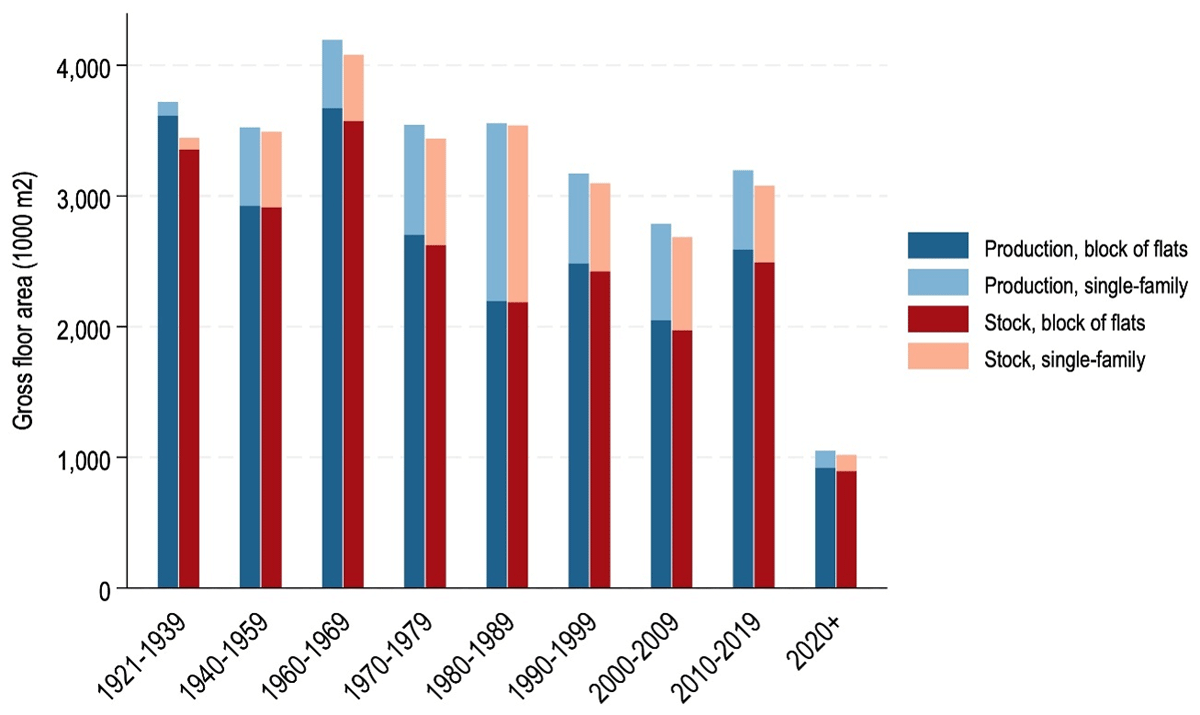
Figure 2
Comparison of residential building stock production gross floor area (GFA; m2) and remaining stock GFA (m2) in Helsinki by construction era and building typology.
The slightly lower survival rate in the most recent eras likely reflects characteristics of the statistical data rather than increased demolition. As noted in Section 2.2.2, the building stock data do not account separately for building extensions or typological conversions to/from residential buildings. Thus, the differences between the production and remaining stock observed in Figure 2 do not represent demolition alone and may overstate apparent stock loss, thereby underestimating the survival of foundations and load-bearing structures. The potential impact of this is further discussed in the Discussion section. Nevertheless, the comparison provides an indicative measure of the high survival rates of residential buildings in Helsinki.
2.2.7 Distribution of residential building stock by building typology
Understanding the distribution of the residential building stock by typology is important for interpreting material use and associated carbon storage across construction periods. Figure 3 presents the normalised distribution of residential GFA by building typology in each construction era. As noted in Section 2.2.4, residential buildings were classified into two typologies: blocks of flats and single-family dwellings. Figure 3 shows each typology further divided according to primary load-bearing material (first term) and facade material (second term).
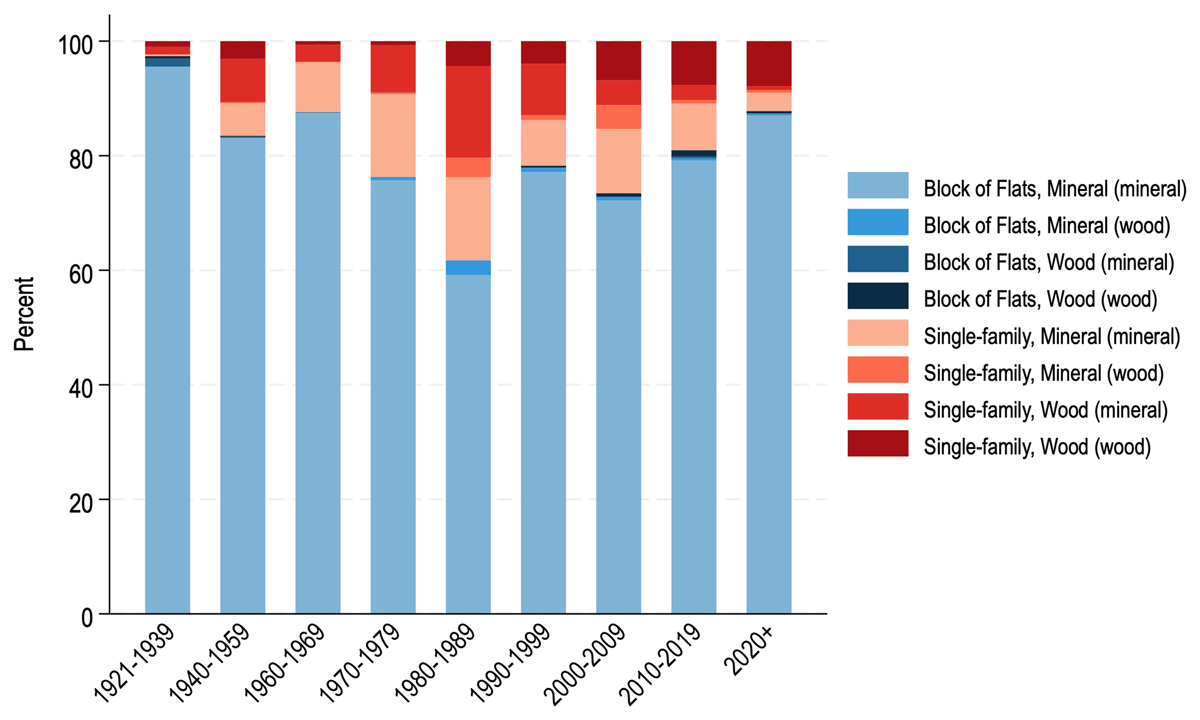
Figure 3
Normalised distribution of residential gross floor area (GFA; m2) by building typology and primary load-bearing and facade material across construction periods in Helsinki.
Brick, stone and concrete buildings (i.e. those with load-bearing structure and facade) dominate the residential buildings stock, accounting for 88% of the total GFA across all eras. Wood buildings (i.e. timber load-bearing structure and wood facade) represent 4% of the total GFA. Hybrid wood buildings (i.e. wood load-bearing structure and mineral facade) account for 7% of the total GFA, while hybrid mineral buildings (i.e. mineral load-bearing structure and wood facade) represent the remaining 2%. This indicates that mineral buildings form the clear majority of the stock, whereas buildings with timber load-bearing structures are concentrated in a smaller but still relevant share of the GFA.
Blocks of flats account for the majority of total GFA across all eras, reaching 80%. Blocks of flats are especially dominant in the 1921–39 era, where they represent 97% of total GFA. Interesting to note, within the limited share of timber-based blocks of flats (i.e. 0.3% of total GFA), a notable proportion originates from the earliest construction era, with 19% of the timber-based block of flats GFA located in the 1920s era, equivalent to 2% of total construction in that era. The share rises again after the 1990s, reaching its highest level in the 2010s, which account for 38% of the total timber-based blocks of flats GFA, or 2% of total construction in that era.
Single-family dwellings remain a smaller share of the total stock, covering the remaining 19.5% of the total GFA across all eras. The 1980–89 era shows a marked increase in their development, reaching 38% of total GFA for that era. Timber and hybrid wood buildings are more common in the single-family typology, while mineral buildings remain dominant in blocks of flats.
3 RESULTS
Based on the remaining residential building stock and material distribution by construction period, this section examines the cumulative biogenic carbon storage of residential buildings in the study area of Helsinki and compares it with the biogenic carbon storage projections calculated using the default half-life defined in the IPCC’s guidelines for national GHG inventories.
3.1 DISTRIBUTION OF BIOGENIC CARBON STORAGE IN THE EXISTING RESIDENTIAL BUILDING STOCK
Figure 4 shows the distribution of existing carbon storage in residential buildings in Helsinki by construction era, material category and building type. The total carbon stored in the existing residential building stock amounts to approximately 285 kt C. The largest biogenic carbon storage is observed in the 1940–59 era, at 63 kt C, driven by high construction volumes and substantial wood use during that era. On the other hand, the smallest carbon storage is observed in the 2020+ era, simply because of a smaller total floor area as it only includes 2020 and 2021 and does not represent a full era comparable with the other cohorts.
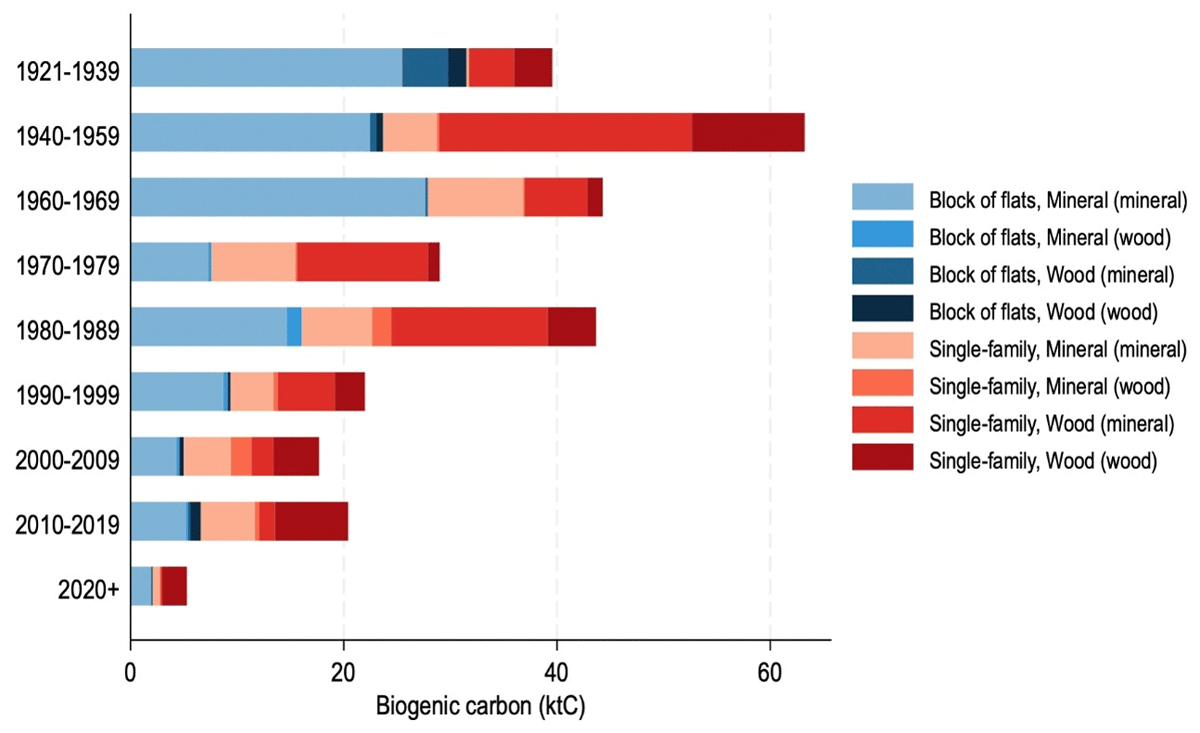
Figure 4
Distribution of the existing biogenic carbon in residential buildings in Helsinki by construction era, material category and building typology.
Overall, Figure 4 shows a decreasing trend in biogenic carbon storage across construction eras. While this trend broadly follows the amount of floor area of each era, it is also shaped by differences in timber construction systems. This is well documented in the material-intensity data which outline that older building cohorts typically have higher wood-use intensities per unit of floor area regardless of building typology (Kaasalainen et al. 2023). This shift toward more resource-efficient construction helps explain why more recent eras show lower levels of total biogenic carbon storage despite in some cases having comparable or larger floor areas.
As such, the biogenic carbon storage intensity (i.e. amount of biogenic carbon stored in a building’s materials, normalised by a functional unit, kg C/m2 GFA) is generally greater in the older construction periods (for more details, see the supplemental data online). For example, the highest mean carbon storage intensity is found in the 1940–59 era at 18.1 kg C/m2, followed by the 1980–89 era at 12.3 kg C/m2, whereas the 2000–09 and 2010–19 eras show lower values of 6.6 kg C/m2.
From a material perspective, surprisingly, 56% of the existing biogenic carbon storage in the residential building stock is located in mineral buildings. This is mainly explained by the fact that mineral buildings account for the majority of the residential stock across all eras, representing about 88% of total GFA. In addition, buildings classified as mineral are rarely composed entirely of mineral materials, as they typically contain some timber products in structural components, roof trusses or other building elements. Timber buildings account for 15% of the total carbon storage in the residential building stock while representing only 3.8% of the total GFA. Hybrid timber buildings account for a further 25.9% of total carbon storage, while hybrid mineral buildings account for only 2.7%.
When separated by building type, blocks of flats contain 46% of the total carbon storage despite representing the majority of the total GFA across all eras. This is largely explained by the predominant use of mineral structural systems in this typology and generally, different construction practices, which result in lower quantities of wood products per unit of floor area. Single-family dwellings, by contrast, contain approximately 54% of the total carbon storage while representing only about 19% of the total GFA. This reflects the much higher use of wood products in detached housing.
3.2 ACTUAL BIOGENIC CARBON STORAGE COMPARED WITH THE IPCC’s MODELS
Figure 5 compares the estimated biogenic carbon storage in Helsinki’s existing residential stock with the amount of original biogenic carbon remaining under the normal replacement-cycle scenario and the IPCC’s default 35-year half-life approach, both modelled on the production data.
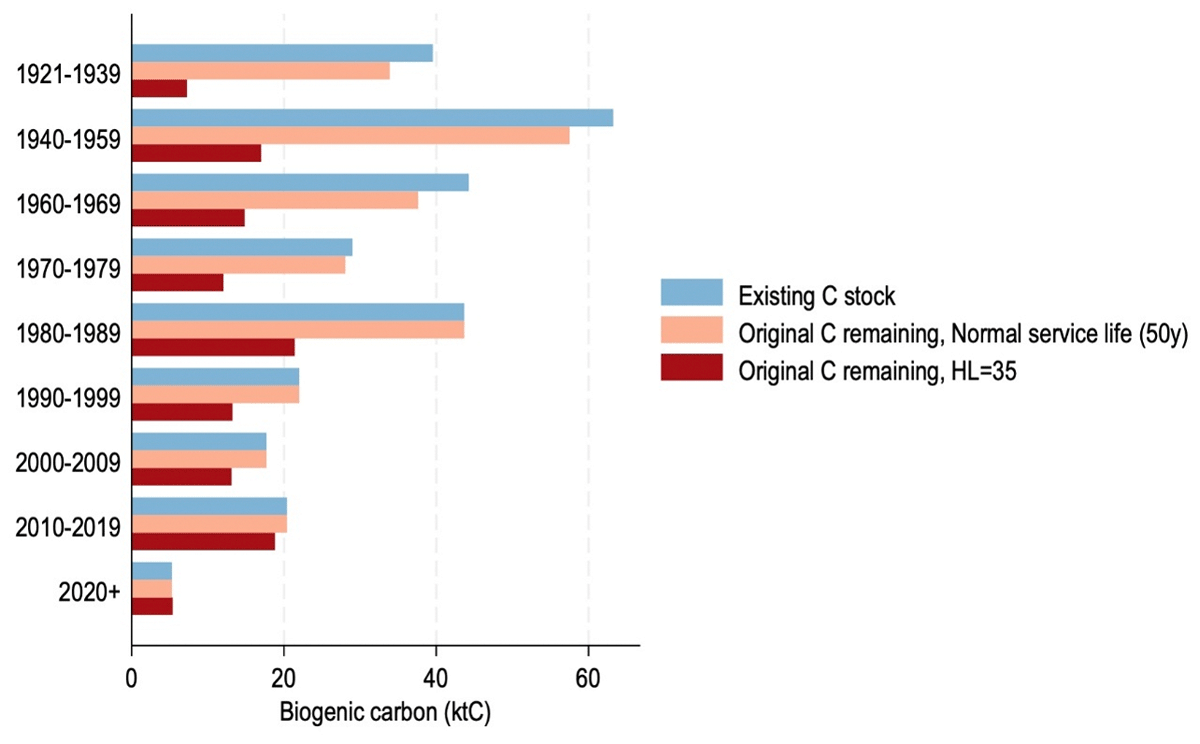
Figure 5
Estimated biogenic carbon storage in the existing residential stock in Helsinki compared with the biogenic carbon storage estimates derived using replacement cycles and the Intergovernmental Panel on Climate Change’s (IPCC) default 35-year half-life.
Under the normal replacement cycle scenario, structural timber is assumed to remain in use for the duration of the building, while wood in replaceable components follows the 50-year replacement cycle defined in Section 2.2.5. This results in an estimated 266 kt C remaining from the original wood products, compared with approximately 285 kt C in the existing residential building stock. The difference is concentrated in the older construction periods, where the replacement cycle has already been reached. For buildings constructed from 1980 onwards, the values are equal because the 50-year cycle had not elapsed by the end of the study period. Figure 5 represents the remaining biogenic carbon associated with the original wood products; carbon introduced through subsequent replacement products is not included in this comparison.
The IPCC scenario applies a different mechanism. The default 35-year half-life uses a first-order decay function, whereby a constant proportion of the remaining solid-wood HWP pool is assumed to leave use annually. Applied to the historical production data, this approach results in approximately 123 kt C remaining in use in 2021, compared with the estimated 285 kt C associated with the existing building stock. The difference is particularly pronounced for the older construction periods, where the decay function assigns a substantially larger outflow of the original wood products over time.
The comparison shows that when the IPCC’s default 35-year half-life decay function is used to estimate biogenic carbon storage in buildings, it does not reproduce the level of storage estimated from existing residential stock. The old construction eras have the highest cumulative carbon storage values due to high construction rates and high share of wood material. However, due to the decay function applied in the IPCC accounting method, a large share, up to 80%, of this carbon is assumed to have already left the product pool over time.
3.3 SENSITIVITY ANALYSIS
A sensitivity analysis was conducted by varying the replacement cycles of wood components between the minimum and maximum technical service lives recommended by the Finnish technical guideline (Rakennustieto 2025), while keeping the building stock and material assumptions unchanged. The results are presented in Table 3. This tests how sensitive the estimated remaining biogenic carbon is to assumptions about the timing of component replacement.
Table 3
Sensitivity analysis of replacement-cycle assumptions and their effect on the original biogenic carbon remaining in use.
| SCENARIO | REPLACEMENT CYCLE (YEARS) | ORIGINAL CARBON REMAINING (KT C) | SHARE OF ORIGINAL HWP REMAINING IN USE (%) | SHARE OF REPLACED HWP (%) | THEORETICAL HALF-LIFE EQUIVALENT (YEARS) |
|---|---|---|---|---|---|
| Short service life | 30–40 | 190 | 67% | 33% | 51 |
| Average service life | 50 | 266 | 93% | 7% | 503 |
| Long service life | 70 | 278 | 97% | 3% | 1,899 |
[i] Note: Theoretical half-life equivalent is derived with a first-order decay function. HWP = harvested wood products.
The replacement interval has a substantial influence on the amount of original biogenic carbon remaining in the building stock. The results show that the estimated storage is particularly sensitive to assumptions that shorten component service lives.
To facilitate comparison with the IPCC’s first-order decay approach, an equivalent theoretical half-life was also calculated for each replacement scenario. This represents the half-life that an exponential decay function would require to produce the same proportion of original carbon remaining after the corresponding replacement cycle. It is therefore a mathematical equivalent of the replacement-cycle result rather than an estimated service life of the buildings or wood components. The resulting equivalent half-lives are approximately 51 years for the short service life scenario, 503 years for the average scenario and 1899 years for the long service life scenario.
4. DISCUSSION
Empirical evidence on building stock survival is essential for estimating biogenic carbon storage in the built environment and testing the assumptions used to represent HWPs. Much of the existing literature relies on default half-lives or assumed service lives, although biogenic carbon storage in HWPs depends directly on the continued use of buildings and the replacement of components. Therefore, this study addressed this gap by examining the observed survival of residential buildings in Helsinki, quantifying cumulative biogenic carbon storage from 1921 to 2021, and comparing the results with estimates based on component replacement cycles and the IPCC’s default 35-year half-life for solid wood products. Finland provides a relevant context for this analysis due to its reliance on forest resources and its bioeconomy strategy.
The analysis combined three datasets: existing residential building stock data, historical residential construction data and material intensity data for representative building cohorts. Approximately 97% of the residential floor area in the analysed production data remains in use, indicating high survival rates over time. Buildings with a timber load-bearing frame account for 40% of total biogenic carbon storage, despite accounting for only 10% of the GFA. This highlights the importance of load-bearing timber structures for long-term carbon storage. The existing stock contains an estimated 285 kt C, compared with 266 kt C when normal component replacement cycles are applied and approximately 123 kt C when historical production is modelled using the IPCC’s default 35-year half-life. The comparison therefore indicates that the default decay function produces substantially lower estimates when applied specifically to biogenic carbon storage in long-lived residential building components.
Several factors may contribute to the high survival of the residential stock and the associated biogenic carbon storage. The studied region experienced sustained population growth over much of the study period, supporting continued demand for residential buildings (City of Helsinki 2022). Institutional and policy factors also play an important role in shaping how long buildings remain in use. Planning regulations, zoning policies, renovation programmes and heritage protection can extend building service life (Paavilainen et al. 2025), and, consequently, the residence time of biogenic carbon in the built environment. For instance, of the studied residential buildings, 1542 are located in protected areas. These areas account for approximately 9% of total GFA and 10% of total carbon storage, equivalent to about 29 kt C. Four of the largest (by amount of biogenic carbon stored) protected areas have all been constructed before the 1940s. This aspect further underlines the role of long-standing planning and protection measures in maintaining long-lived biogenic carbon storage in the residential built environment. This finding is also relevant for other cities with long-standing wooden residential districts (e.g. Porvoo and Rauma in Finland, Røros in Norway, Faubourg Marigny in New Orleans, US, etc.), where historic wooden urban areas remain part of the living city (Kalakoski et al. 2020). Protecting and maintaining such areas can therefore support both cultural heritage and climate goals (Blavier et al. 2023).
The results also align with broader patterns observed in building stock dynamics. Residential buildings tend to have longer lifespans than many non-residential building types, where demolition is often driven by functional or economic obsolescence. Commercial and office buildings may be replaced due to changing market demands, technological upgrades or redevelopment pressures, whereas residential buildings typically persist due to continued housing demand and stable land-use functions. This difference suggests that residential buildings may represent a particularly important sector for long-term biogenic carbon storage in the built environment. At the same time, adaptive reuse can support the continued use of non-residential buildings by accommodating new residential, commercial, cultural or other functions. Policies that support the maintenance, renovation, adaptation and continued use of existing buildings may therefore contribute to extending the residence time of biogenic carbon stored in wood products.
These findings have implications for accounting approaches used to represent carbon storage in different HWP applications. The IPCC’s default 35-year half-life is intended as an aggregate parameter for national GHG inventories and is not representative of the residence time of wood in individual buildings or components. Nevertheless, wood used in buildings forms part of the wider HWP pool, and the results show that applying the aggregate default to long-lived residential building applications can produce substantially different estimates from those derived from the existing stock and replacement cycles. The sensitivity analysis shows that assumptions about component replacement can substantially alter the amount of original biogenic carbon remaining in use, particularly for shorter lived wood products. More differentiated information on HWP end uses and residence times could therefore improve estimates where the objective is to quantify biogenic carbon storage in long-lived products. Also, distinguishing long-lived structural timber from components subject to periodic replacement would better reflect the different pathways through which wood remains in or leaves the built environment.
These findings are also relevant for emerging policy frameworks addressing carbon storage in long-lived products. The European Union’s Carbon Removal Certification Framework recognises carbon storage in long-lived products as a potential form of durable carbon removal (European Union 2024b). Reliable assessment of such storage requires assumptions that reflect differences between HWP applications and their residence times. Empirical building-stock data combined with component-specific replacement information could therefore provide a stronger basis for evaluating the contribution of long-lived wood products than the direct application of broad default parameters.
The findings of this study offer important insights for policymakers, decision-makers and researchers working within LCA and the built environment sector. While the assumption of a 50-year service life has provided a practical and standardised basis for LCA studies, the results suggest that it should not be interpreted as a prediction of building lifespan. This indicates there is an opportunity to further refine existing assumptions in order to better reflect real-world building performance. Incorporating empirical building-survival data and component-specific service lives can therefore provide complementary information for selecting appropriate modelling assumptions and evaluating long-term biogenic carbon storage.
4.1 LIMITATIONS AND FURTHER RESEARCH
Several limitations should be noted when interpreting the results. First, the comparison between historical production and existing stock does not denote demolition rates alone. According to Statistics Finland methodology, extensions and other major alterations of older buildings are recorded as new construction in production data, while in the stock data, these changes are allocated to the original construction year. This inflates production relative to the stock data, indicating that production statistics overestimate new construction and therefore affect estimates of observed building survival. For example, recent statistics indicate that around 6% of new construction floor area consists of the extension of existing buildings in Helsinki. Although extensions were excluded from production data where this was possible, this information was only available for the most recent years and does not address other changes affecting residential GFA, such as major alterations or conversions to and from residential use.
Second, the spatial extent of Helsinki has changed over time, which limits direct comparison with studies based on different municipal boundaries or time slices.
Third, carbon storage in this study refers only to biogenic carbon stored in wood materials and does not include other forms of carbon storage or removal. The analysis focuses on biogenic carbon storage rather than the overall life-cycle carbon balance of buildings. A comprehensive assessment would also include operational emissions during use and end-of-life emissions associated with demolition, transport, recycling or incineration.
Fourth, material intensity data were incomplete for some early decades and material combinations, especially for the period 1920s–50s. In these cases, values were estimated using the closest available decade or a closely related building typology, following the assumptions described in the Methods section.
Finally, the replacement-cycle analysis is based on standardised technical service lives rather than observed refurbishment histories and assumes simultaneous replacement of wood within each assigned category. Actual replacement practices may therefore differ between buildings and over time.
From the data perspective, further research should focus on improving the consistency and detail of long-term building stock datasets to derive more accurate building survival estimates. Better linkage between production, stock, demolition, extension and conversion data at the building level would reduce uncertainty, especially for early construction periods where production and material data remain limited. More detailed empirical information on component replacement and refurbishment would also improve the representation of biogenic carbon storage over time.
From the results perspective, further studies could extend this approach to national- and international scale assessments of biogenic carbon storage. This study area represents a growing urban area, where the demand for new residential construction has remained sound over a long period of time. It would be important to replicate the study in regions with declining population and demand, where the outcome could be substantially different. Similarly, this would allow a comparison of how construction practices, planning systems, and housing markets shape building survival and carbon storage. Further work should also examine the role of protected residential areas, as the results of this study suggest that these can preserve long-lived building stocks and support biogenic carbon storage in the built environment.
5. CONCLUSIONS
The built environment is a major source of greenhouse gases (GHG) emissions, and reducing these emissions requires the careful consideration of both material substitution and biogenic carbon storage in buildings. In recent years, the concerns that expanding the harvest for wood products could reduce forest carbon stocks and weaken carbon sinks have become topical. In this context, it is important to understand how much biogenic carbon is stored in the built environment and for how long, particularly in relation to near- and medium-term climate targets. This study examined the observed survival of residential buildings in Helsinki, quantified the biogenic carbon storage in the residential building stock and compared the results with estimates based on component replacement cycles and the Intergovernmental Panel on Climate Change’s (IPCC) default 35-year half-life used in national GHG inventories.
The results show a high survival rate of Helsinki’s residential building stock and substantial biogenic carbon storage in buildings that remain in use. When applied to historical production data for long-lived residential building components, the IPCC’s default 35-year decay function produces substantially lower storage estimates than those derived from the existing building stock. The analysis also shows that wood products are present across all building types, and that increasing the use of wood materials in place of more carbon-intensive alternatives can increase carbon storage in the stock. A climate policy implication of these findings would be to increase the number of wood elements in buildings instead of only favouring timber buildings. At the same time, the results indicate that planning, maintenance and heritage protection can help preserve this storage over longer periods.
AI DECLARATION
The research and scientific content are the authors’ own work and were not generated by artificial intelligence. Aalto AI Assistant, Aalto University’s internal AI service, was used for grammar and spellchecking. All final wording and content were reviewed and approved by the authors.
AUTHOR CONTRIBUTIONS
O.I.: main author; writing, editing and revision data analysis and interpretation. I.T.: data collection and analysis; writing and editing. A.A. and S.J.: advice, context, comments, and suggestions regarding the publication’s framing, structuring and editing.
DATA ACCESSIBILITY
The data underlying the findings of this study are provided in the supplemental data online that accompany this article.
SUPPLEMENTAL DATA
Supplemental data for this article can be accessed at: https://doi.org/10.5334/bc.849.s1