
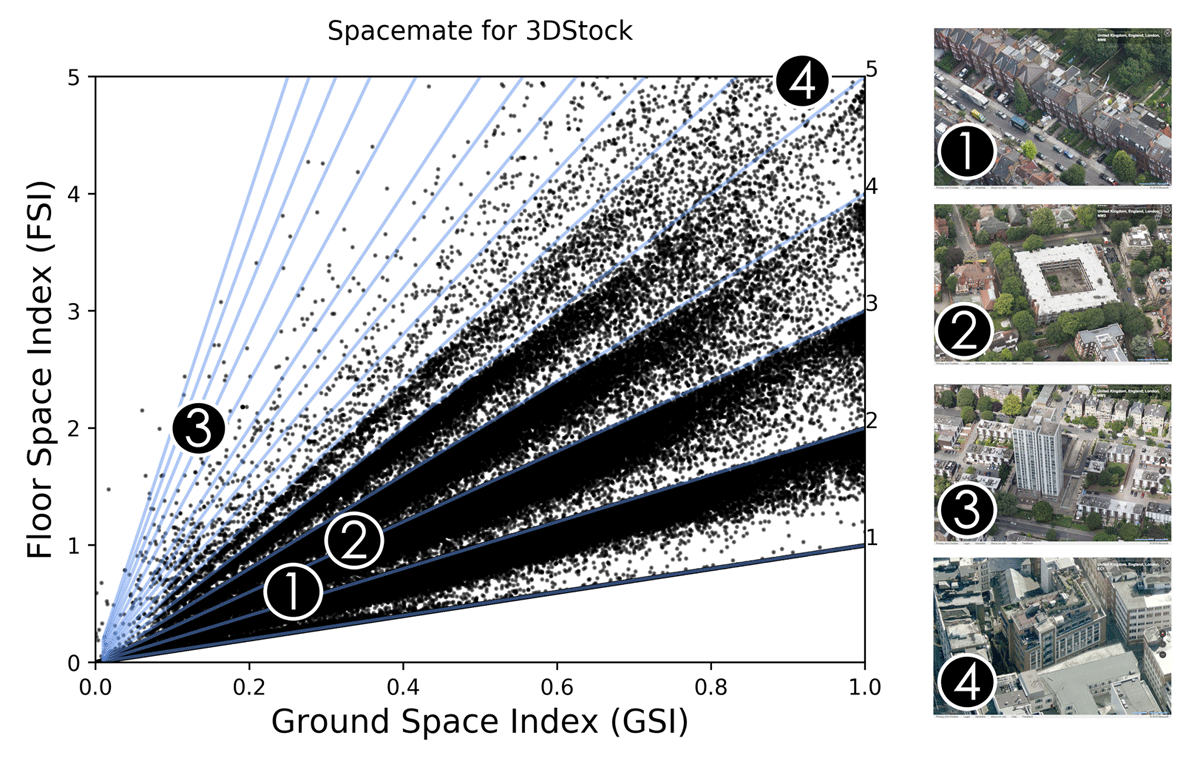
Figure 1
Distribution of London domestic buildings on Spacemate.
Source: Building images from Bing (www.bing.com/maps).
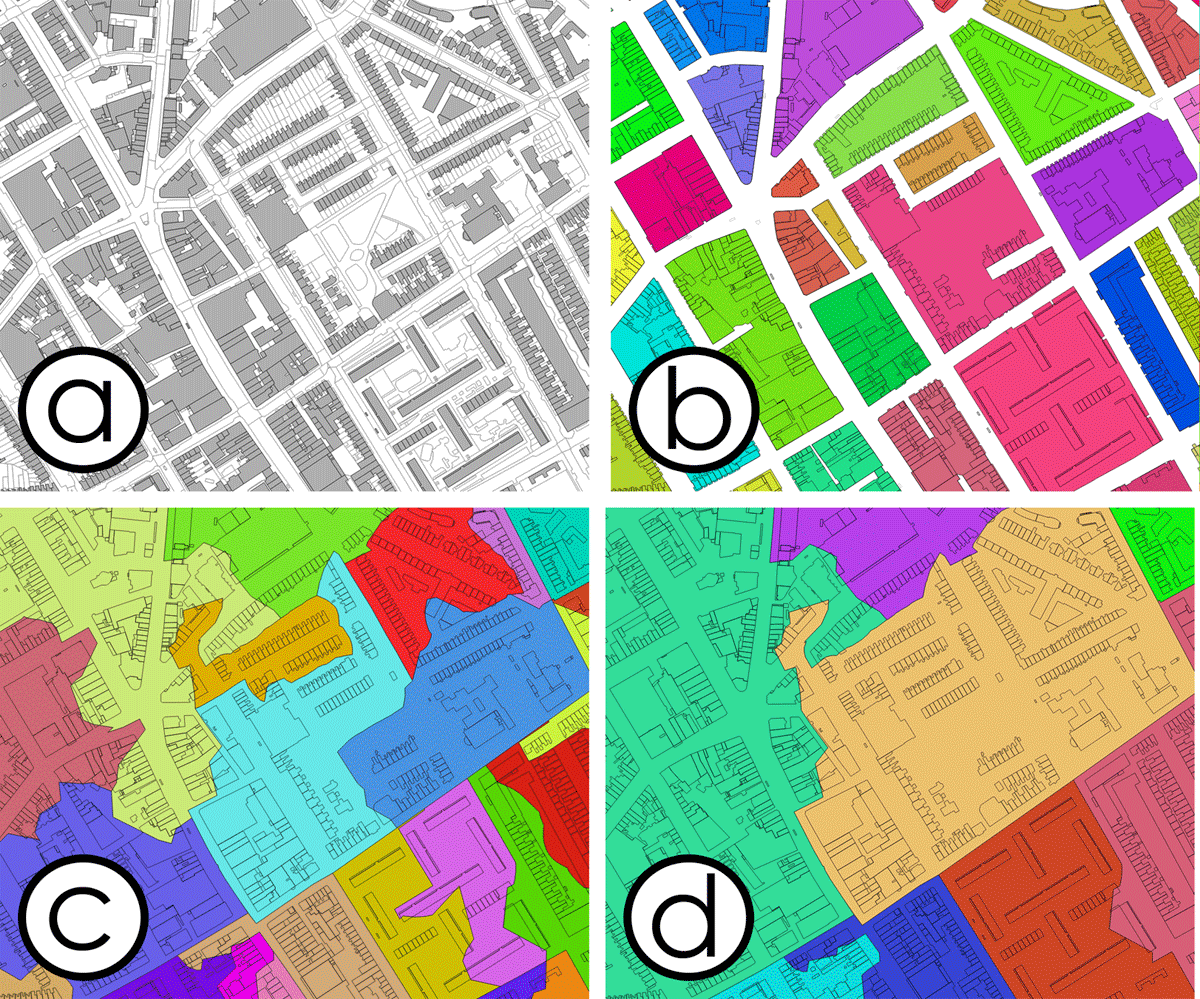
Figure 2
Different aggregate boundaries for an area of London: (a) self-contained units (SCUs); (b) built blocks (BBs); (c) output areas (OAs); and (d) lower layer super output areas (LSOAs).
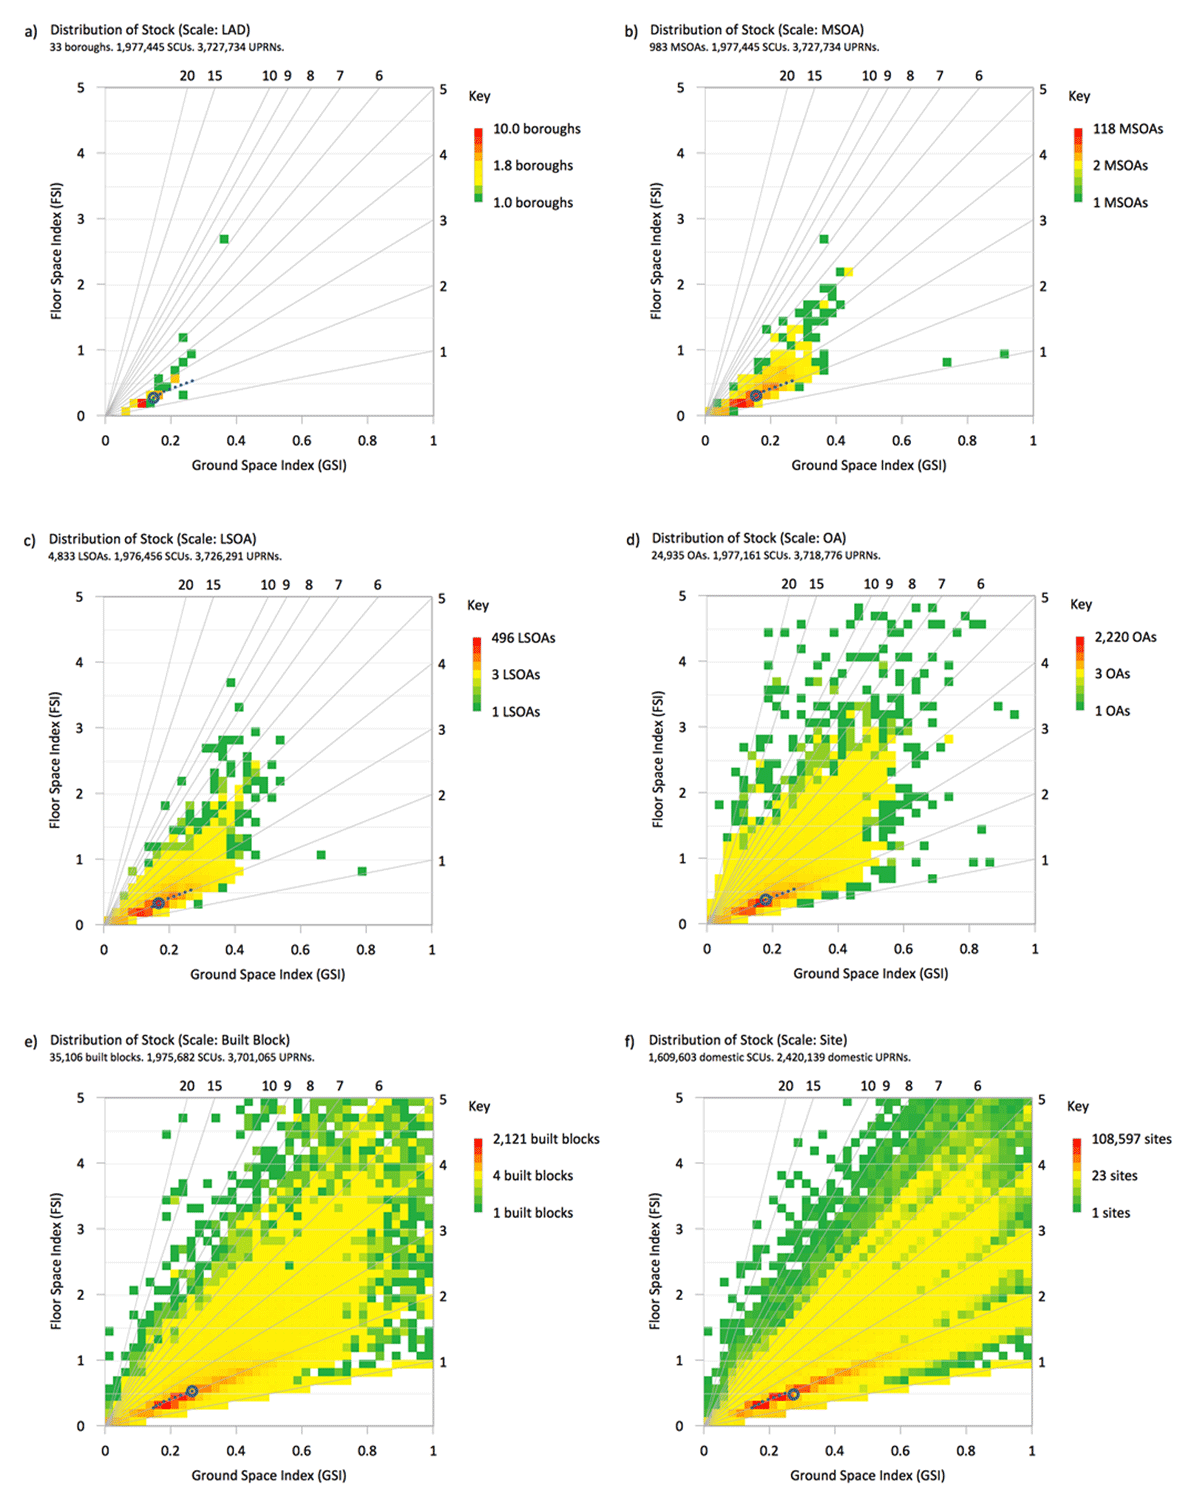
Figure 3
Distribution of the building stock of London plotted on Spacemate at various scales: (a) local authorities; (b) middle layer super output areas (MSOAs); (c) lower layer super output areas (LSOAs), (d) output areas (OAs), (e) built blocks (BBs); and (f) domestic self-contained units (SCUs).
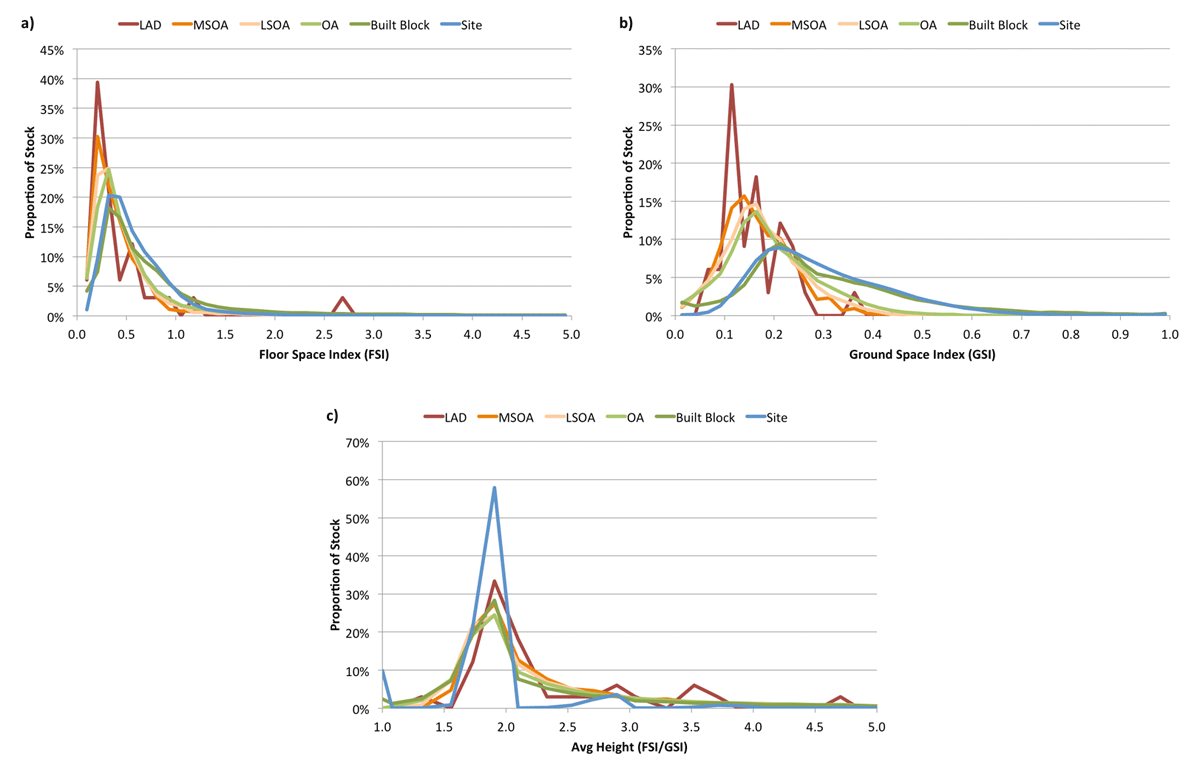
Figure 4
Distribution of the building stock of London at various scales with (a) Floor Space Index (FSI) value; (b) Ground Space Index (GSI) value; and (c) average height.
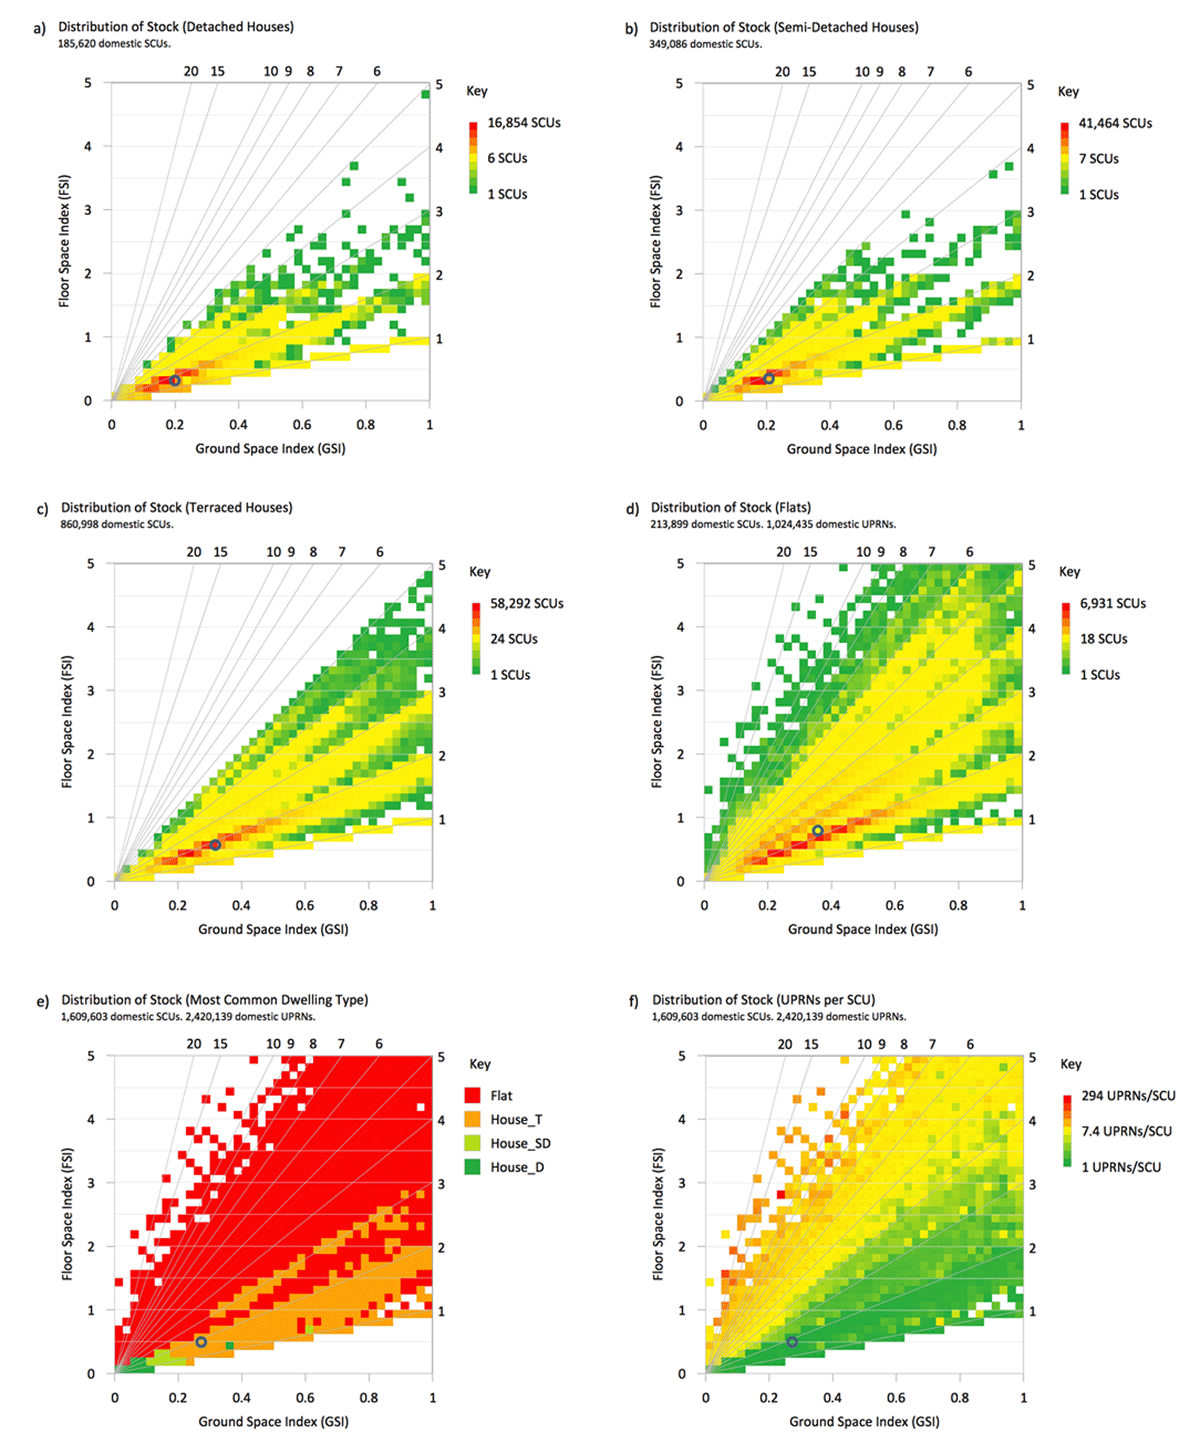
Figure 5
Distribution of domestic self-contained units (SCUs) of London plotted on Spacemate split by type: (a) detached houses; (b) semi-detached houses; (c) terraced houses; (d) flats; (e) the most common domestic building type by count; and (f) dwelling density (Unique Property Reference Numbers (UPRNs) per SCU).
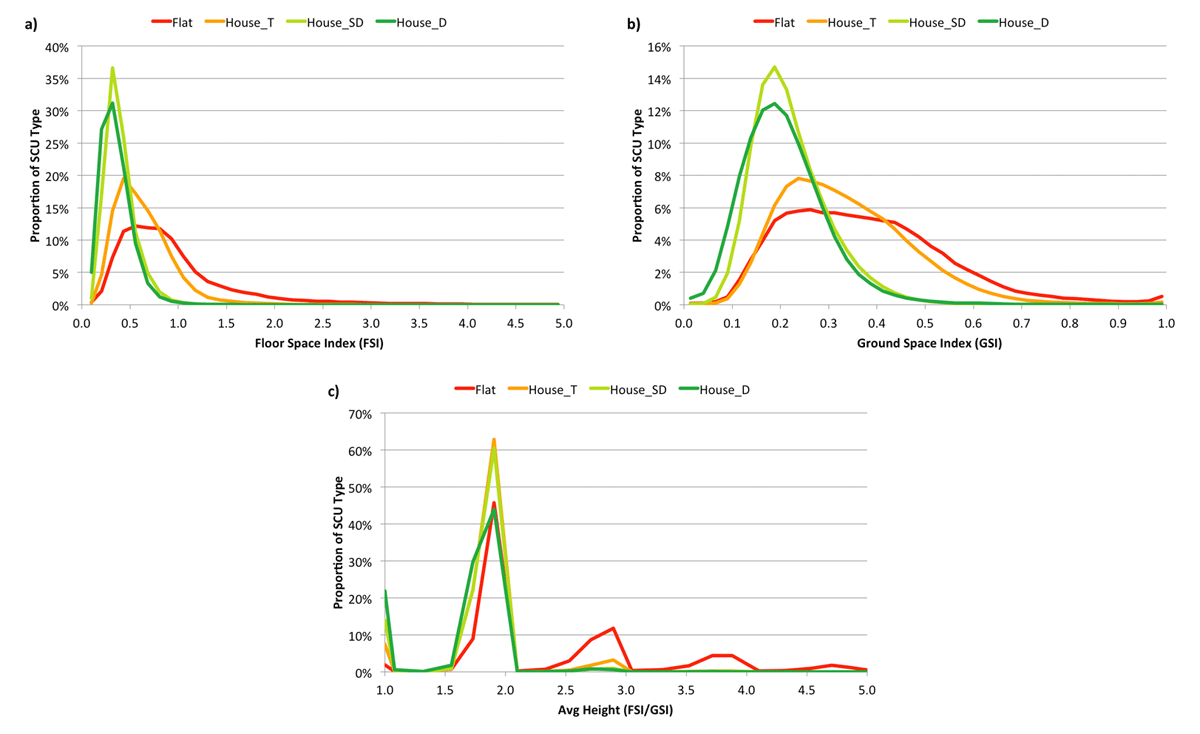
Figure 6
Distribution of domestic building types within London with: (a) Floor Space Index (FSI) value; (b) Ground Space Index (GSI) value; and (c) average height.
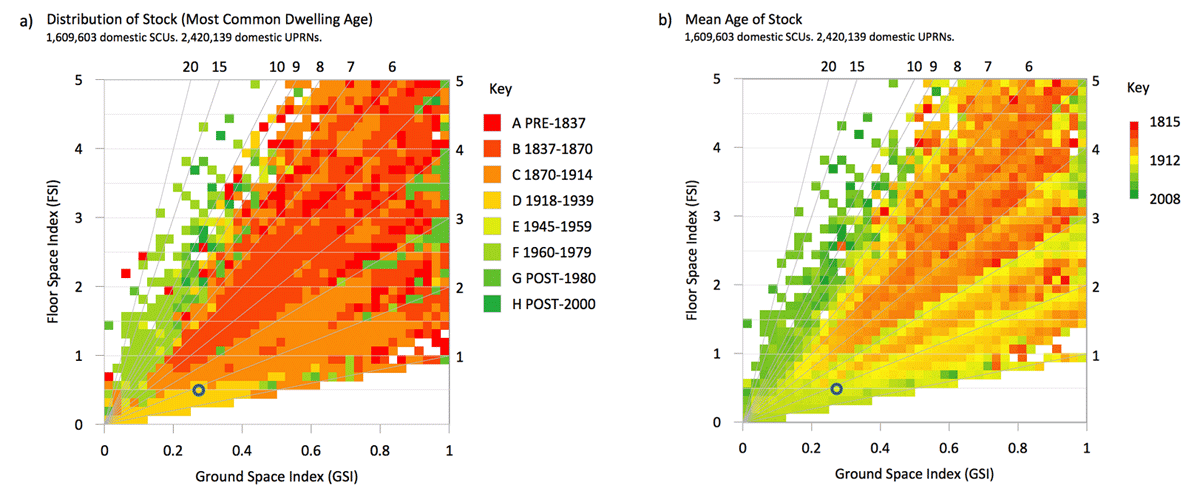
Figure 7
Building age plotted on Spacemate: (a) the most common building age by count; and (b) mean building age.
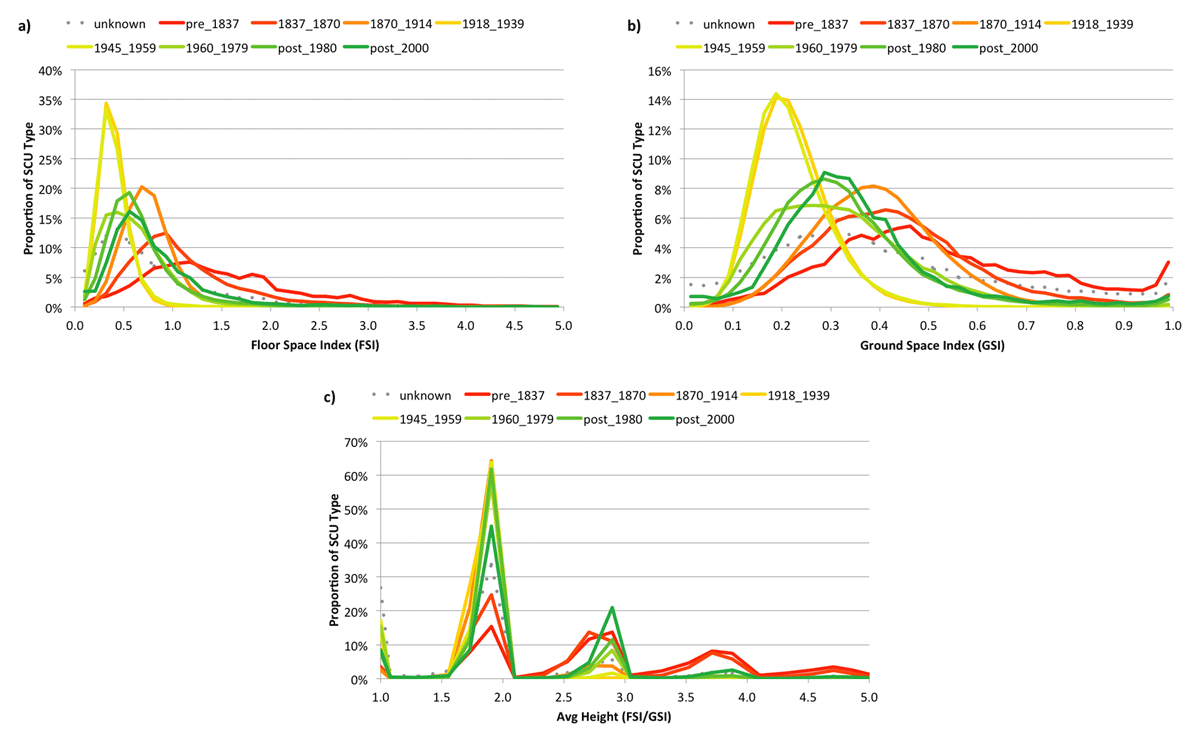
Figure 8
Distribution of building ages within London with: (a) Floor Space Index (FSI) value; (b) Ground Space Index (GSI) value; and (c) average height.
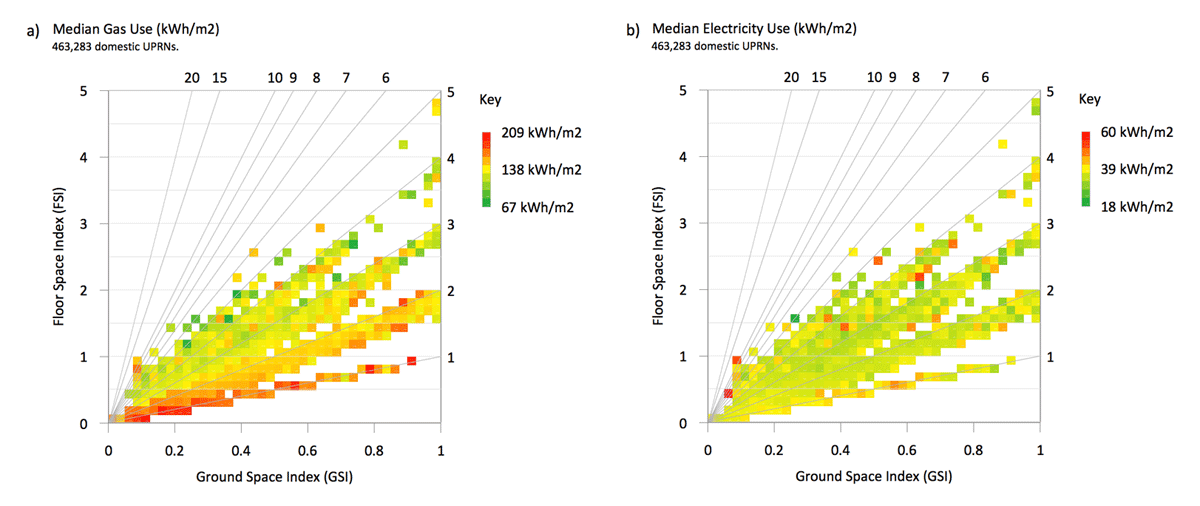
Figure 9
Median domestic energy-use intensities for gas-heated buildings plotted on Spacemate: (a) gas; and (b) electricity.
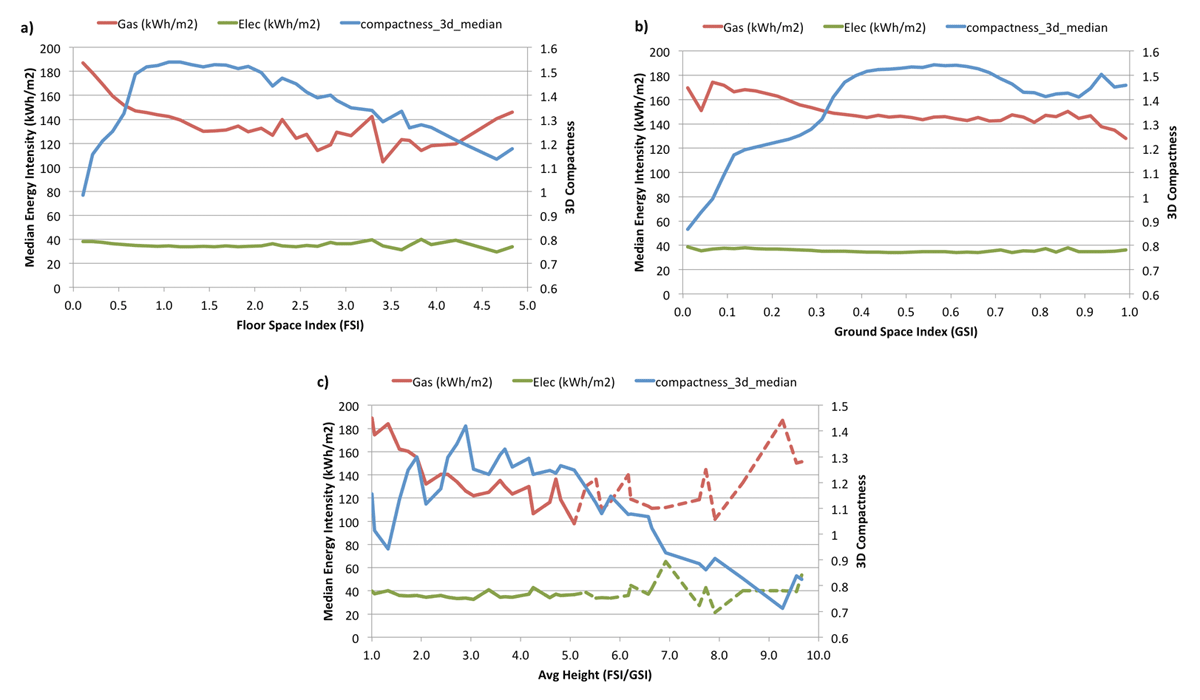
Figure 10
Median domestic energy-use intensity for gas-heated dwellings with: (a) Floor Space Index (FSI) value; (b) Ground Space Index (GSI) value; and (c) average height.